1991 Bristol City Council election

Last updated
1991 Bristol City Council election
Flag of England.svg
  1990 2 May 1991 1992  

23 of 68 seats (one third) to Bristol City Council
35 seats needed for a majority
 First partySecond partyThird party
 
Party Labour Conservative Liberal Democrat
Seats won45185
Seat changeIncrease2.svg2Decrease2.svg3Increase2.svg1

Council control before election

Labour Party (UK)

Council control after election

Labour Party (UK)

1991 local election results in Bristol Bristol ward results 1991.png
1991 local election results in Bristol

The 1991 Bristol City Council election took place on 2 May 1991 to elect members of Bristol City Council in England. This was on the same day as other local elections. One third of seats were up for election. Two seats were contested in Windmill Hill due to an extra vacancy occurring. There was a general swing against the Conservatives. In Lockleaze, the Labour Party failed to field a candidate because of a nomination papers error.

Bristol City Council local authority of Bristol, England

Bristol City Council is the local authority of Bristol, England. The council is a unitary authority, and is unusual in the United Kingdom in that its executive function is controlled by a directly elected mayor of Bristol. Bristol has 35 wards, electing a total of 70 councillors.

1991 United Kingdom local elections

Local elections were held in the United Kingdom in 1991. The results were a setback for the governing Conservative Party, who were left with their lowest number of councillors since 1973 - though their popular vote was an improvement from the 1990 local elections, and the Conservatives would go on to win the general election in 1992.

Contents

Ward results

The change is calculated using the results when these actual seats were last contested, i.e. the 1987 election.

Ashley

Ashley
PartyCandidateVotes%±
Labour H. Saad1,58147.9-7.1
Green D. Simpson83725.3+17.3
Conservative A. Calcutt45413.7-3.5
Liberal Democrat C. Bolton43113.0-6.8
Majority74422.5
Labour hold Swing -12.2

Bedminster

Bedminster
PartyCandidateVotes%±
Labour P. Crispin2,03145.3+8.9
Conservative I. Gillard1,40131.3-6.1
Liberal Democrat R. Hughes90020.1-4.4
Green N. Whittingham1493.3+1.6
Majority63014.1
Labour gain from Conservative Swing +7.5

Bishopsworth

Bishopsworth
PartyCandidateVotes%±
Labour D. Roberts1,75047.4+5.8
Conservative R. Eddy1,34536.4-3.8
Liberal Democrat V. Bartlett44412.0-5.2
Green B. Lewis1534.1+3.2
Majority40511.0
Labour hold Swing +4.8

Brislington East

Brislington East
PartyCandidateVotes%±
Labour P. Begley2,00245.4+2.0
Conservative A. Carey1,53134.7+0.8
Liberal Democrat R. Parsons73416.6-3.4
Green A. Clarke1443.3+0.7
Majority47110.7
Labour hold Swing +0.6

Brislington West

Brislington West
PartyCandidateVotes%±
Liberal Democrat B. Clarke2,52654.8+6.8
Labour J. Bees1,05722.9+1.6
Conservative J. Cressey90219.6-9.7
Green F. Loughran1282.8+1.5
Majority1,46931.8
Liberal Democrat hold Swing +2.6

Cabot

Cabot
PartyCandidateVotes%±
Liberal Democrat S. Brownlow1,56841.0+0.3
Labour C. Hackett1,11229.0+4.3
Conservative P. Cobbold83421.8-7.6
Green J. Quinnell3158.2+3.6
Majority45611.9
Liberal Democrat hold Swing -2.0

Easton

Easton
PartyCandidateVotes%±
Labour K. Yarwood1,64546.8+0.9
Liberal Democrat M. Smith1,20434.3-5.6
Conservative P. Warford42412.1-0.7
Green P. Taylor2406.8+5.4
Majority44112.6
Labour hold Swing +3.3

Eastville

Eastville
PartyCandidateVotes%±
Conservative J. Vowles1,60240.3-6.0
Labour J. Williams1,41535.6+2.4
Liberal Democrat G. Williams76419.2+1.3
Green S. Jeffery1904.8+2.2
Majority1874.7
Conservative hold Swing -4.2

Filwood

Filwood
PartyCandidateVotes%±
Labour G. Micklewright1,71971.2+1.2
Liberal Democrat L. Cooper30912.8+0.5
Conservative J. Lopresti28611.8-4.7
Green C. Presley1014.2+3.1
Majority1,41058.4
Labour hold Swing +0.4

Frome Vale

Frome Vale
PartyCandidateVotes%±
Conservative K. Blanchard2,27844.1+0.8
Labour M. McGrath2,17542.2+5.1
Liberal Democrat R. Windmill54210.5-9.1
Green B. Searle1653.2+3.2
Majority1032.0
Conservative hold Swing -2.2

Hartcliffe

Hartcliffe
PartyCandidateVotes%±
Labour F. Pidgeon1,67549.3+1.5
Conservative S. Willis1,06231.2+0.4
Liberal Democrat R. Beaty53815.8-3.5
Green H. Armstrong1243.6+1.6
Majority61318.0
Labour hold Swing +0.6

Hengrove

Hengrove
PartyCandidateVotes%±
Liberal Democrat J. Webb3,05056.1+21.3
Conservative B. Edwards1,25123.0-16.6
Labour R. Jones1,06319.5-6.1
Green L. Hersey741.4+1.4
Majority1,79933.1
Liberal Democrat gain from Conservative Swing +19.0

Hillfields

Hillfields
PartyCandidateVotes%±
Labour G. Robertson1,79248.8+2.9
Conservative A. Seville1,02427.9-7.0
Liberal Democrat G. Draper72719.8+0.6
Green S. Popperwell1263.4+3.4
Majority76820.9
Labour hold Swing +5.0

Knowle

Knowle
PartyCandidateVotes%±
Labour S. Lamprey1,87052.3+4.6
Conservative L. De'Ath1,00528.1-7.8
Liberal Democrat P. Lambourne58416.3+1.5
Green S. Ball1173.3+1.7
Majority86524.2
Labour hold Swing +6.2

Lawrence Hill

Lawrence Hill
PartyCandidateVotes%±
Labour J. Jones2,08666.2+3.9
Conservative H. Richmond49615.7-2.9
Liberal Democrat K. O'Hara41113.0-3.6
Green H. Irvine1595.0+5.0
Majority1,59050.4
Labour hold Swing +3.4

Lockleaze

Lockleaze
PartyCandidateVotes%±
Liberal Democrat I. Parry1,76359.8+47.4
Conservative M. Davis86529.3-3.5
Green R. Morrish32110.9+9.9
Majority89830.5
Liberal Democrat gain from Labour Swing +25.5

Southville

Southville
PartyCandidateVotes%±
Labour A. May2,11052.8+2.7
Conservative C. Stephenson1,06426.6-4.9
Liberal Democrat P. Hall54313.6-1.0
Green R. Martin2807.0+3.2
Majority1,04626.2
Labour hold Swing +3.8

St George East

St. George East
PartyCandidateVotes%±
Labour C. Price1,72743.7+8.7
Conservative D. Fey1,38134.9-7.4
Liberal Democrat S. Pritchard70917.9-3.0
Green M. Brambley1373.5+1.7
Majority3468.8
Labour gain from Conservative Swing +8.1

St George West

St. George West
PartyCandidateVotes%±
Labour J. Deasy1,91347.6+15.1
Liberal Democrat P. Main1,46436.4-14.7
Conservative M. Stump55613.8-2.6
Green M. Hooper852.1+2.1
Majority44911.2
Labour gain from Liberal Democrat Swing +14.9

Stockwood

Stockwood
PartyCandidateVotes%±
Conservative M. Stamper2,30743.1-7.3
Labour P. Garland2,10839.4+10.0
Liberal Democrat J. Collins80315.0-4.3
Green G. Collard1312.4+1.5
Majority1993.7
Conservative hold Swing -8.7

Whitchurch Park

Whitchurch Park
PartyCandidateVotes%±
Labour H. Holland2,02759.2+5.4
Conservative C. Trotman72521.2-6.2
Liberal Democrat R. Winch56716.6-0.9
Green B. Hussain1063.1+1.8
Majority1,30238.0
Labour hold Swing +5.8

Windmill Hill

Windmill Hill - 2 seats
PartyCandidateVotes%±
Labour D. Bunyan2,00845.1-6.3
Labour M. Ahmed1,848
Conservative W. Biggs1,00722.6-6.7
Liberal Democrat R. Kirkham90820.4+4.8
Green C. Bolton52911.9+8.1
Green M. Turnbull463
Majority84118.9
Labour hold Swing +0.2

Sources

Related Research Articles

Doug Naysmith former MP for Bristol NorthWest

John Douglas Naysmith is a British Labour Co-operative politician who was the Member of Parliament (MP) for Bristol North West from 1997 until standing down at the 2010 general election.

Politics of Bristol

The city of Bristol, England, is a unitary authority, represented by four MPs representing seats wholly within the city boundaries. As well as these, Filton and Bradley Stoke covers the northern urban fringe in South Gloucestershire and the north eastern urban fringe is in the Kingswood constituency. The overall trend of both local and national representation became left of centre, favouring the Labour Party and Liberal Democrats during the latter 20th century, but there was a shift to the right in the 2010 general election. The city has a tradition of local activism, with environmental issues and sustainable transport being prominent issues in the city.
1986 Bristol City Council election

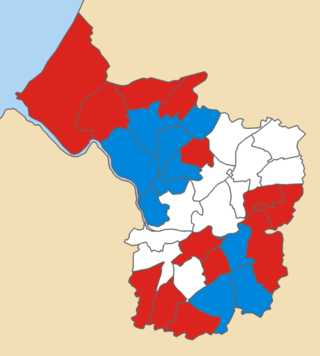
The 1986 Bristol City Council election took place on 8 May 1986 to elect members of Bristol City Council in England. This was on the same day as other local elections. One third of seats in the 1986 Council Elections in the English city of Bristol were up for election. The election in Brislington West was a by-election. There was a small swing away from the Conservatives and Labour regained a majority on the Council, which they kept until 2003.

1988 Bristol City Council election

The 1988 Bristol City Council election took place on 5 May 1988 to elect members of Bristol City Council in England. This was on the same day as other local elections. One third of seats were up for election. This was the first election following the merger of the Liberal Party and SDP to form the Social & Liberal Democrats. There were also several candidates representing the continuing SDP. There was a general small swing to Labour.
1990 Bristol City Council election

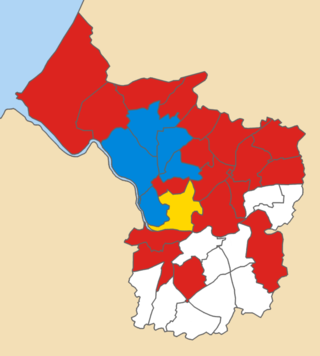
The 1990 Bristol City Council election took place on 3 May 1990 to elect members of Bristol City Council in England. This was on the same day as other local elections. One third of seats were up for election. There were by-elections in Brislington East and Easton. As Easton also had an election in the usual schedule, 2 seats were elected in that ward. There was a significant swing against the Liberal Democrats, largely as a result of the post-merger chaos that the party suffered.

1992 Bristol City Council election

The 1992 Bristol City Council election took place on 7 May 1992 to elect members of Bristol City Council in England. This was on the same day as other local elections. One third of seats were up for election. Two seats were contested in Hartcliffe due to an extra vacancy occurring. The elections were held just weeks after John Major's unexpected 1992 General election victory, and mirroring that result there was a strong swing from Labour to Conservative.

1994 Bristol City Council election

The 1994 Bristol City Council election took place on 5 May 1994 to elect members of Bristol City Council in England. This was on the same day as other local elections. One third of seats were up for election. The Bristol Party was formed by Bristol Rovers fans to campaign for a new stadium for the club. There was a general swing from the Conservatives and Greens to the Liberal Democrats, reflecting the beginning of the Conservative decline nationally and also the Liberal Democrat recovery after the merger troubles.

2010 Bristol City Council election

The 2010 Bristol City Council elections were held on Thursday 6 May 2010, for 23 seats, that being one third of the total number of councillors. The Liberal Democrats, who had won overall control of the council in 2009, increased their majority to six seats.

2011 Bristol City Council election

The 2011 Bristol City Council elections were held on Thursday 5 May 2011, for 24 seats, that being one third of the total number of councillors. The Liberal Democrats, who had won overall control of the council in 2009 and increased their majority in 2010, experienced a drop in support and lost 5 seats; 4 to the Labour Party and 1 to the Green Party, which gained its second ever council seat in Bristol. This meant that the Lib Dems no longer had a majority on the council. However, they continued to run the council, relying on opposition groups to vote through any proposal.

2013 Bristol City Council election

Elections for one third of Bristol City Council were held on 2 May 2013 as part of the 2013 United Kingdom local elections. No party gained overall control.

2014 Norwich City Council election

Council elections for the Norwich City Council were held on 22 May 2014 as part of the 2014 United Kingdom local elections. The elections were moved from earlier on in May to coincide with the East of England 2014 European Parliament election.

1998 Bristol City Council election

Elections to the Bristol City Council were held on 7 May 1998 as part of the 1998 United Kingdom local elections. 22 wards were contested.

The 2015 Bristol City Council election took place on 7 May 2015 to elect members of Bristol City Council in England. This was on the same day as other local elections.

2015 Norwich City Council election

The 2015 Norwich City Council election took place on 7 May 2015 to elect approximately one third of the members of Norwich City Council in England. This was on the same day as other local elections and the UK general election. Thirteen seats were due to be contested, with a further two seats up for election where casual vacancies had arisen. Labour won ten of the available seats, the Green Party won four, and the Liberal Democrats one. The Conservatives gained their highest ever vote in many city wards including Town Close and Thorpe Hamlet, and across Norwich came within almost 2000 votes of the Green Party, however failed to gain any seats. Just one seat changed hands - Wensum - which Labour gained from the Greens. Labour retained overall control of the council with 22 seats out of 39, the Greens continue to form the main opposition with 14 seats, and the Liberal Democrats have 3.

2016 Bristol City Council election

The 2016 Bristol City Council election took place on Thursday 5 May 2016, alongside nationwide local elections. Following a boundary review, the number of wards in the City was reduced to 34, with each electing one, two or three Councillors. The overall number of Councillors remained 70, with all seats are up for election at the same time. Elections would then be held every 4 years.

1999 Bristol City Council election

The 1999 Bristol City Council election took place on 6 May 1999, on the same day as other local elections. All seats were up for election due to boundary changes, with each ward electing 2 councillors. The total number of seats on the council increased by 2 due to the creation of a new ward: Clifton East.
2003 Bristol City Council election

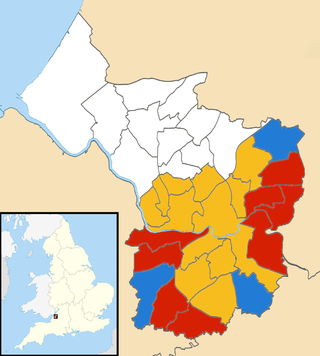
The 2003 Bristol City Council election took place on 1 May 2003, on the same day as other local elections in the UK. The Labour Party made a number of losses, mainly to the Liberal Democrats, and lost overall control of the council. Loses included Council leader Diane Bunyan, who lost her Windmill Hill seat to the Liberal Democrats. This year also saw elections contested by the new Bristolian Party, founded by the local 'scandal sheet' The Bristolian, though they failed to win any seats.

1991 Boston City Council election

Boston City Council elections were held on November 5, 1991. All thirteen seats were contested in the general election, and had also been contested in the preliminary election held on September 24, 1991.

The 1991 Cardiff City Council election was held on Thursday 2 May 1991 to the district council of Cardiff in South Glamorgan, Wales. It took place on the same day as other district council elections in Wales and England. The Labour Party regained a majority on Cardiff City Council, after sharing government for the previous four years.