This article needs additional citations for verification .(April 2016) |
| |||||||||||||
All 84 seats to Bristol City Council 43 seats needed for a majority | |||||||||||||
---|---|---|---|---|---|---|---|---|---|---|---|---|---|
| |||||||||||||
|
The 1973 Bristol City Council election took place on 7 June 1973 to elect members of Bristol City Council in England. [1] This was on the same day as other local elections. Voting took place across 28 wards, each electing 3 Councillors. Following the Local Government Act 1972, this was the first election to the new non-metropolitan district council for Bristol, which came into being on 1 April the following year. Labour took control of the Council after winning a comfortable majority of seats.
The National Front stood in four wards in this election [2]
Party | Candidate | Votes | % | ±% | |
---|---|---|---|---|---|
Labour | V Pople | 2,786 | |||
Labour | J Ellis | 2,684 | |||
Labour | J Britton | 2,459 | |||
Conservative | R Banfield | 1,025 | |||
Conservative | J Henley | 961 | |||
Conservative | J Taylor | 948 | |||
Communist | D Pratt | 266 | |||
Majority | |||||
Labour win (new seat) | |||||
Labour win (new seat) |
Party | Candidate | Votes | % | ±% | |
---|---|---|---|---|---|
Labour | A Hillman | 1,322 | |||
Labour | J Wood | 1,174 | |||
Labour | H McKay | 1,120 | |||
Independent | M Bidgood | 996 | |||
Conservative | I Gillard | 652 | |||
Conservative | C Taylor | 636 | |||
Conservative | I Dawson | 620 | |||
Independent | J Rowe | 459 | |||
Independent | N Juliff | 453 | |||
National Front | D Hales | 266 | |||
Majority | |||||
Labour win (new seat) | |||||
Labour win (new seat) |
Party | Candidate | Votes | % | ±% | |
---|---|---|---|---|---|
Conservative | D Topham | 1,626 | |||
Conservative | T Clarke | 1,525 | |||
Conservative | M Withers | 1,518 | |||
Liberal | K Tucker | 723 | |||
Liberal | A Cook | 658 | |||
Labour | S Cullard | 613 | |||
Labour | P McLaren | 606 | |||
Liberal | D Burrows | 602 | |||
Labour | M Wood | 565 | |||
Majority | |||||
Conservative win (new seat) | |||||
Conservative win (new seat) |
Party | Candidate | Votes | % | ±% | |
---|---|---|---|---|---|
Labour | L Smith | 1,938 | |||
Labour | R Morris | 1,872 | |||
Labour | A Munroe | 1,842 | |||
Independent | D Street | 855 | |||
Independent | R Rowe | 819 | |||
Independent | S Juliffe | 733 | |||
Communist | B Poole | 153 | |||
Communist | D Watson | 128 | |||
Majority | |||||
Labour win (new seat) | |||||
Labour win (new seat) |
Party | Candidate | Votes | % | ±% | |
---|---|---|---|---|---|
Labour | K Legg | 1,919 | |||
Labour | H Skeates | 1,781 | |||
Labour | G Holmes | 1,779 | |||
Conservative | O Scantlebury | 1,604 | |||
Conservative | T Bray | 1,593 | |||
Conservative | P Elliott | 1,465 | |||
Majority | |||||
Labour win (new seat) | |||||
Labour win (new seat) |
Party | Candidate | Votes | % | ±% | |
---|---|---|---|---|---|
Liberal | G Ferguson | 1,075 | |||
Liberal | W Watts-Miller | 1,036 | |||
Liberal | G Beedell | 1,034 | |||
Labour | F Brown | 883 | |||
Conservative | P Maggs | 834 | |||
Conservative | P Patemoster | 792 | |||
Conservative | G Woodhouse | 756 | |||
Labour | A Kimpton | 703 | |||
Labour | E Malos | 696 | |||
Majority | |||||
Liberal win (new seat) | |||||
Liberal win (new seat) |
Party | Candidate | Votes | % | ±% | |
---|---|---|---|---|---|
Conservative | J Lloyd-Kirk | 1,623 | |||
Conservative | T Girling | 1,601 | |||
Conservative | H Lawson | 1,571 | |||
Liberal | A Hodges | 716 | |||
Liberal | M Perkins | 689 | |||
Labour | F Inglis | 684 | |||
Labour | J Donovan | 643 | |||
Labour | M Thomas | 511 | |||
Communist | M Beardon | 184 | |||
Majority | |||||
Conservative win (new seat) | |||||
Conservative win (new seat) |
Party | Candidate | Votes | % | ±% | |
---|---|---|---|---|---|
Conservative | F Apperley | 1,462 | |||
Conservative | J Bosdet | 1,456 | |||
Conservative | R Trench | 1,447 | |||
Labour | J Malos | 1,094 | |||
Labour | P Phillips | 1,087 | |||
Labour | G Micklewright | 1,063 | |||
Majority | |||||
Conservative win (new seat) | |||||
Conservative win (new seat) |
Party | Candidate | Votes | % | ±% | |
---|---|---|---|---|---|
Conservative | G Palmer | 2,650 | |||
Conservative | G Browne | 2,525 | |||
Conservative | P Berrill | 2,473 | |||
Liberal | G Beddoes | 958 | |||
Liberal | E Mallett | 876 | |||
Labour | D Blackman | 591 | |||
Labour | E Holland | 575 | |||
Labour | M Smith | 526 | |||
Majority | |||||
Conservative win (new seat) | |||||
Conservative win (new seat) |
Party | Candidate | Votes | % | ±% | |
---|---|---|---|---|---|
Labour | J Jones | 1,205 | |||
Labour | G Maggs | 1,183 | |||
Labour | W Jenkins | 1,076 | |||
Conservative | S Russell | 341 | |||
Communist | N Carey | 135 | |||
Majority | |||||
Labour win (new seat) | |||||
Labour win (new seat) |
Party | Candidate | Votes | % | ±% | |
---|---|---|---|---|---|
Labour | E Fothergill | 1,561 | |||
Labour | W Williams | 1,560 | |||
Labour | B Ross | 1,451 | |||
Conservative | E Macdonald | 918 | |||
Conservative | A Thomas | 905 | |||
Conservative | M Bessant | 857 | |||
Liberal | A Chalmers | 807 | |||
Liberal | S Clements | 618 | |||
Liberal | B Payton | 572 | |||
Majority | |||||
Labour win (new seat) | |||||
Labour win (new seat) |
Party | Candidate | Votes | % | ±% | |
---|---|---|---|---|---|
Labour | J Fisk | 2,989 | |||
Labour | D Large | 2,762 | |||
Labour | G Brass | 2,664 | |||
Conservative | D Evans | 2,480 | |||
Conservative | W Lippiatt | 2,456 | |||
Conservative | R Biggs | 2,396 | |||
Majority | |||||
Labour win (new seat) | |||||
Labour win (new seat) |
Party | Candidate | Votes | % | ±% | |
---|---|---|---|---|---|
Labour | W Graves | 1,950 | |||
Labour | A Abrams | 1,774 | |||
Labour | M Houlihan | 1,510 | |||
Conservative | G Bridcut | 619 | |||
Majority | |||||
Labour win (new seat) | |||||
Labour win (new seat) |
Party | Candidate | Votes | % | ±% | |
---|---|---|---|---|---|
Labour | C Draper | 1,985 | |||
Labour | F Vyvyan-Jones | 1,915 | |||
Labour | R Thomas | 1,871 | |||
Conservative | D Thompson | 1,032 | |||
Conservative | C Baker | 996 | |||
Conservative | P Haines | 983 | |||
Majority | |||||
Labour win (new seat) | |||||
Labour win (new seat) |
Party | Candidate | Votes | % | ±% | |
---|---|---|---|---|---|
Labour | C Merrett | 2,467 | |||
Labour | R Edwards | 2,400 | |||
Labour | R Hewlett | 2,360 | |||
Conservative | B Topham | 2,063 | |||
Conservative | D Macduff | 1,893 | |||
Conservative | R Wookey | 1,762 | |||
Majority | |||||
Labour win (new seat) | |||||
Labour win (new seat) |
Party | Candidate | Votes | % | ±% | |
---|---|---|---|---|---|
Conservative | G Sprackling | 1,800 | |||
Conservative | E Wright | 1,685 | |||
Conservative | F Lawrence | 1,556 | |||
Labour | G Sheppard | 973 | |||
Labour | G England | 953 | |||
Labour | G Cole | 912 | |||
Liberal | D Beaven | 590 | |||
Majority | |||||
Conservative win (new seat) | |||||
Conservative win (new seat) |
Party | Candidate | Votes | % | ±% | |
---|---|---|---|---|---|
Conservative | C Hebblethwaite | 1,528 | |||
Conservative | G Keeley | 1,516 | |||
Conservative | G Hebblethwaite | 1,506 | |||
Liberal | J Ord | 849 | |||
Liberal | C Sara | 840 | |||
Liberal | C Ord | 816 | |||
Labour | M Merrett | 450 | |||
Labour | C Langham | 448 | |||
Labour | R Langley | 421 | |||
Majority | |||||
Conservative win (new seat) | |||||
Conservative win (new seat) |
Party | Candidate | Votes | % | ±% | |
---|---|---|---|---|---|
Labour | H Willcox | 1,465 | |||
Labour | D Jackson | 1,366 | |||
Labour | J Comerford | 1,149 | |||
Conservative | V Goodland | 722 | |||
Conservative | J Finnimore | 562 | |||
National Front | P Thomas | 424 | |||
Majority | |||||
Labour win (new seat) | |||||
Labour win (new seat) |
Party | Candidate | Votes | % | ±% | |
---|---|---|---|---|---|
Labour | J Hole | 1,987 | |||
Conservative | F McGough | 1,931 | |||
Labour | S Grace | 1,848 | |||
Labour | R Bridle | 1,801 | |||
Conservative | T Wetherall | 1,779 | |||
Conservative | I Hamilton | 1,779 | |||
Ind. Conservative | G Chappell | 900 | |||
Majority | |||||
Labour win (new seat) | |||||
Conservative win (new seat) | |||||
Labour win (new seat) |
Party | Candidate | Votes | % | ±% | |
---|---|---|---|---|---|
Labour | F Smith | 1,336 | |||
Labour | F Pidgeon | 1,260 | |||
Labour | M Young | 1,202 | |||
Conservative | W Blackmore | 1,061 | |||
Conservative | L White | 907 | |||
Conservative | P Barnwell | 876 | |||
Majority | |||||
Labour win (new seat) | |||||
Labour win (new seat) |
Party | Candidate | Votes | % | ±% | |
---|---|---|---|---|---|
Labour | H Bloom | 1,855 | |||
Labour | L Rexworthy | 1,798 | |||
Labour | D Beer | 1,779 | |||
Conservative | K Mountstephen | 1,143 | |||
Conservative | E Cockrell | 1,109 | |||
Conservative | F Stockham | 1,027 | |||
Majority | |||||
Labour win (new seat) | |||||
Labour win (new seat) |
Party | Candidate | Votes | % | ±% | |
---|---|---|---|---|---|
Labour | I Rogers | 1,128 | |||
Labour | J McLaren | 1,111 | |||
Labour | M Rea | 1,088 | |||
Liberal | V Hales | 591 | |||
Liberal | A Chalmers | 515 | |||
Conservative | I Beddoe | 475 | |||
Liberal | D Seymour | 468 | |||
National Front | A Nelmes | 238 | |||
Majority | |||||
Labour win (new seat) | |||||
Labour win (new seat) |
Party | Candidate | Votes | % | ±% | |
---|---|---|---|---|---|
Labour | D McLaren | 1,045 | |||
Labour | G Fowler | 995 | |||
Labour | A Norton | 989 | |||
Conservative | T Mort-Williams | 507 | |||
Majority | |||||
Labour win (new seat) | |||||
Labour win (new seat) |
Party | Candidate | Votes | % | ±% | |
---|---|---|---|---|---|
Labour | I Knight | 766 | |||
Labour | L Lane | 759 | |||
Labour | A Pegler | 754 | |||
Conservative | J Douglas-Green | 292 | |||
Majority | |||||
Labour win (new seat) | |||||
Labour win (new seat) |
Party | Candidate | Votes | % | ±% | |
---|---|---|---|---|---|
Conservative | P Brook | 2,530 | |||
Conservative | T Whiteley | 2,444 | |||
Conservative | H Williams | 2,397 | |||
Labour | G Bee | 2,080 | |||
Labour | E Skuse | 2,015 | |||
Labour | R Denyer | 1,980 | |||
Majority | |||||
Conservative win (new seat) | |||||
Conservative win (new seat) |
Party | Candidate | Votes | % | ±% | |
---|---|---|---|---|---|
Labour | G Easton | 2,888 | |||
Labour | V Bath | 2,796 | |||
Labour | D Poole | 2,757 | |||
Conservative | G Barrow | 2,558 | |||
Conservative | J Howe | 2,525 | |||
Conservative | R Huxham | 2,300 | |||
Liberal | J Phillips | 778 | |||
Majority | |||||
Labour win (new seat) | |||||
Labour win (new seat) |
Party | Candidate | Votes | % | ±% | |
---|---|---|---|---|---|
Conservative | R Wall | 3,995 | |||
Conservative | D Poole | 3,950 | |||
Conservative | C Alderson | 3,813 | |||
Liberal | C Everett | 1,878 | |||
Liberal | E David | 1,749 | |||
Liberal | N Fern | 1,520 | |||
Labour | M Waddington | 631 | |||
Labour | G Waddington | 627 | |||
Labour | R Willis | 614 | |||
Majority | |||||
Conservative win (new seat) | |||||
Conservative win (new seat) |
Party | Candidate | Votes | % | ±% | |
---|---|---|---|---|---|
Labour | B Richards | 1,136 | |||
Labour | C Roberston | 1,022 | |||
Labour | R Wilmott | 1,009 | |||
Conservative | D Watkins | 537 | |||
Conservative | R Douglas-Green | 491 | |||
National Front | R Bale | 326 | |||
Majority | |||||
Labour win (new seat) | |||||
Labour win (new seat) |
Wycombe District Council in Buckinghamshire, England was elected every four years from 1973 until 2020. Since the last boundary changes in 2003, 60 councillors were elected from 28 wards.
Liverpool City Council elections will be held every four years from 2023. Between 1973 and 2021 elections were generally held three years out of every four, with a third of the council being elected each time. Liverpool City Council is the local authority for the metropolitan borough of Liverpool in Merseyside, England. Since the last boundary changes in 2004, 90 councillors have been elected from 30 wards. New ward boundaries are being prepared to take effect from the 2023 election.
Bristol City Council is the local authority for Bristol, a unitary authority and ceremonial county in England. Until 1 April 1996 it was a non-metropolitan district in Avon. Since 2012 it has also had a directly elected mayor.
Bristol City Council is the local authority of Bristol, England. The council is a unitary authority. Bristol has 34 wards, electing a total of 70 councillors.
Chiltern District Council in Buckinghamshire, England was elected every four years from 1973 until 2020. Since the last boundary changes in 2003, 40 councillors were elected from 25 wards.
The city of Bristol, England, is a unitary authority, represented by four MPs representing seats wholly within the city boundaries. The overall trend of both local and national representation became left of centre during the latter 20th century. The city has a tradition of local activism, with environmental issues and sustainable transport being prominent issues in the city.
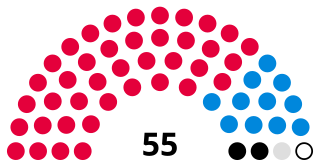
City of Doncaster Council is the local authority of the City of Doncaster, a metropolitan borough with city status in South Yorkshire, England. Prior to being awarded city status in 2022 the council was called Doncaster Metropolitan Borough Council. The council is based at the Civic Office in Waterdale, central Doncaster. It is one of four local authorities in South Yorkshire and provides the majority of local government services in Doncaster. The council is a member of the South Yorkshire Mayoral Combined Authority.
Milton Keynes City Council is the local authority for the City of Milton Keynes, a unitary authority in Buckinghamshire, England. Until 1 April 1997 it was a non-metropolitan district.
The 2012 City of Bradford Metropolitan District Council election took place on 3 May 2012. The elections took place shortly after the Bradford West by-election, in which the Respect Party's George Galloway pulled off a shock victory against the incumbent Labour Party. Held alongside was a referendum on directly elected mayors. The Labour Party were one seat short of an overall majority following the election, leaving the council in no overall control.
The 2016 Bristol City Council election took place on Thursday 5 May 2016, alongside nationwide local elections. Following a boundary review, the number of wards in the city was reduced to 34, with each electing one, two or three Councillors. The overall number of Councillors remained 70, with all seats up for election at the same time. Elections would then be held every 4 years.
The 1999 Bristol City Council election took place on 6 May 1999, on the same day as other local elections. All seats were up for election due to boundary changes, with each ward electing 2 councillors. The total number of seats on the council increased by 2 due to the creation of a new ward: Clifton East.
South Bucks District Council was elected every four years from 1973 until 2020.
The 1973 Norwich City Council election took place on 7 June 1973 to elect members of Norwich City Council in England. This was on the same day as other local elections. Voting took place across 16 wards, each electing 3 Councillors. Following the Local Government Act 1972, this was the first election to the new non-metropolitan district council for Norfolk, which came into being on 1 April the following year. Labour took control of the Council after winning a comfortable majority of seats.
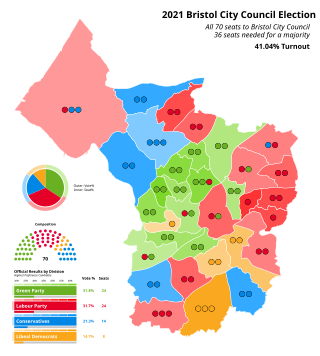
The 2021 Bristol City Council election took place on 6 May 2021 to elect members of Bristol City Council in England. It coincided with nationwide local elections. Voters in the city also voted for the mayor of Bristol, the mayor of the West of England and for Avon and Somerset's police and crime commissioner. The election was originally due to take place in May 2020, but was postponed due to the COVID-19 pandemic.
The 1973 Cardiff City Council election was held on Thursday 10 May 1973 to elect councillors to the new Cardiff District Council in Cardiff, Wales. It took place on the same day as other district council elections in the United Kingdom.
The 1973 Plymouth City Council election took place on 7 June 1973 to elect members of Plymouth City Council in England. This was on the same day as other local elections. Voting took place across 22 wards, each electing 3 Councillors. Following the Local Government Act 1972, this was the first election to the new non-metropolitan district council for Plymouth, which came into being on 1 April the following year. The Conservative Party took control of the Council after winning a majority of seats.
The 1973 Derby Borough Council election took place on 7 June 1973 to elect members of Derby Borough Council in England. This was on the same day as other local elections. Voting took place across 18 wards, each electing 3 Councillors. Following the Local Government Act 1972, this was the first election to the new non-metropolitan district council for Derby, which came into being on 1 April the following year. The Labour Party took control of the Council after winning a majority of seats.
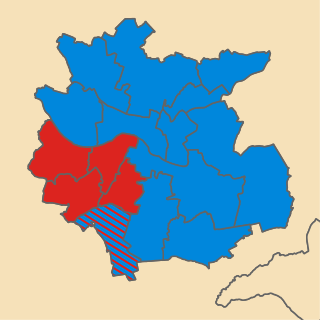
The 1976 Bath City Council election was held on Thursday 6 May 1976 to elect councillors to Bath City Council in England. It took place on the same day as other district council elections in the United Kingdom. The entire council was up for election. Following boundary changes the number of wards was increased by one, and the number of seats increased from 45 to 48. This was the second election to the district council, the election saw terms of councillors extended from three to four years. Subsequent elections for the council would be elected by thirds following the passing a resolution under section 7 (4) (b) of the Local Government Act 1972.
Hotwells and Harbourside is one of the thirty-four council wards in the city of Bristol in the Southwest of England, United Kingdom.
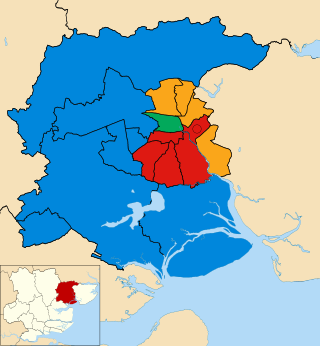
The 2024 Colchester City Council election took place on 2 May 2024 alongside other local elections across England. Eighteen members of the council were elected, one from each of the wards, with an additonal by-election in Greenstead ward.