| |||||||||||||||||
All 68 seats to Bristol City Council 35 seats needed for a majority | |||||||||||||||||
---|---|---|---|---|---|---|---|---|---|---|---|---|---|---|---|---|---|
| |||||||||||||||||
1995 local election results in Bristol | |||||||||||||||||
|
The 1995 Bristol City Council election took place on 4 May 1995 with all seats being up for election, in preparation for Bristol City Council becoming a Unitary Authority following the abolition of Avon County Council. [1] The same ward boundaries were used, however these are elections to a new authority and cannot be considered gains or losses compared to previously held seats.
The election saw national issues, such as the unpopularity of the national Conservative government and the state of the economy, being the major issues in the election. The Conservative candidates branded themselves as 'Bristol Conservatives', which was seen as an attempt to distance themselves from the national government. [1] The Labour Party was expected to win a large majority but they were criticised by the Conservatives for cutting money from the Scouts while giving money to a lesbian/bisexual women's group. [2]
Labour easily gained a majority and as predicted before the election the Liberal Democrats became the second largest party on the council driving the Conservatives down to third as compared to the previous district council. [1]
The vote and seat share for all parties that contested the election:
Party | Cllrs | % Vote | ±% | |
---|---|---|---|---|
Labour Party | 53 | 53.3 | N/A | |
Liberal Democrats | 9 | 19.6 | N/A | |
Conservative Party | 6 | 24.8 | N/A | |
Green Party | 0 | 2.3 | N/A | |
Total | 68 | 100.00 | ||
These election results are to the new Unitary Authority of Bristol City Council, therefore they cannot be considered gains or losses compared to previously held seats. Sebastian Matthews, who apparently stood as the "Macromedia Student" party, is possibly a nomination-paper error where 'Occupation' and 'Party' were swapped, c.f. Systems Designer.
Party | Candidate | Votes | % | ±% | |
---|---|---|---|---|---|
Labour | Nichola I. Barton | 1,763 | 70.41 | ||
Labour | Raymond J. Sefia | 1,472 | 58.79 | ||
Green | David M. Simpson | 426 | 17.01 | ||
Liberal Democrats | John H. Bonham-Carter | 393 | 15.69 | ||
Liberal Democrats | Jane McGarry | 368 | 14.70 | ||
Conservative | Kerrie Carpenter | 223 | 8.91 | ||
Conservative | Ian J. Henderson | 214 | 8.55 | ||
Majority | 1,046 | 41.77 | |||
Turnout | 2,504 | 31.83 | N/A | ||
Registered electors | 7,867 | N/A |
Party | Candidate | Votes | % | ±% | |
---|---|---|---|---|---|
Labour | Celia M. Lukins | 2,200 | 70.42 | ||
Labour | Ernie Bristow | 2,149 | 68.79 | ||
Conservative | David L. Holme | 578 | 18.50 | ||
Liberal Democrats | Paul W. Lloyd | 419 | 13.41 | ||
Liberal Democrats | Pamela Henderson | 371 | 11.88 | ||
Majority | 1,571 | 50.29 | |||
Turnout | 3,124 | 41.83 | N/A | ||
Registered electors | 7,468 | N/A |
Party | Candidate | Votes | % | ±% | |
---|---|---|---|---|---|
Labour | Peter J. Crispin | 2,001 | 67.92 | ||
Labour | Claire M. Warren | 1,683 | 57.13 | ||
Conservative | Jack Lopresti | 526 | 17.85 | ||
Liberal Democrats | Mary Sykes | 513 | 17.41 | ||
Conservative | Christian V.J. Simpson | 498 | 16.90 | ||
Green | Charles N. Bolton | 281 | 9.54 | ||
Majority | 1,157 | 39.27 | |||
Turnout | 2,946 | 34.93 | N/A | ||
Registered electors | 8,433 | N/A |
Party | Candidate | Votes | % | ±% | |
---|---|---|---|---|---|
Labour | Patricia M. McLaren | 2,115 | 52.80 | ||
Labour | Arthur Keefe | 2,064 | 51.52 | ||
Liberal Democrats | David J.G. Kitson | 1,055 | 26.34 | ||
Liberal Democrats | Peter J. Maitland | 966 | 24.11 | ||
Conservative | Ian E. Kealey | 718 | 17.92 | ||
Conservative | Pearl C.L. Abraham | 695 | 17.35 | ||
Green | Justin M. Quinnell | 298 | 7.44 | ||
Majority | 1,009 | 25.19 | |||
Turnout | 4,006 | 44.98 | N/A | ||
Registered electors | 8,906 | N/A |
Party | Candidate | Votes | % | ±% | |
---|---|---|---|---|---|
Labour | Terence Cleverley | 1,674 | 57.35 | ||
Labour | Paul C. Walker | 1,468 | 50.29 | ||
Conservative | Richard S. Eddy | 1,138 | 38.99 | ||
Conservative | Michael J. Jarrett | 1,022 | 35.01 | ||
Liberal Democrats | Nicholas L. Doddrell | 218 | 7.47 | ||
Green | Barrie R. Lewis | 124 | 4.25 | ||
Majority | 330 | 11.31 | |||
Turnout | 2,919 | 40.87 | N/A | ||
Registered electors | 7,142 | N/A |
Party | Candidate | Votes | % | ±% | |
---|---|---|---|---|---|
Labour | William L. Martin | 2,357 | 64.03 | ||
Labour | Peter T.J. Begley | 2,297 | 62.40 | ||
Conservative | Anthony R. Carey | 823 | 22.36 | ||
Conservative | Colin R. Bretherton | 761 | 20.67 | ||
Liberal Democrats | Jeffery Exon | 495 | 13.45 | ||
Liberal Democrats | Linda Hopkins | 404 | 10.98 | ||
Majority | 1,474 | 40.04 | |||
Turnout | 3,681 | 39.92 | N/A | ||
Registered electors | 9,220 | N/A |
Party | Candidate | Votes | % | ±% | |
---|---|---|---|---|---|
Labour | Dan Norris | 1,905 | 49.92 | ||
Labour | Jane V. Painter | 1,859 | 48.72 | ||
Liberal Democrats | Peter H. Main | 1,217 | 31.89 | ||
Liberal Democrats | Catherine F. Johnstone | 1,188 | 31.13 | ||
Conservative | Holly Richmond | 656 | 17.19 | ||
Conservative | Ian D. Millard | 609 | 15.96 | ||
Green | Mary B. Wood | 169 | 4.43 | ||
Majority | 642 | 16.82 | |||
Turnout | 3,816 | 45.54 | N/A | ||
Registered electors | 8,379 | N/A |
Party | Candidate | Votes | % | ±% | |
---|---|---|---|---|---|
Liberal Democrats | Charles R. Boney | 1,395 | 44.50 | ||
Liberal Democrats | Stephen R. Williams | 1,264 | 40.32 | ||
Labour | Paul A. Garland | 1,182 | 37.70 | ||
Labour | William J. Waines | 997 | 31.80 | ||
Conservative | Ashley P. Fox | 518 | 16.52 | ||
Conservative | David J. Smith | 499 | 15.92 | ||
Green | Rowan V. Beton | 277 | 8.84 | ||
Majority | 82 | 2.62 | |||
Turnout | 3,135 | 34.80 | N/A | ||
Registered electors | 9,008 | N/A |
Party | Candidate | Votes | % | ±% | |
---|---|---|---|---|---|
Liberal Democrats | Barbara Janke | 1,574 | 41.77 | ||
Liberal Democrats | Brian H. Price | 1,554 | 41.24 | ||
Conservative | John Bretten | 1,241 | 32.94 | ||
Conservative | Alan D. Tasker | 1,192 | 31.63 | ||
Labour | Nicole A.M. Steven | 808 | 21.44 | ||
Labour | Denton W. Brockway | 807 | 21.42 | ||
Green | Lucinda Hersey | 259 | 6.87 | ||
Majority | 313 | 8.31 | |||
Turnout | 3,768 | 39.58 | N/A | ||
Registered electors | 9,519 | N/A |
Party | Candidate | Votes | % | ±% | |
---|---|---|---|---|---|
Labour | Shelley M. Lanchbury | 1,609 | 47.20 | ||
Labour | Fabian G. Breckels | 1,584 | 46.47 | ||
Conservative | Philip A. Cobbold | 899 | 26.37 | ||
Conservative | Anthony M.B. Orr | 884 | 25.93 | ||
Liberal Democrats | Michael C. Bosel | 727 | 21.33 | ||
Liberal Democrats | Gizella K. Hughes | 717 | 21.03 | ||
Green | Geoff Collard | 258 | 7.57 | ||
Majority | 685 | 20.09 | |||
Turnout | 3,409 | 38.37 | N/A | ||
Registered electors | 8,884 | N/A |
Party | Candidate | Votes | % | ±% | |
---|---|---|---|---|---|
Liberal Democrats | John F. Kiely | 1,840 | 52.54 | ||
Liberal Democrats | Michael B. Smith | 1,710 | 48.83 | ||
Labour | Michael Langley | 1,399 | 39.95 | ||
Labour | David White | 1,298 | 37.06 | ||
Green | Robert Nicholls | 165 | 4.71 | ||
Conservative | Paul N. Hancock | 146 | 4.17 | ||
Majority | 311 | 8.88 | |||
Turnout | 3,502 | 46.27 | N/A | ||
Registered electors | 7,569 | N/A |
Party | Candidate | Votes | % | ±% | |
---|---|---|---|---|---|
Labour | Sally J. Andrews | 1,785 | 57.28 | ||
Labour | David Sutton | 1,608 | 51.60 | ||
Conservative | Lesley A. Alexander | 850 | 27.28 | ||
Conservative | Timothy C. Collins | 799 | 25.64 | ||
Liberal Democrats | Paul R. Potts | 542 | 17.39 | ||
Liberal Democrats | Roland I. Potts | 447 | 14.35 | ||
Majority | 758 | 24.33 | |||
Turnout | 3,116 | 37.10 | N/A | ||
Registered electors | 8,398 | N/A |
Party | Candidate | Votes | % | ±% | |
---|---|---|---|---|---|
Labour | Stephen James Grant | 1,385 | 75.03 | ||
Labour | George Micklewright | 1,300 | 70.42 | ||
Militant Labour | Ian P. Marshall | 312 | 16.90 | ||
Militant Labour | Wayne Coombes | 251 | 13.60 | ||
Conservative | Jonathan R. Hucker | 159 | 8.61 | ||
Green | Graham H. Davey | 128 | 6.93 | ||
Majority | 988 | 53.52 | |||
Turnout | 1,846 | 27.44 | N/A | ||
Registered electors | 6,728 | N/A |
Party | Candidate | Votes | % | |
---|---|---|---|---|
Labour | Adrian Becker | 2,264 | ||
Labour | Anne M. Walder | 1,952 | ||
Conservative | Kenneth I. Blanchard | 1,390 | ||
Conservative | Victor C. Eaglestone | 1,085 | ||
Liberal Democrats | Stella J. Hender | 425 | ||
Liberal Democrats | Jean C. Norman | 376 | ||
Green | Simon D. Kellett | 184 | ||
Majority | 562 | 13.2 | ||
Turnout | 44.1 |
Party | Candidate | Votes | % | |
---|---|---|---|---|
Labour | Bernard W. Chalmers | 1,950 | ||
Labour | Mervyn R. Hulin | 1,754 | ||
Conservative | Barrie R. Edwards | 447 | ||
Conservative | Jonathan D.R. Price | 353 | ||
Green | Susan P. Ball | 194 | ||
Majority | 1,307 | 50.4 | ||
Turnout | 31.2 |
Party | Candidate | Votes | % | |
---|---|---|---|---|
Labour | Jack D. Fisk | 2,353 | ||
Labour | Richard J. Pyle | 2,197 | ||
Conservative | Donald C. Miller | 942 | ||
Conservative | Janet G. Reed | 817 | ||
Liberal Democrats | Anne W. Stephen | 424 | ||
Liberal Democrats | John W.A. Toye | 311 | ||
Majority | 1,255 | 33.7 | ||
Turnout | 47.4 |
Party | Candidate | Votes | % | |
---|---|---|---|---|
Liberal Democrats | Judith M. Webb | 2,079 | ||
Liberal Democrats | Sandra S. Loader | 1,937 | ||
Labour | Michael J. Chivers | 1,167 | ||
Labour | Mohammad K. Ahmed | 1,093 | ||
Conservative | Brian W. Edwards | 798 | ||
Conservative | Steven M. Willis | 760 | ||
Majority | 770 | 19.0 | ||
Turnout | 40.0 |
Party | Candidate | Votes | % | |
---|---|---|---|---|
Liberal Democrats | Rosalie M. Brown | 2,198 | ||
Conservative | Joyce M. Fey | 2,051 | ||
Conservative | John L. Portch | 1,982 | ||
Liberal Democrats | John E. Mortell | 1,843 | ||
Labour | Keith Evans | 753 | ||
Labour | Roger J. Livingston | 657 | ||
Majority | 69 | 1.4 | ||
Turnout | 55.7 |
Party | Candidate | Votes | % | |
---|---|---|---|---|
Labour | Graham R. Robertson | 2,043 | ||
Labour | J. Douglas Naysmith | 2,009 | ||
Conservative | Barbara J. Moore | 596 | ||
Conservative | Alfred D. Seville | 588 | ||
Majority | 1,413 | 53.5 | ||
Turnout | 34.6 |
Party | Candidate | Votes | % | |
---|---|---|---|---|
Labour | Arthur Massey | 1,760 | ||
Labour | David R. Poole | 1,751 | ||
Conservative | Betty J.D. Topham | 1,441 | ||
Conservative | Anthony J. Smith | 1,279 | ||
Liberal Democrats | Margaret S. Hodgkins | 355 | ||
Liberal Democrats | Sylvia E. Young | 351 | ||
Green | Peter M. Scott | 105 | ||
Majority | 310 | 8.5 | ||
Turnout | 46.1 |
Party | Candidate | Votes | % | |
---|---|---|---|---|
Labour | Rosemary A. Clarke | 1,944 | ||
Labour | John T. Bees | 1,934 | ||
Conservative | Jeanne Veale | 655 | ||
Conservative | Richard L. Clifton | 618 | ||
Liberal Democrats | Andrew Ludlow | 361 | ||
Liberal Democrats | Francis R. Young | 344 | ||
Majority | 1,279 | 43.2 | ||
Turnout | 41.1 |
Party | Candidate | Votes | % | |
---|---|---|---|---|
Labour | Tessa Coombes | 1,774 | ||
Labour | Patricia Roberts | 1,672 | ||
Conservative | John E. Gammon | 576 | ||
Liberal Democrats | Evelyn M. Elworthy | 486 | ||
Green | John M. Hills | 205 | ||
Majority | 1,096 | 36.0 | ||
Turnout | 35.8 |
Party | Candidate | Votes | % | |
---|---|---|---|---|
Labour | Robert J. Channon | 1,759 | ||
Labour | Lesley Broomhead | 1,718 | ||
Liberal Democrats | Michael Baker | 400 | ||
Liberal Democrats | Paul Elvin | 308 | ||
Conservative | George E. Burton | 264 | ||
Majority | 1,318 | 54.4 | ||
Turnout | 29.2 |
Party | Candidate | Votes | % | |
---|---|---|---|---|
Labour | Judy Patterson | 1,880 | ||
Labour | Philip W. Gregory | 1,824 | ||
Liberal Democrats | Joan Grace | 636 | ||
Liberal Democrats | Ian H. Parry | 566 | ||
Conservative | Christopher R. Stallabrass | 347 | ||
Conservative | Geoffrey R. Gollop | 336 | ||
Majority | 1,188 | 41.5 | ||
Turnout | 39.6 |
Party | Candidate | Votes | % | |
---|---|---|---|---|
Labour | John Ashton | 2,060 | ||
Labour | Joan B. McLaren | 1,989 | ||
Conservative | Mark F.H. Casewell | 1,102 | ||
Conservative | Antony S. Waycott | 1,086 | ||
Liberal Democrats | Robert J. Wills | 926 | ||
Liberal Democrats | Michael J. Woods | 841 | ||
Macromedia Student | Sebastian A.H. Matthews | 127 | ||
Majority | 887 | 21.0 | ||
Turnout | 45.3 |
Party | Candidate | Votes | % | |
---|---|---|---|---|
Labour | Peter W. Hammond | 1,745 | ||
Labour | Jennifer M. Smith | 1,699 | ||
Conservative | Martin Kerry | 599 | ||
Conservative | Jarmila Parry | 567 | ||
Liberal Democrats | Carol F. Taylor | 348 | ||
Liberal Democrats | Simon R. Young | 251 | ||
Majority | 1,100 | 40.9 | ||
Turnout | 34.8 |
Party | Candidate | Votes | % | |
---|---|---|---|---|
Labour | Andrew J. May | 2,123 | ||
Labour | David Johnson | 2,104 | ||
Conservative | Cora A.P. Stephenson | 503 | ||
Conservative | Neil A. Cuthbertson | 478 | ||
Liberal Democrats | Richard F. Hughes | 411 | ||
Green | Sigrid Shayer | 357 | ||
Majority | 1,601 | 47.2 | ||
Turnout | 38.1 |
Party | Candidate | Votes | % | |
---|---|---|---|---|
Labour | Charles S. Price | 1,802 | ||
Labour | Margaret A. Shovelton | 1,778 | ||
Conservative | Edward J. Withers | 632 | ||
Conservative | Derek A.E. Fey | 629 | ||
Liberal Democrats | Gordon H. Draper | 508 | ||
Liberal Democrats | Tony R. Potts | 414 | ||
Majority | 1,146 | 39.0 | ||
Turnout | 35.4 |
Party | Candidate | Votes | % | |
---|---|---|---|---|
Labour | John E. Deasy | 2,062 | ||
Labour | Ronald E. Stone | 1,983 | ||
Liberal Democrats | Gordon Williams | 436 | ||
Liberal Democrats | Kenneth M. Peacock | 432 | ||
Conservative | Derek V. Hooper | 345 | ||
Conservative | Marilyn Hutton | 308 | ||
Majority | 1,547 | 54.4 | ||
Turnout | 36.9 |
Party | Candidate | Votes | % | |
---|---|---|---|---|
Labour | Robin Moss | 2,002 | ||
Conservative | Colin J.N. Williams | 1,985 | ||
Labour | David Spry | 1,968 | ||
Conservative | David H.R. Morris | 1,820 | ||
Liberal Democrats | Jane M. Collins | 709 | ||
Liberal Democrats | Rosemary A. Windmill | 383 | ||
Majority | 17 | 0.4 | ||
Turnout | 46.3 |
Party | Candidate | Votes | % | |
---|---|---|---|---|
Conservative | Peter J. Abraham | 2,051 | ||
Conservative | Christopher M.B. Alderson | 1,992 | ||
Liberal Democrats | Keri A. Dow | 1,034 | ||
Liberal Democrats | Dennis H. Brown | 961 | ||
Labour | Luke Akehurst | 769 | ||
Labour | Edward F. Fowler | 719 | ||
Green | William F. McCaskie | 160 | ||
Majority | 958 | 23.9 | ||
Turnout | 39.6 |
Party | Candidate | Votes | % | |
---|---|---|---|---|
Conservative | David H. Poole | 2,614 | ||
Conservative | Robert W. Wall | 2,544 | ||
Labour | Dick Drew | 1,102 | ||
Liberal Democrats | Carol K. Stratton | 1,050 | ||
Liberal Democrats | Antony A. Stratton | 976 | ||
Majority | 1,442 | 30.3 | ||
Turnout | 53.0 |
Party | Candidate | Votes | % | |
---|---|---|---|---|
Labour | Helen Holland | 2,025 | ||
Labour | Paul Smith | 2,008 | ||
Conservative | Robert R. Morris | 392 | ||
Green | Christine J. Presley | 187 | ||
Majority | 1,616 | 62.1 | ||
Turnout | 31.7 |
Party | Candidate | Votes | % | |
---|---|---|---|---|
Labour | Diane E. Bunyan | 2,368 | ||
Labour | Christopher L. Orlik | 2,035 | ||
Green | Anita J. Lewis | 543 | ||
Conservative | William R.J. Biggs | 516 | ||
Conservative | Lilian F. Biggs | 506 | ||
Majority | 1,492 | 43.5 | ||
Turnout | 32.3 |
Mid Bedfordshire was, from 1974 to 2009, a local government district in Bedfordshire, England.
The Isle of Wight Council is a unitary authority covering the Isle of Wight, an island in the south of England. It is currently made up of 39 seats. Since the 2021 election, there has been an 'Alliance' coalition administration of Independents, the Green Party, Island Independent Network, and Our Island councillors, who together with the Liberal Democrat and Vectis Party councillors voted to elect Independent Lora Peacey-Wilcox as leader of the council, with the Labour councillor being absent. The Conservative group is the principal opposition party, and the single councillors from Labour, the Liberal Democrats and the Vectis Party also sit outside the Alliance group.
Local government elections took place in England (only) on Thursday 4 May 2006. Polling stations were open between 7:00 and 22:00.
The city of Bristol, England, is a unitary authority, represented by four MPs representing seats wholly within the city boundaries. As well as these, Filton and Bradley Stoke covers the northern urban fringe in South Gloucestershire and the north eastern urban fringe is in the Kingswood constituency. The overall trend of both local and national representation became left of centre during the latter 20th century, but there was a shift to the right in the 2010 general election. The city has a tradition of local activism, with environmental issues and sustainable transport being prominent issues in the city.
The 2007 UK local government elections were held on 3 May 2007. These elections took place in most of England and all of Scotland. There were no local government elections in Wales though the Welsh Assembly had a general election on the same day. There were no local government elections in Northern Ireland. Just over half of English councils and almost all the Scottish councils began the counts on Friday, rather than Thursday night, because of more complex arrangements regarding postal votes.
The United Kingdom local elections took place on 1 May 1997. Elections took place for all of the English country councils, some English unitary authorities and all of the Northern Ireland districts. The elections were held on the same day as the general election.
The 1999 Lichfield District Council election took place on 6 May 1999 to elect members of Lichfield District Council in Staffordshire, England. The whole council was up for election and the Conservative party gained overall control of the council from the Labour party.
The 2011 United Kingdom local elections were held on Thursday 5 May 2011. In England, direct elections were held in all 36 Metropolitan boroughs, 194 Second-tier district authorities, 49 unitary authorities and various mayoral posts, meaning local elections took place in all parts of England with the exception of seven unitary authorities, and seven districts and boroughs. For the majority of English districts and the 25 unitary authorities that are elected "all out" these were the first elections since 2007. In Northern Ireland, there were elections to all 26 local councils. Elections also took place to most English parish councils.
Regional elections were held in Scotland on 5 May 1994, as part of the Local Government (Scotland) Act 1973. These were the last elections before 29 new mainland unitary authorities, established by the Local Government etc. (Scotland) Act 1994, came into effect. The councils up for election were last contested in 1990 Scottish regional elections, and vote and seat changes are compared to the 1990 results.
The 2006 Solihull Metropolitan Borough Council election took place on 4 May 2006 to elect members of Solihull Metropolitan Borough Council in the West Midlands, England. One third of the council was up for election and the Conservative Party stayed in overall control of the council.
The 2008 Sunderland Council election took place on 1 May 2008 to elect members of Sunderland Metropolitan Borough Council in Tyne and Wear, England. One third of the council was up for election and the Labour Party stayed in overall control of the council.
Elections to East Lothian Council were held on 3 May 2012, on the same day as the other Scottish local government elections. The election used the 7 wards created as a result of the Local Governance (Scotland) Act 2004, with each ward electing three or four councillors using the single transferable vote system form of proportional representation, with 23 councillors elected.
The 2013 United Kingdom local elections took place on Thursday 2 May 2013. Elections were held in 35 English councils: all 27 non-metropolitan county councils and eight unitary authorities, and in one Welsh unitary authority. Direct mayoral elections took place in Doncaster and North Tyneside. These elections last took place on the 4 June 2009 at the same time as the 2009 European Parliament Elections, except for County Durham, Northumberland and the Anglesey where elections last took place in 2008.
An election to Hampshire County Council took place on 2 May 2013 as part of the 2013 United Kingdom local elections. 78 councillors were elected from 75 electoral divisions, which returned either one or two county councillors each by first-past-the-post voting for a four-year term of office. The electoral divisions were the same as those of the previous election in 2009. No elections were held in Portsmouth and Southampton, which are unitary authorities outside the area covered by the County Council. The election saw the Conservative Party retain overall control of the council, with a reduced majority of five councillors.
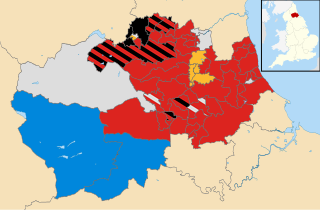
An election to Durham County Council took place on 2 May 2013 as part of the 2013 United Kingdom local elections. Following a boundary review, 126 councillors were elected from 63 electoral divisions which returned either one, two or three councillors each by first-past-the-post voting for a four-year term of office. The previous election took place in 2008 in advance of the council becoming a unitary authority after the 2009 changes to local government. The election saw the Labour Party increase their majority on the council.
Council elections in England were held on Thursday 3 May 2018. Elections were held in all 32 London boroughs, 34 metropolitan boroughs, 67 district and borough councils and 17 unitary authorities. There were also direct elections for the mayoralties of Hackney, Lewisham, Newham, Tower Hamlets and Watford.
Local elections in parts of the United Kingdom were held on Thursday 2 May 2019, with 248 English local councils, six directly elected mayors in England, and all 11 local councils in Northern Ireland being contested.
The 2019 North Somerset Council election took place on 2 May 2019 to elect members of North Somerset Council in England.
The 1991 Cardiff City Council election was held on Thursday 2 May 1991 to the district council of Cardiff in South Glamorgan, Wales. It took place on the same day as other district council elections in Wales and England. The Labour Party regained a majority on Cardiff City Council, after sharing government for the previous four years.
Local elections in the United Kingdom took place on 5 May 2022. These included elections for all London borough councils, and for all local authorities in Wales and Scotland. Most seats in England were last up for election in 2018 and in Scotland and Wales in 2017. The elections coincided with the 2022 Northern Ireland Assembly election. In 91 cases, most of them in Wales, council seats were uncontested, each having only one candidate. Three seats in Scotland remained unfilled as no one stepped forward to fill them.