1995 Norwich City Council election

Last updated

The 1995 Norwich City Council election took place on 4 May 1995 to elect members of Norwich City Council in England. This was on the same day as other local elections. 16 of 48 seats (one-third) were up for election.

Contents

Results summary

1995 Norwich City Council election [1]
PartyThis electionFull councilThis election
SeatsNetSeats %OtherTotalTotal %VotesVotes %+/−
  Labour 13Increase2.svg 181.3243777.121,56157.2+1.8
  Liberal Democrats 3Steady2.svg18.871020.810,00226.5-3.7
  Conservative 0Decrease2.svg 10.0112.15,42414.4+1.1
  Green 0Steady2.svg0.0000.05211.4+0.3
  Independent 0Steady2.svg0.0000.01310.3N/A
  Natural Law 0Steady2.svg0.0000.0470.1New

Ward results

Bowthorpe

Bowthorpe
PartyCandidateVotes%±%
Labour R. Borrett 1,740 70.3 +0.1
Liberal Democrats N. Lubbock34013.7-1.4
Conservative H. Collins30712.4+1.0
Green S. Pollard873.5+0.2
Majority1,40056.6+1.5
Turnout 2,47430.3-5.0
Labour hold Swing Increase2.svg0.8

Catton Grove

Catton Grove
PartyCandidateVotes%±%
Labour D. Hook 1,101 64.0 -4.8
Conservative M. Wilkinson31618.4+4.5
Liberal Democrats A. Moore26215.2-2.2
Green B. Brodskis422.4N/A
Majority78545.6-5.8
Turnout 1,72130.7-2.5
Labour hold Swing Decrease2.svg4.7

Coslany

Coslany
PartyCandidateVotes%±%
Labour H. Watson 1,518 64.8 -1.4
Conservative E. Horth36315.5-0.3
Liberal Democrats I. Williams36215.5+1.1
Green A. Holmes823.5-0.1
Natural Law J. Crampton170.7N/A
Majority1,15549.3-1.0
Turnout 2,34239.0-0.4
Labour hold Swing Decrease2.svg0.6

Crome

Crome
PartyCandidateVotes%±%
Labour B. Simpson 1,452 65.5 -3.1
Liberal Democrats M. Martins40418.2±0.0
Conservative E. Collishaw36016.2+3.0
Majority1,04847.3-3.1
Turnout 2,21640.1-1.2
Labour hold Swing Decrease2.svg1.6

Eaton

Eaton
PartyCandidateVotes%±%
Liberal Democrats J. Lubbock 1,514 41.0 +0.9
Conservative J. Virgo1,21833.0-0.3
Labour P. Cross96226.0-0.6
Majority2968.0+1.2
Turnout 3,69456.9+2.2
Liberal Democrats gain from Conservative Swing Increase2.svg0.6

Heigham

Heigham
PartyCandidateVotes%±%
Labour C. Semmens 1,500 68.5 +18.1
Liberal Democrats N. Park49022.4-22.8
Conservative V. Rayna2019.2+4.8
Majority1,01046.1+40.9
Turnout 2,19139.1-10.5
Labour hold Swing Increase2.svg20.5

Henderson

Henderson
PartyCandidateVotes%±%
Labour H. Panting 1,359 72.8 +1.4
Liberal Democrats D. Munday22912.3-8.4
Conservative S. Collier1578.4+0.5
Green J. Button1226.5N/A
Majority1,13060.5+9.8
Turnout 1,86732.4-2.5
Labour hold Swing Increase2.svg4.9

Lakenham

Lakenham
PartyCandidateVotes%±%
Labour A. Brown 1,423 67.9 +0.3
Liberal Democrats B. Banks34116.3-1.5
Conservative E. Cooper33315.9+1.2
Majority1,08251.6
Turnout 2,09737.5+1.1
Labour hold Swing Increase2.svg0.9

Mancroft

Mancroft
PartyCandidateVotes%±%
Labour E. Burgess 1,461 64.8 +2.7
Conservative J. Knight46420.6+2.1
Liberal Democrats C. Risebrook32914.6-0.8
Majority99744.2+0.6
Turnout 2,25435.6-1.9
Labour hold Swing Increase2.svg0.3

Mile Cross

Mile Cross
PartyCandidateVotes%±%
Labour J. Bunker 1,301 78.3 +0.9
Liberal Democrats D. Hicketts21512.9-0.6
Conservative M. Windscheffel1458.7-0.3
Majority1,08665.4+1.5
Turnout 1,66130.6-1.7
Labour hold Swing Increase2.svg0.7

Mousehold

Mousehold
PartyCandidateVotes%±%
Labour T. Gordon 1,385 69.3 +16.8
Conservative I. Evans26713.4+5.2
Liberal Democrats E. Maxfield25913.0-22.9
Green L. Moore884.4+1.0
Majority1,11855.9+39.2
Turnout 1,99932.5-6.0
Labour hold Swing Increase2.svg5.8

Nelson

Nelson
PartyCandidateVotes%±%
Labour S. Morphew 1,374 49.1 +5.5
Liberal Democrats A. High1,14841.0-8.4
Conservative G. Drake1625.8-0.1
Green S. Pennington1003.6N/A
Natural Law B. Parsons130.5N/A
Majority2268.1
Turnout 2,79753.6-2.0
Labour gain from Liberal Democrats Swing Increase2.svg7.0

St. Stephen

St. Stephen
PartyCandidateVotes%±%
Labour R. Round 1,484 63.0 +0.1
Conservative M. Dean47320.1-0.5
Liberal Democrats M. Verran26711.3-5.2
Independent J. Phillips1315.6N/A
Majority1,01142.9+0.6
Turnout 2,35543.6-2.1
Labour hold Swing Increase2.svg0.3

Thorpe Hamlet

Thorpe Hamlet
PartyCandidateVotes%±%
Liberal Democrats D. Wood 1,139 51.7 -1.2
Labour J. Lay84238.2+5.5
Conservative S. Butler22210.1-6.4
Majority29713.5-6.7
Turnout 2,20337.7-3.3
Liberal Democrats hold Swing Decrease2.svg3.4

Town Close

Town Close
PartyCandidateVotes%±%
Liberal Democrats D. Wood 1,458 47.5 -2.4
Labour M. Taskis1,33543.5+2.5
Conservative J. Wyatt2407.8-1.4
Natural Law D. Milis341.1N/A
Majority1234.0-4.9
Turnout 3,06755.3-1.4
Liberal Democrats hold Swing Decrease2.svg2.5

University

University
PartyCandidateVotes%±%
Labour A. Cains 1,324 47.9 +2.3
Liberal Democrats D. Hume1,24545.0±0.0
Conservative C. Page1967.1-2.3
Majority792.9+2.3
Turnout 2,76550.1-3.5
Labour hold Swing Increase2.svg1.2

Related Research Articles

<span class="mw-page-title-main">Norwich City Council elections</span> Elections for Norwich City councillors

One third of the Norwich City Council in Norfolk, England is elected each year. Since the last boundary changes in 2019, 39 councillors have been elected from 13 wards.

<span class="mw-page-title-main">Adrian Ramsay</span> Co-Leader of the Green Party of England and Wales

Adrian Philip Ramsay is a British politician and co-leader of the Green Party of England and Wales alongside Carla Denyer since 1 October 2021. He was previously the deputy leader of the Green Party of England and Wales from 2008 to 2012. He served as a Norwich City Councillor from 2003 to 2011.

<span class="mw-page-title-main">2010 United Kingdom local elections</span>

The 2010 United Kingdom local elections were held on Thursday 6 May 2010, concurrently with the 2010 general election. Direct elections were held to all 32 London boroughs, all 36 metropolitan boroughs, 76 second-tier district authorities, 20 unitary authorities and various Mayoral posts, all in England. For those authorities elected "all out" these were the first elections since 2006. The results provided some comfort to the Labour Party, losing the general election on the same day, as it was the first time Conservative councillor numbers declined since 1996.

<span class="mw-page-title-main">2008 Norwich City Council election</span> 2008 city council election for Norwich, England

The 2008 Norwich City Council election took place on 1 May 2008 to elect members of Norwich City Council in England. One third of seats were up for election. This was on the same day as other local elections.

<span class="mw-page-title-main">2018 Norwich City Council election</span> 2018 city council election for Norwich, England

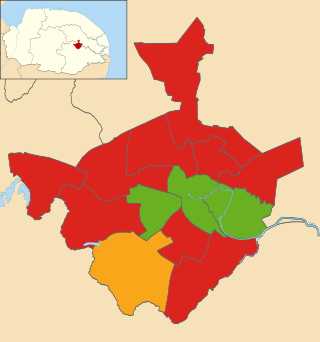
The 2018 Norwich City Council election took on 3 May 2018 to elect members of Norwich City Council in England. This was on the same day as other local elections. 13 of 39 seats (one-third) were up for election.

The 1973 Norwich City Council election took place on 7 June 1973 to elect members of Norwich City Council in England. This was on the same day as other local elections. Voting took place across 16 wards, each electing 3 Councillors. Following the Local Government Act 1972, this was the first election to the new non-metropolitan district council for Norfolk, which came into being on 1 April the following year. Labour took control of the Council after winning a comfortable majority of seats.

<span class="mw-page-title-main">2019 Norwich City Council election</span> Elections in Norwhich

Elections to Norwich City Council were held on 2 May 2019. Following boundary changes, all 39 seats were put up for election, with three councillors being elected per ward using the block vote system. The election saw the Green Party reclaim five seats from the Labour Party, while the Labour Party retained its majority on the council.

<span class="mw-page-title-main">2004 Norwich City Council election</span> 2004 city council election for Norwich, England

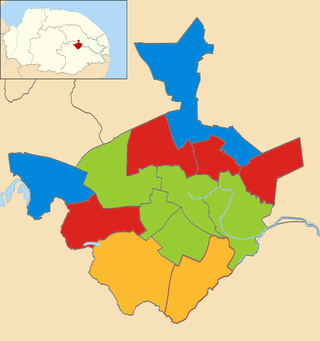
The 2004 Norwich City Council election took place on 10 June 2004 to elect members of Norwich City Council in England. This was on the same day as other local elections. This was the first election to be held under new ward boundaries, which reduced the number of seats from 48 to 39. As a result, all seats were up for election. The Liberal Democrats lost overall control of the council, which fell under no overall control.

<span class="mw-page-title-main">2006 Norwich City Council election</span> 2006 city council election for Norwich, England

The 2006 Norwich City Council election took place on 6 May 2006 to elect members of Norwich City Council in England. This was on the same day as other local elections. One third of the council seats were up for election. The council remained under no overall control, with the Labour Party overtaking the Liberal Democrats as the largest party.

<span class="mw-page-title-main">2021 Norwich City Council election</span>

The 2021 Norwich City Council election took place on 6 May 2021 to elect members of Norwich City Council in England. This was on the same day as other local elections. 13 of 39 seats (one-third) were up for election.

The 1991 Norwich City Council election took place on 2 May 1991 to elect members of Norwich City Council in England. This was on the same day as other local elections. 16 of 48 seats (one-third) were up for election, with one additional seat up due to a by-election in Catton Grove ward.

'The 1992 Norwich City Council election' took place on 7 May 1992 to elect members of Norwich City Council in England. This was on the same day as other local elections. 16 of 48 seats (one-third) were up for election, with one additional seat up due to the UK parliamentary by-elections in Henderson ward.

The 1994 Norwich City Council election took place on 5 May 1994 to elect members of Norwich City Council in England. This was on the same day as other local elections. 16 of 48 seats (one-third) were up for election, with one additional seat up due to a by-election in Lakenham ward.

The 1996 Norwich City Council election took place on 2 May 1996 to elect members of Norwich City Council in England. This was on the same day as other local elections. 16 of 48 seats (one-third) were up for election, with three additional seats up due to by-elections in Coslany, St. Stephen and Thorpe Hamlet wards.

The 1998 Norwich City Council election took place on 7 May 1998 to elect members of Norwich City Council in England. This was on the same day as other local elections. 16 of 48 seats (one-third) were up for election, with two additional seats up in Catton Grove and University wards due to by-elections.

The 1999 Norwich City Council election took place on 6 May 1999 to elect members of Norwich City Council in England. This was on the same day as other local elections. 16 of 48 seats (one-third) were up for election, with an additional seat up in Coslany ward due to a by-election.

The 2000 Norwich City Council election took place on 4 May 2000 to elect members of Norwich City Council in England. This was on the same day as other local elections. 16 of 48 seats (one-third) were up for election.

The 2002 Norwich City Council election took place on 2 May 2002 to elect members of Norwich City Council in England. This was on the same day as other local elections. 16 of 48 seats (one-third) were up for election, with an additional seat up in Henderson ward due to a by-election.

The 2003 Norwich City Council election took place on 1 May 2003 to elect members of Norwich City Council in England. This was on the same day as other local elections. 16 of 48 seats (one-third) were up for election, with an additional seat up in Henderson ward due to a by-election.

<span class="mw-page-title-main">2022 Norwich City Council election</span>

The 2022 Norwich City Council election took place on 5 May 2022 to elect members of Norwich City Council in England. This was on the same day as other local elections. 13 of 39 seats (one-third) were up for election.

References

  1. "Norwich City Council Election Results 1973-2012" (PDF). Colin Rallings and Michael Thrasher. Retrieved 16 July 2021.