District result maps
 2003 results map
 2007 results map
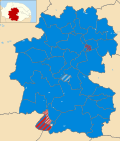 2011 results map
 2015 results map
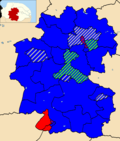 2019 results map
 2023 results map
Breckland District Council in Norfolk, England, is elected every four years.
For by-election results, please see the page on Breckland District Council By-elections.
| Year | Conservative | Labour | Liberal Democrats [a] | Green | UKIP | Independents & Others | Council control after election | |
|---|---|---|---|---|---|---|---|---|
| Local government reorganisation; council established (51 seats) | ||||||||
| 1973 | 20 | 10 | 0 | – | – | 21 | No overall control | |
| 1976 | 23 | 9 | 0 | 0 | – | 19 | No overall control | |
| New ward boundaries (53 seats) | ||||||||
| 1979 | 31 | 6 | 0 | 0 | – | 16 | Conservative | |
| 1983 | 32 | 8 | 1 | 0 | – | 12 | Conservative | |
| 1987 | 33 | 7 | 2 | 0 | – | 11 | Conservative | |
| 1991 | 32 | 8 | 1 | 0 | – | 12 | Conservative | |
| 1995 | 19 | 25 | 1 | 1 | 0 | 7 | No overall control | |
| 1999 | 34 | 14 | 2 | 0 | 0 | 3 | Conservative | |
| New ward boundaries (54 seats) | ||||||||
| 2003 | 42 | 8 | 0 | 0 | 0 | 4 | Conservative | |
| 2007 | 48 | 3 | 0 | 0 | 0 | 3 | Conservative | |
| 2011 | 47 | 4 | 0 | 0 | 0 | 3 | Conservative | |
| New ward boundaries (49 seats) | ||||||||
| 2015 | 42 | 2 | 0 | 0 | 4 | 1 | Conservative | |
| 2019 | 37 | 6 | 0 | 2 | 0 | 4 | Conservative | |
| 2023 | 30 | 12 | 1 | 1 | 0 | 5 | Conservative | |


| Party | Candidate | Votes | % | ±% | |
|---|---|---|---|---|---|
| Labour | 235 | 40.1 | |||
| Conservative | 211 | 36.0 | |||
| Liberal Democrats | 140 | 23.9 | |||
| Majority | 24 | 4.1 | |||
| Turnout | 586 | 41.0 | |||
| Labour hold | Swing | ||||
| Party | Candidate | Votes | % | ±% | |
|---|---|---|---|---|---|
| Labour | 335 | 57.7 | +6.4 | ||
| Conservative | 214 | 36.8 | +36.8 | ||
| Liberal Democrats | 32 | 5.5 | +5.5 | ||
| Majority | 121 | 20.9 | |||
| Turnout | 581 | 45.0 | |||
| Labour hold | Swing | ||||
| Party | Candidate | Votes | % | ±% | |
|---|---|---|---|---|---|
| Conservative | 366 | 65.4 | +21.4 | ||
| Labour | 128 | 22.8 | −33.2 | ||
| Liberal Democrats | 66 | 11.8 | +11.8 | ||
| Majority | 238 | 42.6 | |||
| Turnout | 560 | ||||
| Conservative gain from Labour | Swing | ||||
| Party | Candidate | Votes | % | ±% | |
|---|---|---|---|---|---|
| Conservative | 321 | 47.1 | |||
| Labour | 166 | 24.4 | |||
| Independent | 165 | 24.2 | |||
| Green | 29 | 4.3 | |||
| Majority | 155 | 22.7 | |||
| Turnout | 681 | 45.0 | |||
| Conservative gain from Labour | Swing | ||||
| Party | Candidate | Votes | % | ±% | |
|---|---|---|---|---|---|
| Conservative | 662 | 58.0 | +39.3 | ||
| Labour | 302 | 26.4 | −12.1 | ||
| Liberal Democrats | 178 | 15.6 | −7.2 | ||
| Majority | 360 | 31.6 | |||
| Turnout | 1,142 | 20.0 | |||
| Conservative gain from Labour | Swing | ||||
| Party | Candidate | Votes | % | ±% | |
|---|---|---|---|---|---|
| Labour | 281 | 58.3 | −12.4 | ||
| Conservative | 163 | 33.8 | +13.9 | ||
| Liberal Democrats | 38 | 7.9 | −1.5 | ||
| Majority | 118 | 24.5 | |||
| Turnout | 482 | 18.4 | |||
| Labour hold | Swing | ||||
| Party | Candidate | Votes | % | ±% | |
|---|---|---|---|---|---|
| Liberal Democrats | 278 | 51.6 | +36.6 | ||
| Conservative | 200 | 37.1 | +6.7 | ||
| Green | 61 | 11.3 | +2.4 | ||
| Majority | 78 | 14.5 | |||
| Turnout | 539 | 25.0 | |||
| Liberal Democrats gain from Labour | Swing | ||||
| Party | Candidate | Votes | % | ±% | |
|---|---|---|---|---|---|
| Conservative | Frank Sharpe | 851 | 66.3 | +11.2 | |
| Labour | Margaret Holmes | 243 | 19.0 | +19.0 | |
| Liberal Democrats | David Thomas | 189 | 14.7 | −30.2 | |
| Majority | 608 | 47.3 | |||
| Turnout | 1,283 | 24.3 | |||
| Conservative hold | Swing | ||||
| Party | Candidate | Votes | % | ±% | |
|---|---|---|---|---|---|
| Conservative | 863 | 48.8 | −10.3 | ||
| Independent | 673 | 38.1 | |||
| Labour | 231 | 13.1 | +13.1 | ||
| Majority | 190 | 10.8 | |||
| Turnout | 1,767 | 24.3 | |||
| Conservative hold | Swing | ||||
| Party | Candidate | Votes | % | ±% | |
|---|---|---|---|---|---|
| Conservative | Karen Pettitt | 489 | 51.9 | ||
| Labour | John Williams | 454 | 48.1 | ||
| Majority | 35 | 3.8 | |||
| Turnout | 943 | ||||
| Conservative hold | Swing | ||||
Note: swings cannot be given: Queen's was previously uncontested.
| Party | Candidate | Votes | % | ±% | |
|---|---|---|---|---|---|
| Conservative | Marion Chapman-Allen | 453 | 48.5 | −21.2 | |
| UKIP | Denis Crawford | 184 | 19.7 | +19.7 | |
| Labour | Stephen Green | 168 | 18.0 | −12.3 | |
| Liberal Democrats | Steve Gordon | 129 | 13.8 | +13.8 | |
| Majority | 269 | 28.8 | |||
| Turnout | 934 | ||||
| Conservative hold | Swing | ||||
| Party | Candidate | Votes | % | ±% | |
|---|---|---|---|---|---|
| Conservative | Mike Nairn | 257 | 63.0 | ||
| Labour | Alexander Vyse | 151 | 37.0 | ||
| Majority | 106 | 26.0 | |||
| Turnout | 408 | ||||
| Conservative hold | Swing | ||||
Note: swings cannot be given: Mid Forest was previously uncontested.
| Party | Candidate | Votes | % | ±% | |
|---|---|---|---|---|---|
| Conservative | Stephen Askew | 546 | 42.0 | +1.7 | |
| Labour | Philip Andrew Spiby | 393 | 30.2 | +11.6 | |
| Independent | Anthony Frederick Crouch | 360 | 27.7 | +27.7 | |
| Majority | 153 | 11.8 | |||
| Turnout | 1,299 | ||||
| Conservative hold | Swing | ||||
| Party | Candidate | Votes | % | ±% | |
|---|---|---|---|---|---|
| Conservative | Theresa Ruth Hewett | 335 | 48.1 | −2.8 | |
| Liberal Democrats | Andrew Thorpe | 105 | 15.1 | +15.1 | |
| Independent | Patricia Helena Warwick | 104 | 14.9 | +14.9 | |
| UKIP | David Williams | 80 | 11.5 | −20.1 | |
| Labour | Joseph Manuel Sisto | 72 | 10.3 | +10.3 | |
| Majority | 230 | 33.0 | |||
| Turnout | 696 | ||||
| Conservative hold | Swing | ||||
| Party | Candidate | Votes | % | ±% | |
|---|---|---|---|---|---|
| Conservative | Robert George Kybird | 666 | 74.9 | ||
| Labour | Christopher Harvey | 223 | 25.1 | ||
| Majority | 443 | 49.8 | |||
| Turnout | 889 | ||||
| Conservative hold | Swing | ||||
Note: swings cannot be given: Harling and Heathlands was previously uncontested.
| Party | Candidate | Votes | % | ±% | |
|---|---|---|---|---|---|
| Labour | Michael Patrick Brindle | 503 | 57.7 | +28.0 | |
| Conservative | Jane Lillian James | 257 | 29.5 | −3.7 | |
| UKIP | Dean Roberts | 112 | 12.8 | −24.3 | |
| Majority | 246 | 28.2 | |||
| Turnout | 872 | ||||
| Labour gain from Conservative | Swing | ||||
| Party | Candidate | Votes | % | ±% | |
|---|---|---|---|---|---|
| Conservative | Robert Hambidge | 243 | 45.0 | −26.3 | |
| Liberal Democrats | James Minto | 221 | 40.9 | +40.9 | |
| Labour | Paul Siegert | 66 | 12.2 | −16.5 | |
| Workers Party | Graeme Briggs-White | 10 | 1.9 | +1.9 | |
| Majority | 22 | 4.1 | |||
| Turnout | 540 | ||||
| Conservative hold | Swing | ||||
| Party | Candidate | Votes | % | ±% | |
|---|---|---|---|---|---|
| Conservative | Paul Plummer | 539 | 41.9 | −4.8 | |
| Independent | Maggie Oechsle | 486 | 37.8 | +37.8 | |
| Labour | Kendra Cogman | 260 | 20.2 | −5.3 | |
| Majority | 53 | 4.1 | |||
| Turnout | 1,285 | ||||
| Conservative hold | Swing | ||||
| Party | Candidate | Votes | % | ±% | |
|---|---|---|---|---|---|
| Labour | Terry Land | 398 | 51.0 | +4.8 | |
| Conservative | Mac Macdonald | 383 | 49.0 | −4.8 | |
| Majority | 15 | 2.0 | |||
| Turnout | 781 | ||||
| Labour gain from Conservative | Swing | ||||
| Party | Candidate | Votes | % | ±% | |
|---|---|---|---|---|---|
| Conservative | Robin Hunter-Clarke | 313 | 40.5 | +1.8 | |
| Liberal Democrats | Ian Minto | 292 | 37.8 | −3.3 | |
| Labour | Joe Sisto | 168 | 21.7 | +1.5 | |
| Majority | 21 | 2.7 | |||
| Turnout | 773 | ||||
| Conservative gain from Liberal Democrats | Swing | ||||
| Party | Candidate | Votes | % | ±% | |
|---|---|---|---|---|---|
| Reform UK | Scott Hussey | 414 | 54.3 | +54.3 | |
| Conservative | Paula Wood | 209 | 27.4 | −25.2 | |
| Labour | Doug Jefferson | 99 | 13.0 | −14.1 | |
| Green | Timothy Soar | 41 | 5.4 | +5.4 | |
| Majority | 205 | 26.9 | |||
| Turnout | 763 | ||||
| Reform UK gain from Conservative | Swing | ||||
| Party | Candidate | Votes | % | ±% | |
|---|---|---|---|---|---|
| Reform UK | Michael Westman | 449 | 45.3 | ||
| Labour | Doug Jefferson | 292 | 29.5 | ||
| Conservative | Jane James | 166 | 16.8 | ||
| Green | Timothy Soar | 46 | 4.6 | ||
| Liberal Democrats | Ian Minto | 38 | 3.8 | ||
| Majority | 157 | 15.8 | |||
| Turnout | 991 | ||||
| Reform UK gain from Labour | Swing | ||||
| Party | Candidate | Votes | % | ±% | |
|---|---|---|---|---|---|
| Reform UK | Grahame Middleton | 512 | 47.3 | ||
| Labour | Liz Bernard | 289 | 26.7 | ||
| Conservative | Jane James | 164 | 15.1 | ||
| Liberal Democrats | Ian Minto | 118 | 10.9 | ||
| Majority | 223 | 20.6 | |||
| Turnout | 1,083 | ||||
| Reform UK gain from Labour | Swing | ||||