County result maps
 2005 results map
 2009 results map
 2013 results map
 2017 results map
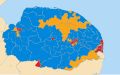
 2021 results map
Norfolk County Council in England is elected every four years. Since the last boundary changes in 2005, 84 councillors have been elected from 84 wards. [1]
| Year | Conservative | Labour | Liberal Democrats [a] | Green | UKIP | Independents & Others | Council control after election | |
|---|---|---|---|---|---|---|---|---|
| Local government reorganisation; council established (83 seats) | ||||||||
| 1973 | 51 | 27 | 0 | – | – | 5 [b] | Conservative | |
| 1977 | 70 | 13 | 0 | 0 | – | 0 | Conservative | |
| 1981 | 51 | 27 | 4 | 0 | – | 1 | Conservative | |
| New division boundaries; seats increased from 83 to 84 | ||||||||
| 1985 | 44 | 25 | 15 | 0 | – | 0 | Conservative | |
| 1989 | 47 | 28 | 9 | 0 | – | 0 | Conservative | |
| 1993 | 34 | 32 | 16 | 0 | – | 2 | No overall control | |
| 1997 | 36 | 34 | 13 | 0 | 0 | 1 | No overall control | |
| 2001 | 48 | 26 | 10 | 0 | 0 | 0 | Conservative | |
| 2005 | 46 | 22 | 14 | 2 | 0 | 0 | Conservative | |
| 2009 | 60 | 3 | 13 | 7 | 1 | 0 | Conservative | |
| 2013 | 40 | 14 | 10 | 4 | 15 | 1 | No overall control | |
| 2017 | 55 | 17 | 11 | 0 | 0 | 1 | Conservative | |
| 2021 | 58 | 12 | 8 | 3 | 0 | 3 | Conservative | |
The elections which were due to take place in 2025 were delayed by one year, as local government in Norfolk will be reorganised. [2]


| Party | Candidate | Votes | % | ±% | |
|---|---|---|---|---|---|
| Labour | 808 | 43.0 | +1.0 | ||
| Liberal Democrats | 796 | 42.4 | +2.5 | ||
| Conservative | 275 | 14.6 | −0.2 | ||
| Majority | 12 | 0.6 | |||
| Turnout | 1,879 | 33.3 | |||
| Labour hold | Swing | ||||
| Party | Candidate | Votes | % | ±% | |
|---|---|---|---|---|---|
| Labour | 803 | 53.5 | +1.2 | ||
| Liberal Democrats | 402 | 26.8 | −2.2 | ||
| Conservative | 296 | 19.7 | +2.5 | ||
| Majority | 401 | 26.7 | |||
| Turnout | 1,501 | ||||
| Labour hold | Swing | ||||
| Party | Candidate | Votes | % | ±% | |
|---|---|---|---|---|---|
| Liberal Democrats | 1,848 | 55.4 | +14.5 | ||
| Conservative | 1,358 | 40.7 | +0.7 | ||
| Labour | 130 | 3.9 | −15.2 | ||
| Majority | 490 | 14.7 | |||
| Turnout | 3,336 | 44.0 | |||
| Liberal Democrats hold | Swing | ||||
| Party | Candidate | Votes | % | ±% | |
|---|---|---|---|---|---|
| Labour | 575 | 48.4 | −8.3 | ||
| Conservative | 558 | 47.0 | +15.5 | ||
| Liberal Democrats | 55 | 4.6 | −7.2 | ||
| Majority | 17 | 1.4 | |||
| Turnout | 1,188 | 27.0 | |||
| Labour hold | Swing | ||||
| Party | Candidate | Votes | % | ±% | |
|---|---|---|---|---|---|
| Liberal Democrats | 1,736 | 49.2 | +13.0 | ||
| Conservative | 1,734 | 49.1 | +9.1 | ||
| Green | 57 | 1.6 | −0.7 | ||
| Majority | 2 | 0.1 | |||
| Turnout | 3,527 | 35.7 | |||
| Liberal Democrats gain from Conservative | Swing | ||||
| Party | Candidate | Votes | % | ±% | |
|---|---|---|---|---|---|
| Labour | 807 | 51.6 | +7.4 | ||
| Liberal Democrats | Paul Kendrick | 461 | 29.5 | −3.7 | |
| Conservative | 132 | 8.4 | −8.2 | ||
| Independent | 82 | 5.2 | +5.2 | ||
| Green | 81 | 5.2 | −0.7 | ||
| Majority | 346 | 22.1 | |||
| Turnout | 1,563 | ||||
| Labour hold | Swing | ||||
| Party | Candidate | Votes | % | ±% | |
|---|---|---|---|---|---|
| Conservative | Shelagh Hutson | 1,301 | 68.3 | +13.0 | |
| Labour | 223 | 11.7 | −20.4 | ||
| UKIP | Michael Stone | 191 | 10.1 | +10.1 | |
| Liberal Democrats | John Nicholas-Letch | 190 | 10.0 | +0.2 | |
| Majority | 1,078 | 56.6 | |||
| Turnout | 1,905 | 21.3 | |||
| Conservative hold | Swing | ||||
| Party | Candidate | Votes | % | ±% | |
|---|---|---|---|---|---|
| Green | Christopher Hull | 1,151 | 36.1 | +30.9 | |
| Liberal Democrats | Moira Toye | 958 | 30.1 | −11.7 | |
| Labour | David Fullman | 606 | 19.0 | −14.7 | |
| Conservative | John Wyatt | 470 | 14.8 | −4.5 | |
| Majority | 193 | 6.0 | |||
| Turnout | 3,185 | 41.0 | |||
| Green gain from Liberal Democrats | Swing | ||||
| Party | Candidate | Votes | % | ±% | |
|---|---|---|---|---|---|
| Conservative | Judith Virgo | 1,725 | 47.7 | +1.6 | |
| Liberal Democrats | Jacqueline Sutton | 1,474 | 40.7 | +7.4 | |
| Green | Richard Bearman | 239 | 6.6 | +0.7 | |
| Labour | John Cowan | 180 | 5.0 | −9.7 | |
| Majority | 251 | 7.0 | |||
| Turnout | 3,618 | ||||
| Conservative hold | Swing | ||||
| Party | Candidate | Votes | % | ±% | |
|---|---|---|---|---|---|
| Conservative | Tony Tomkinson | 1,743 | 46.0 | +5.2 | |
| Liberal Democrats | Bronwen Jenkins | 1,347 | 35.6 | −8.1 | |
| Green | Paul Fitzgerald | 378 | 9.8 | +2.2 | |
| Labour | Jeanette Fowler | 324 | 8.6 | +8.6 | |
| Majority | 396 | 10.4 | |||
| Turnout | 3,787 | 45.1 | |||
| Conservative gain from Liberal Democrats | Swing | ||||
| Party | Candidate | Votes | % | ±% | |
|---|---|---|---|---|---|
| Liberal Democrats | David Harrison | 1,696 | 60.6 | +23.2 | |
| Conservative | Ian Graham | 854 | 30.5 | −6.4 | |
| Labour | Terry Glasspoole | 177 | 6.3 | −19.4 | |
| UKIP | Vandra Ahlstrom | 71 | 2.5 | +2.5 | |
| Majority | 842 | 30.1 | |||
| Turnout | 2,798 | 39.0 | |||
| Liberal Democrats hold | Swing | ||||
| Party | Candidate | Votes | % | ±% | |
|---|---|---|---|---|---|
| Conservative | Judith Virgo | 1,015 | 46.6 | −5.4 | |
| Liberal Democrats | Jacqueline Sutton | 438 | 20.1 | −4.5 | |
| Labour | Marian Chapman | 424 | 19.5 | +11.4 | |
| Green | Janet Kitchener | 170 | 7.8 | −7.7 | |
| UKIP | Richard Coke | 133 | 6.1 | +6.1 | |
| Majority | 577 | 26.5 | −0.9 | ||
| Turnout | 2,185 | 26.1 | −20.8 | ||
| Conservative hold | Swing | −0.5 | |||
| Party | Candidate | Votes | % | ±% | |
|---|---|---|---|---|---|
| Conservative | Barry Stone | 1,611 | 49.0 | +3.6 | |
| Labour | Trevor Wainwright | 1,076 | 32.7 | +10.6 | |
| Independent | John Cooper | 418 | 12.7 | +12.7 | |
| Green | Michael Brackenbury | 184 | 5.6 | +5.6 | |
| Majority | 535 | 16.3 | +3.3 | ||
| Turnout | 3,289 | ||||
| Conservative hold | Swing | −3.5 | |||
| Party | Candidate | Votes | % | ±% | |
|---|---|---|---|---|---|
| Conservative | Judy Leggett | 664 | 40.6 | −8.2 | |
| Liberal Democrats | Bob Fowkes | 414 | 25.3 | +11.8 | |
| Labour Co-op | Chrissie Rumsby | 377 | 23.0 | +12.2 | |
| UKIP | Glenn Tingle | 107 | 6.5 | −9.7 | |
| Green | Jennifer Parkhouse | 75 | 4.6 | −6.0 | |
| Majority | 250 | 15.3 | −617.3 | ||
| Turnout | 1,642 | 25.7 | −12.5 | ||
| Conservative hold | Swing | −10.0 | |||
| Party | Candidate | Votes | % | ±% | |
|---|---|---|---|---|---|
| Labour Co-op | Susan Whitaker | 1,051 | 43.0 | +16.1 | |
| Liberal Democrats | David Fairbairn | 611 | 25.0 | −6.7 | |
| Green | Paul Neale | 492 | 20.1 | +7.4 | |
| Conservative | Mathew Morris | 160 | 6.5 | −6.5 | |
| UKIP | Stephen Emmens | 133 | 5.4 | −10.3 | |
| Majority | 440 | 18.0 | +13.1 | ||
| Turnout | 2,455 | ||||
| Labour Co-op gain from Liberal Democrats | Swing | +11.4 | |||
| Party | Candidate | Votes | % | ±% | |
|---|---|---|---|---|---|
| Labour | Alexandra Kampouropoulos | 824 | 45.8 | +34.1 | |
| Conservative | Paul Foster | 424 | 23.5 | −15.7 | |
| Liberal Democrats | Kathleen Mayer | 282 | 15.7 | −13.1 | |
| UKIP | Michael Stone | 271 | 15.0 | +15.0 | |
| Majority | 400 | 22.2 | +11.7 | ||
| Turnout | 1,806 | 22.5 | −12.4 | ||
| Labour gain from Conservative | Swing | +24.9 | |||
Percentage change is since June 2009.
| Party | Candidate | Votes | % | ±% | |
|---|---|---|---|---|---|
| Labour Co-op | Terry Jermy | 1,071 | 45.2 | +9.8 | |
| UKIP | John Newton | 900 | 38.0 | +2.6 | |
| Conservative | Tristan Ashby | 282 | 11.9 | −3.5 | |
| Independent | Danny Jeffrey | 78 | 3.3 | N/A | |
| Green | Sandra Walmsley | 40 | 1.7 | −1.1 | |
| Majority | 171 | 7.2 | |||
| Turnout | 2,371 | 24.6 | +0.9 | ||
| Labour gain from UKIP | Swing | 6.2 | |||
Percentage change is since May 2013. The by-election was triggered by the resignation of UKIP Councillor Peter Georgiou, after he admitted to shoplifting and tobacco duty evasion. [12]
| Party | Candidate | Votes | % | ±% | |
|---|---|---|---|---|---|
| Liberal Democrats | Eric Seward | 1,044 | 40.9 | +5.8 | |
| UKIP | Lynette Comber | 565 | 22.1 | −1.0 | |
| Labour | Stephen Burke | 442 | 17.3 | −3.9 | |
| Conservative | David Oliver | 359 | 14.1 | −2.4 | |
| Green | Paul Oakes | 80 | 3.1 | −0.9 | |
| Independent | Graham Jones | 61 | 2.4 | N/A | |
| Majority | 479 | 18.8 | |||
| Turnout | 2,562 | 29.5 | −5.6 | ||
| Liberal Democrats hold | Swing | ||||
| Party | Candidate | Votes | % | ±% | |
|---|---|---|---|---|---|
| Conservative | Graham Plant | 876 | 42.7 | +15.3 | |
| Labour | Tony Wright | 773 | 37.7 | +1.8 | |
| UKIP | Adrian Myers | 285 | 13.9 | −22.8 | |
| Liberal Democrats | Tony Harris | 66 | 3.2 | N/A | |
| Green | Harry Webb | 51 | 2.5 | N/A | |
| Majority | 103 | 5.0 | |||
| Turnout | 2,053 | 27.9 | |||
| Conservative gain from UKIP | Swing | ||||
The by-election was triggered by the resignation of Councillor Matthew Smith, who was elected as a member of the UK Independence Party, following his guilty plea to charges of electoral fraud. [14]
| Party | Candidate | Votes | % | ±% | |
|---|---|---|---|---|---|
| Labour Co-op | Chrissie Rumsby | 749 | 51.8 | +7.2 | |
| Conservative | Chelsea Bales | 279 | 19.3 | +8.7 | |
| Green | Richard Edwards | 209 | 14.4 | −6.8 | |
| UKIP | Michelle Ho | 148 | 10.2 | −9.2 | |
| Liberal Democrats | Tom Dymoke | 62 | 4.3 | +0.1 | |
| Majority | 470 | 32.5 | +9.2 | ||
| Turnout | 1,452 | 18.5 | −7.6 | ||
| Labour hold | Swing | −0.8 | |||
| Party | Candidate | Votes | % | ±% | |
|---|---|---|---|---|---|
| Conservative | Barry Stone | 1,094 | 57.0 | −6.7 | |
| Labour Co-op | David Bissonnet | 357 | 18.6 | +6.4 | |
| Liberal Democrats | Christopher Brown | 235 | 12.3 | +7.1 | |
| UKIP | Alan Baugh | 233 | 12.1 | −6.8 | |
| Majority | 737 | 38.4 | −6.4 | ||
| Turnout | 1,926 | 23.2 | −21.6 | ||
| Conservative hold | Swing | −6.6 | |||
| Party | Candidate | Votes | % | ±% | |
|---|---|---|---|---|---|
| Liberal Democrats | Alison Bradnock | 1,383 | 56.4 | +25.8 | |
| Conservative | Paul Rice | 697 | 28.4 | +1.0 | |
| UKIP | Barry Whitehouse | 219 | 8.9 | −17.8 | |
| Labour Co-op | David Spencer | 103 | 4.2 | −5.3 | |
| Green | Anne Filgate | 52 | 2.1 | −1.6 | |
| Majority | 686 | 28.0 | |||
| Turnout | 2,456 | 34.7 | −5.4 | ||
| Liberal Democrats hold | Swing | ||||
| Party | Candidate | Votes | % | ±% | |
|---|---|---|---|---|---|
| Conservative | Claire Bowes | 822 | 45.6 | +18.2 | |
| Independent | Keith Gilbert | 793 | 44.0 | +20.4 | |
| Labour | Joseph Sisto | 105 | 5.8 | −5.4 | |
| Green | Timothy Birt | 81 | 4.5 | +0.3 | |
| Majority | 29 | 1.6 | |||
| Turnout | 1,806 | 21 | |||
| Conservative gain from UKIP | Swing | N/A | |||
The by-election was triggered by the resignation of Councillor Stan Hebborn, who was elected for the UK Independence Party. [17]
| Party | Candidate | Votes | % | ±% | |
|---|---|---|---|---|---|
| Conservative | Edward Connolly | 955 | 64.8 | −8.0 | |
| Labour | Harry Clarke | 337 | 22.9 | +10.6 | |
| Liberal Democrats | Andrew Thorpe | 182 | 12.4 | −2.6 | |
| Majority | 618 | 41.2 | −16.6 | ||
| Turnout | 1,478 | 19.1 | −16.6 | ||
| Conservative hold | Swing | −9.3 | |||
| Party | Candidate | Votes | % | ±% | |
|---|---|---|---|---|---|
| Conservative | Fran Whymark | 922 | 55.7 | −3.2 | |
| Liberal Democrats | Stephen Heard | 395 | 23.9 | +4.0 | |
| Green | Jan Davis | 174 | 10.5 | +5.0 | |
| Labour | Juila Wheeler | 163 | 9.9 | −0.8 | |
| Majority | 527 | 31.9 | −7.2 | ||
| Turnout | 1,673 | 20.7 | −16.0 | ||
| Conservative hold | Swing | −3.6 | |||
| Party | Candidate | Votes | % | ±% | |
|---|---|---|---|---|---|
| Liberal Democrats | Rob Colwell | 648 | 39.3 | +28.1 | |
| Labour | Micaela Bartrum | 561 | 34.0 | −1.6 | |
| Conservative | Phil Trask | 378 | 22.9 | −25.4 | |
| Independent | Robin Talbot | 35 | 2.1 | +2.1 | |
| UKIP | Michael Stone | 28 | 1.7 | −3.2 | |
| Majority | 87 | 5.3 | |||
| Turnout | 1,650 | ||||
| Liberal Democrats gain from Conservative | Swing | ||||
| Party | Candidate | Votes | % | ±% | |
|---|---|---|---|---|---|
| Liberal Democrats | David Sayers | 364 | 35.6 | +28.5 | |
| Labour | Richard Johnson | 356 | 34.8 | +1.3 | |
| Conservative | Sheila Young | 256 | 25.0 | −31.1 | |
| Green | Vicky Fairweather | 46 | 4.5 | +4.5 | |
| Majority | 8 | 0.8 | |||
| Turnout | 1,022 | ||||
| Liberal Democrats gain from Conservative | Swing | ||||
| Party | Candidate | Votes | % | ±% | |
|---|---|---|---|---|---|
| Conservative | William Nunn | 1,288 | 50.8 | −17.8 | |
| Labour | Terry Land | 649 | 25.6 | +9.0 | |
| Liberal Democrats | Josie Ratcliff | 596 | 23.5 | +17.8 | |
| Majority | 639 | 25.2 | |||
| Turnout | 2,533 | ||||
| Conservative hold | Swing | ||||
| Party | Candidate | Votes | % | ±% | |
|---|---|---|---|---|---|
| Green | Catherine Rowett | 663 | 29.0 | +19.6 | |
| Conservative | Tony Holden | 582 | 25.4 | −18.2 | |
| Liberal Democrats | Ian Spratt | 409 | 17.9 | +7.4 | |
| Independent | Beverley Spratt | 405 | 17.7 | −6.0 | |
| Labour | Pam Reekie | 228 | 10.0 | −2.8 | |
| Majority | 81 | 3.5 | |||
| Turnout | 2,287 | 24.8 | −16.0 | ||
| Green gain from Conservative | Swing | +18.9 | |||
| Party | Candidate | Votes | % | ±% | |
|---|---|---|---|---|---|
| Liberal Democrats | John Crofts | 669 | 38.4 | +38.4 | |
| Conservative | Olivia Morris | 539 | 31.0 | −33.7 | |
| Green | Andrew de Whalley | 418 | 24.0 | +4.3 | |
| Labour | Lesley Marriage | 115 | 6.6 | −9.0 | |
| Majority | 130 | 7.5 | |||
| Turnout | 1,741 | ||||
| Liberal Democrats gain from Conservative | Swing | ||||
| Party | Candidate | Votes | % | ±% | |
|---|---|---|---|---|---|
| Independent | Simon Ring | 723 | 53.8 | +53.8 | |
| Conservative | Jason Law | 454 | 33.8 | +2.8 | |
| Labour | Wilf Lambert | 167 | 12.4 | +5.8 | |
| Majority | 269 | 20.0 | |||
| Turnout | 1,344 | ||||
| Independent gain from Liberal Democrats | Swing | ||||
| Party | Candidate | Votes | % | ±% | |
|---|---|---|---|---|---|
| Green | Serene Shibli | 1,255 | 50.3 | −1.6 | |
| Reform UK | Karl Catchpole | 510 | 20.4 | +20.4 | |
| Labour | Josh Horsfall | 432 | 17.3 | −15.9 | |
| Conservative | Edith Jones | 147 | 5.9 | −9.0 | |
| Liberal Democrats | Gordon Dean | 124 | 5.0 | +5.0 | |
| Homeland | Lorna Garner | 26 | 1.0 | +1.0 | |
| Majority | 745 | 29.9 | |||
| Turnout | 2,494 | ||||
| Green hold | Swing | ||||
| Party | Candidate | Votes | % | ±% | |
|---|---|---|---|---|---|
| Reform UK | Julian Kirk | 1,286 | 54.9 | +54.9 | |
| Liberal Democrats | Alan Holmes | 404 | 17.3 | +17.3 | |
| Conservative | Richard Blunt | 389 | 16.6 | −41.6 | |
| Labour | Matt Hannay | 120 | 5.1 | −9.4 | |
| Green | Rob Archer | 75 | 3.2 | +3.2 | |
| Independent | Michael Squire | 67 | 2.9 | +2.9 | |
| Majority | 882 | 37.7 | |||
| Turnout | 2,341 | ||||
| Reform UK gain from Conservative | Swing | ||||
| Party | Candidate | Votes | % | ±% | |
|---|---|---|---|---|---|
| Reform UK | David Bick | 917 | 47.9 | +47.9 | |
| Labour | Terry Land | 644 | 33.6 | −23.3 | |
| Conservative | Peter Wilkinson | 240 | 12.5 | −21.5 | |
| Liberal Democrats | Ian Minto | 115 | 6.0 | +1.2 | |
| Majority | 273 | 14.2 | |||
| Turnout | 1,916 | ||||
| Reform UK gain from Labour | Swing | ||||
| Current | |
|---|---|
| Former | |
aUnitary authorities referred to as county councils | |