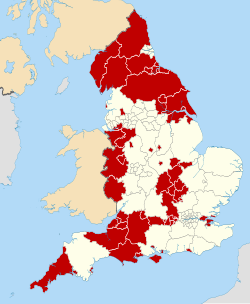
County result maps
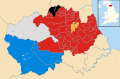 2005 results map
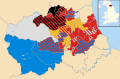 2008 results map
 2013 results map
 2017 results map
 2021 results map
 2025 results map
Durham County Council elections are held every four years. Durham County Council is the local authority for the unitary authority of County Durham. 98 councillors are elected from 51 wards. [1]
| Election | Labour | Conservative | Liberal Democrat [a] | Independent | Reform | Green | Total |
|---|---|---|---|---|---|---|---|
| 1973 [2] | 56 | 2 | 6 | 7 | - | - | 72 [3] |
| 1977 [4] | 41 | 14 | 7 | 10 | - | - | 72 |
| 1981 [5] | 53 | 7 | 6 | 6 | - | - | 72 |
| 1985 [6] | 50 | 5 | 7 [b] | 10 [c] | - | - | 72 |
| 1989 [7] | 56 | 7 | 5 | 4 | - | - | 72 |
| 1993 [8] | 56 | 6 | 6 | 4 | - | - | 72 |
| 1997 [9] | 53 | 2 | 2 | 4 | - | - | 61 |
| 2001 [10] | 53 | 2 | 4 | 2 | - | - | 61 |
| 2005 [11] | 53 | 2 | 5 | 3 | - | - | 63 |
| 2008 [12] | 67 | 10 | 27 | 22 | - | 0 | 126 |
| 2013 [13] | 94 | 4 | 9 | 19 | - | 0 | 126 |
| 2017 | 74 | 10 | 14 | 28 | - | 0 | 126 |
| 2021 | 53 | 24 | 17 | 32 | 0 | 1 | 126 |
| 2025 | 4 | 1 | 14 | 12 | 65 | 2 | 98 |


Prior to the formation of the unitary authority in 2009, the county was divided into a number of second tier districts. The following articles detail the local elections to those district councils. The Borough of Darlington has formed a unitary authority outside the area covered by the County Council since 1997.
The following is an incomplete list of by-elections to Durham County Council.
| Party | Candidate | Votes | % | ±% | |
|---|---|---|---|---|---|
| Liberal Democrats | 689 | 42.9 | +1.2 | ||
| Labour | 601 | 37.4 | −21.0 | ||
| Conservative | 318 | 19.8 | +19.8 | ||
| Majority | 88 | 5.5 | |||
| Turnout | 1,608 | 22.5 | |||
| Liberal Democrats gain from Labour | Swing | ||||
| Party | Candidate | Votes | % | ±% | |
|---|---|---|---|---|---|
| Independent | Reginald Ord | 519 | 37.2 | +2.2 | |
| Labour | 500 | 35.8 | −18.3 | ||
| Liberal Democrats | 322 | 23.1 | +23.1 | ||
| Conservative | 54 | 3.9 | −7.1 | ||
| Majority | 19 | 1.4 | |||
| Turnout | 1,395 | 22.0 | |||
| Independent gain from Labour | Swing | ||||
| Party | Candidate | Votes | % | ±% | |
|---|---|---|---|---|---|
| Labour | Leslie Vaux | 1,702 | 56.1 | −20.6 | |
| Liberal Democrats | David Rolfe | 566 | 18.7 | +4.3 | |
| BNP | Dean McAdam | 509 | 16.8 | +16.8 | |
| Conservative | Stuart Tilney | 256 | 8.4 | −0.5 | |
| Majority | 1,136 | 37.4 | |||
| Turnout | 3,033 | 46.4 | |||
| Labour hold | Swing | ||||
| Party | Candidate | Votes | % | ±% | |
|---|---|---|---|---|---|
| Labour | John Lethbridge | 1,538 | 66.3 | −2.0 | |
| Liberal Democrats | Jody Dunn | 782 | 33.7 | +9.6 | |
| Majority | 756 | 32.6 | |||
| Turnout | 2,320 | 43.7 | |||
| Labour hold | Swing | ||||
| Party | Candidate | Votes | % | ±% | |
|---|---|---|---|---|---|
| Labour | Abiodun Williams | 834 | 51.6 | +4.8 | |
| Liberal Democrats | Isobell Lunan | 561 | 34.7 | −9.1 | |
| Conservative | Michael Fishwick | 220 | 13.6 | +4.2 | |
| Majority | 273 | 16.9 | |||
| Turnout | 1,615 | 34.0 | |||
| Labour hold | Swing | ||||
| Party | Candidate | Votes | % | ±% | |
|---|---|---|---|---|---|
| Labour | George Burlison | 1,187 | 43.4 | −5.5 | |
| Liberal Democrats | Redvers Crooks | 1,037 | 37.9 | −2.9 | |
| Independent | Ian Rutland | 267 | 9.8 | +9.8 | |
| Conservative | Patricia Wynne | 245 | 9.0 | −1.4 | |
| Majority | 150 | 5.5 | |||
| Turnout | 2,737 | 37.1 | |||
| Labour hold | Swing | ||||
| Party | Candidate | Votes | % | ±% | |
|---|---|---|---|---|---|
| Labour | Edwin Mason | 775 | 84.0 | +4.3 | |
| Conservative | Lucille Nicholson | 148 | 16.0 | −4.3 | |
| Majority | 627 | 68.0 | |||
| Turnout | 923 | 18.7 | |||
| Labour hold | Swing | ||||
| Party | Candidate | Votes | % | ±% | |
|---|---|---|---|---|---|
| Labour | Colin Carr | 665 | 57.7 | −2.8 | |
| Liberal Democrats | Sean Kilkenny | 487 | 42.3 | +19.2 | |
| Majority | 178 | 15.4 | |||
| Turnout | 1,152 | 18.6 | |||
| Labour hold | Swing | ||||
| Party | Candidate | Votes | % | ±% | |
|---|---|---|---|---|---|
| Conservative | James Rowlandson | 1,263 | 46.9 | +4.2 | |
| Independent | Anthony Cooke | 634 | 23.5 | −20.0 | |
| Liberal Democrats | Michael Newlands | 479 | 17.8 | +17.8 | |
| Labour | Sharon Longcroft | 319 | 11.8 | −1.9 | |
| Majority | 629 | 23.4 | |||
| Turnout | 2,695 | 38.9 | |||
| Conservative hold | Swing | ||||
| Party | Candidate | Votes | % | ±% | |
|---|---|---|---|---|---|
| Labour | Alan Barker | 702 | 55.8 | −8.3 | |
| Independent | Terry Murray | 311 | 24.7 | +24.7 | |
| Liberal Democrats | Carole Harrison | 126 | 10.0 | −25.9 | |
| Conservative | Margaret Reid | 120 | 9.5 | +9.5 | |
| Majority | 391 | 31.1 | |||
| Turnout | 1,259 | 20.9 | |||
| Labour hold | Swing | ||||
| Party | Candidate | Votes | % | ±% | |
|---|---|---|---|---|---|
| Labour | John Turnbull | 1,204 | 64.0 | +13.2 | |
| Liberal Democrats | Maureen Smith | 538 | 28.6 | −3.6 | |
| Conservative | Mark Krajewski | 140 | 7.4 | −1.4 | |
| Majority | 666 | 35.4 | |||
| Turnout | 1,882 | ||||
| Labour hold | Swing | ||||
| Party | Candidate | Votes | % | ±% | |
|---|---|---|---|---|---|
| Labour | Jennifer Bell | 917 | 82.4 | +26.1 | |
| Conservative | Margaret Reid | 196 | 17.6 | +17.6 | |
| Majority | 721 | 64.8 | |||
| Turnout | 1,113 | ||||
| Labour hold | Swing | ||||
| Party | Candidate | Votes | % | ±% | |
|---|---|---|---|---|---|
| Labour | Jimmy Alvey | 767 | 70.1 | +25.7 | |
| Independent | Karen Hawley | 181 | 16.5 | +16.5 | |
| Liberal Democrats | Wendy Bentley | 99 | 9.0 | −46.6 | |
| Conservative | Harvey Morgan | 47 | 4.3 | +4.3 | |
| Majority | 586 | 53.6 | |||
| Turnout | 1,094 | ||||
| Labour gain from Liberal Democrats | Swing | ||||
| Party | Candidate | Votes | % | ±% | |
|---|---|---|---|---|---|
| Labour | Andrea Patterson | 741 | 40.3 | ||
| Independent | Ian Hirst | 496 | 27.0 | ||
| Wear Valley Independent Group | John Bailey | 360 | 19.6 | ||
| Liberal Democrats | David English | 145 | 7.9 | ||
| Conservative | Beaty Bainbridge | 54 | 2.9 | ||
| Green | Joanne Yelland | 41 | 2.2 | ||
| Majority | 245 | 13.3 | |||
| Turnout | 1837 | 18.6 | |||
| Labour hold | Swing | ||||
| Party | Candidate | Votes | % | ±% | |
|---|---|---|---|---|---|
| Labour | Maureen Stanton | 753 | 46.8 | +16.0 | |
| UKIP | Betty Hopson | 339 | 21.1 | +21.1 | |
| Liberal Democrats | David English | 233 | 14.5 | +7.6 | |
| Independent | Tony Simpson | 193 | 12.0 | +12.0 | |
| Conservative | Alan Booth | 90 | 5.6 | +5.6 | |
| Majority | 414 | 25.7 | |||
| Turnout | 1,608 | ||||
| Labour gain from Independent | Swing | ||||
| Party | Candidate | Votes | % | ±% | |
|---|---|---|---|---|---|
| Labour | Joanne Carr | 656 | 44.9 | +6.8 | |
| Derwentside Independents | Gill Burnett | 655 | 44.8 | +3.5 | |
| Conservative | Alan Booth | 83 | 5.7 | +5.7 | |
| Green | Melanie Howd | 68 | 4.7 | +4.7 | |
| Majority | 1 | 0.1 | |||
| Turnout | 1,462 | ||||
| Labour gain from Derwentside Independents | Swing | ||||
| Party | Candidate | Votes | % | ±% | |
|---|---|---|---|---|---|
| Labour | Heather Smith | 546 | 38.2 | −7.8 | |
| Conservative | Stephen Hugill | 396 | 27.7 | −0.3 | |
| UKIP | Ben Casey | 309 | 21.6 | −4.4 | |
| Independent | Lee Carnighan | 108 | 7.5 | +7.5 | |
| Green | Greg Robinson | 72 | 5.0 | +5.0 | |
| Majority | 150 | 10.5 | |||
| Turnout | 1,431 | ||||
| Labour hold | Swing | ||||
| Party | Candidate | Votes | % | ±% | |
|---|---|---|---|---|---|
| Conservative | Edward Henderson | 2,518 | 57.6 | −1.8 | |
| Green | Thomas Robinson | 972 | 22.3 | +1.8 | |
| Labour | Philip Hunt | 878 | 20.1 | +0.0 | |
| Majority | 1,546 | 35.4 | |||
| Turnout | 4,368 | ||||
| Conservative hold | Swing | ||||
| Party | Candidate | Votes | % | ±% | |
|---|---|---|---|---|---|
| Labour | John Lindsay | 2,266 | 49.8 | +14.8 | |
| Independent | Joseph Makepeace | 1,969 | 43.3 | +43.3 | |
| Green | William Lawrence | 316 | 6.9 | +6.9 | |
| Majority | 297 | 6.5 | |||
| Turnout | 4,551 | ||||
| Labour hold | Swing | ||||
| Party | Candidate | Votes | % | ±% | |
|---|---|---|---|---|---|
| Labour | William Kellett | 2,218 | 52.5 | +4.1 | |
| Conservative | Michael Fishwick | 965 | 22.9 | +13.4 | |
| Liberal Democrats | Andrew Tibbs | 531 | 12.6 | −19.1 | |
| Green | Joanna Smith | 508 | 12.0 | +12.0 | |
| Majority | 1,253 | 29.7 | |||
| Turnout | 4,222 | ||||
| Labour hold | Swing | ||||
| Party | Candidate | Votes | % | ±% | |
|---|---|---|---|---|---|
| Labour | Fraser Tinsley | 2,169 | 54.5 | +8.5 | |
| Independent | Matthew Todd | 1,512 | 38.0 | +38.0 | |
| Green | Mark Quinn | 301 | 7.6 | +7.6 | |
| Majority | 657 | 16.5 | |||
| Turnout | 3,982 | ||||
| Labour hold | Swing | ||||
| Party | Candidate | Votes | % | ±% | |
|---|---|---|---|---|---|
| Labour | Alan Liversidge | 595 | 52.5 | +9.4 | |
| North East | Ted Hall | 214 | 18.9 | +18.9 | |
| UKIP | Lee-James Harris | 131 | 11.6 | +11.6 | |
| Liberal Democrats | Michael Anderson | 107 | 9.4 | +9.4 | |
| Conservative | Beaty Bainbridge | 67 | 5.9 | +5.9 | |
| Green | Martie Warin | 19 | 1.7 | +1.7 | |
| Majority | 381 | 33.6 | |||
| Turnout | 1,133 | ||||
| Labour hold | Swing | ||||
| Party | Candidate | Votes | % | ±% | |
|---|---|---|---|---|---|
| Labour | Leanne Kennedy | 693 | 52.3 | +6.2 | |
| Seaham Community Party | Robert Arthur | 633 | 47.7 | +10.8 | |
| Majority | 60 | 4.6 | |||
| Turnout | 1,329 | 21.3 | |||
| Labour hold | Swing | ||||
| Party | Candidate | Votes | % | ±% | |
|---|---|---|---|---|---|
| Labour | Jude Grant | 1,150 | 65.4 | +15.2 | |
| Independent | Maurice Brown | 351 | 20.0 | +20.0 | |
| Liberal Democrats | Alan Bell | 117 | 6.7 | −3.6 | |
| Conservative | Michael Smith | 112 | 6.4 | −12.7 | |
| Green | Jonathan Elmer | 29 | 1.6 | +1.6 | |
| Majority | 799 | 45.4 | |||
| Turnout | 1,759 | ||||
| Labour hold | Swing | ||||
| Party | Candidate | Votes | % | ±% | |
|---|---|---|---|---|---|
| Labour | John Higgins | 458 | 64.1 | −9.6 | |
| Liberal Democrats | Edwin Simpson | 163 | 22.8 | +20.1 | |
| North East | Stephen Miles | 74 | 10.3 | +0.3 | |
| For Britain | Gareth Fry | 20 | 2.8 | +2.8 | |
| Majority | 295 | 41.3 | |||
| Turnout | 715 | ||||
| Labour hold | Swing | ||||
| Party | Candidate | Votes | % | ±% | |
|---|---|---|---|---|---|
| Liberal Democrats | Beverley Coult | 1,115 | 63.2 | +7.8 | |
| Labour | Anne Bonner | 366 | 20.7 | −7.0 | |
| Independent | Ryan Drion | 155 | 8.8 | +8.8 | |
| Conservative | Richard Lawrie | 128 | 7.3 | −9.6 | |
| Majority | 749 | 42.5 | |||
| Turnout | 1,764 | ||||
| Liberal Democrats hold | Swing | ||||
| Party | Candidate | Votes | % | ±% | |
|---|---|---|---|---|---|
| Liberal Democrats | James Huntington | 1,257 | 42.7 | +21.5 | |
| Labour | Samantha Townsend | 682 | 23.2 | −7.2 | |
| UKIP | Alan Breeze | 456 | 15.5 | +3.4 | |
| Independent | Robert Ingledew | 415 | 14.1 | −7.0 | |
| Conservative | Marie Carter-Robb | 131 | 4.5 | −10.7 | |
| Majority | 575 | 19.6 | |||
| Turnout | 2,941 | ||||
| Liberal Democrats gain from Labour | Swing | ||||
| Party | Candidate | Votes | % | ±% | |
|---|---|---|---|---|---|
| Independent | Ian Geldard | 489 | 18.7 | +18.7 | |
| Labour | Colin Nelson | 420 | 16.1 | −2.2 | |
| Liberal Democrats | Martin Jones | 373 | 14.3 | −6.0 | |
| Independent | Billy McAloon | 358 | 13.7 | +13.7 | |
| Independent | Pete Molloy | 332 | 12.7 | −2.1 | |
| UKIP | Bob Purvis | 281 | 10.8 | +4.4 | |
| Spennymoor Independents | Ronald Highley | 221 | 8.5 | −19.6 | |
| Conservative | James Cosslett | 137 | 5.2 | −3.7 | |
| Majority | 69 | 2.6 | |||
| Turnout | 2,611 | ||||
| Independent gain from Spennymoor Independents | Swing | ||||
| Party | Candidate | Votes | % | ±% | |
|---|---|---|---|---|---|
| Labour | Curtis Bihari | 876 | 41.3 | +6.4 | |
| Independent | Glenys Newby | 528 | 24.9 | +24.9 | |
| Conservative | David Farry | 348 | 16.4 | −11.9 | |
| Independent | Joseph Makepeace | 166 | 7.8 | +7.8 | |
| Green | Rebecca Dixon-McWaters | 165 | 7.8 | +7.8 | |
| Freedom Alliance | Kaela Banthorpe | 23 | 1.3 | +1.3 | |
| Liberal Democrats | Bill Thorkildsen | 9 | 0.4 | +0.4 | |
| Majority | 348 | 16.4 | |||
| Turnout | 2,120 | ||||
| Labour gain from Independent | Swing | ||||
| Party | Candidate | Votes | % | ±% | |
|---|---|---|---|---|---|
| Labour | George Smith | 956 | 56.3 | +12.2 | |
| Conservative | Lyndsey Fox | 554 | 32.6 | −10.2 | |
| Independent | Nick Brown | 187 | 11.0 | +11.0 | |
| Majority | 402 | 23.7 | |||
| Turnout | 1,697 | ||||
| Labour gain from Conservative | Swing | ||||
| Party | Candidate | Votes | % | ±% | |
|---|---|---|---|---|---|
| Labour | Julie Scurfield | 716 | 59.8 | +28.9 | |
| Conservative | Allan Bainbridge | 439 | 36.6 | −4.9 | |
| Liberal Democrats | Russell Haswell | 43 | 3.6 | −1.4 | |
| Majority | 277 | 23.1 | |||
| Turnout | 1,198 | ||||
| Labour gain from Conservative | Swing | ||||
| Party | Candidate | Votes | % | ±% | |
|---|---|---|---|---|---|
| Labour | June Watson | 514 | 55.9 | +5.4 | |
| Independent | Bob Arthur | 339 | 36.9 | +36.9 | |
| Conservative | Josh Rayner | 56 | 6.1 | −10.0 | |
| Liberal Democrats | Roger Vila | 10 | 1.1 | +1.1 | |
| Majority | 175 | 19.0 | |||
| Turnout | 919 | ||||
| Labour hold | Swing | ||||
| Party | Candidate | Votes | % | ±% | |
|---|---|---|---|---|---|
| Labour | June Clark | 852 | 76.2 | +8.3 | |
| North East | Robert Fishwick | 180 | 16.1 | −10.4 | |
| Conservative | George Carter | 66 | 5.9 | −9.7 | |
| Liberal Democrats | Neil Thompson | 20 | 1.8 | +1.8 | |
| Majority | 672 | 60.1 | |||
| Turnout | 1,118 | ||||
| Labour hold | Swing | ||||
| Party | Candidate | Votes | % | ±% | |
|---|---|---|---|---|---|
| Labour | Viv Anderson | 2,479 | 43.5 | +9.9 | |
| Independent | Jamie Peterson | 1,257 | 22.1 | +22.1 | |
| Independent | Stuart Dunn | 938 | 16.5 | +16.5 | |
| Conservative | Oliver Peeke | 705 | 12.4 | −5.9 | |
| Liberal Democrats | Martin Jones | 318 | 5.6 | +1.9 | |
| Majority | 1,222 | 21.4 | |||
| Turnout | 5,697 | ||||
| Labour hold | Swing | ||||
Andrew Kilburn, who won a seat in the 2025 election, did not take up his seat due to being disqualified as a local government employee. [45]
| Party | Candidate | Votes | % | ±% | |
|---|---|---|---|---|---|
| Liberal Democrats | Terry Rooney | 824 | 28.0 | +16.5 | |
| Labour | Kevin Earley | 800 | 27.2 | +0.8 | |
| Reform UK | Stephen Harrison | 747 | 25.4 | −6.6 | |
| Independent | Stephen Robinson | 459 | 15.6 | −9.3 | |
| Conservative | David Lowes | 76 | 2.6 | −4.3 | |
| Green | Richard Simpson | 40 | 1.4 | ||
| Majority | 24 | 0.8 | |||
| Turnout | 2,953 | 37 | |||
| Liberal Democrats gain from Reform UK | Swing | ||||
{{cite web}}: CS1 maint: archived copy as title (link)