Council elections
| Year | Conservative | Liberal Democrats [a] | Labour | Reform UK | Mebyon Kernow | Green [b] | UKIP | Independents & Others | Council control after election | |
|---|---|---|---|---|---|---|---|---|---|---|
| Local government reorganisation; council reorganised (79 seats) | ||||||||||
| 1973 | 5 | 0 | 3 | – | 0 | – | – | 71 | Independent | |
| 1977 | 13 | 0 | 1 | – | 0 | 0 | – | 65 | Independent | |
| 1981 | 16 | 12 | 6 | – | 0 | 0 | – | 45 [c] | Independent | |
| New division boundaries (79 seats) | ||||||||||
| 1985 | 16 | 30 | 5 | – | 1 | 0 | – | 27 [c] | No overall control | |
| 1989 | 14 | 32 | 8 | – | 1 | 0 | – | 24 [c] | No overall control | |
| 1993 | 6 | 41 | 8 | – | 1 | 0 | – | 23 [c] | Liberal Democrats | |
| 1997 | 7 | 39 | 8 | – | 1 | 0 | 0 | 24 | No overall control | |
| 2001 | 9 | 35 | 9 | – | 0 | 0 | 0 | 26 | No overall control | |
| New division boundaries (82 seats) | ||||||||||
| 2005 | 9 | 48 | 5 | – | 0 | 0 | 0 | 20 | Liberal Democrats | |
| Cornwall becomes a unitary authority (123 seats) | ||||||||||
| 2009 | 50 | 38 | 0 | – | 3 | 0 | 0 | 32 | No overall control | |
| New ward boundaries (123 seats) | ||||||||||
| 2013 | 31 | 36 | 8 | – | 4 | 1 | 6 | 37 | No overall control | |
| 2017 | 46 | 37 | 5 | – | 4 | 0 | 0 | 30 | No overall control | |
| New ward boundaries (87 seats) | ||||||||||
| 2021 | 47 | 13 | 5 | 0 | 5 | 1 | 0 | 16 | Conservative | |
| 2025 | 7 | 26 | 4 | 28 | 3 | 3 | 0 | 16 | No overall control | |
Non-metropolitan county elections
| Year with link to article | Control | Notes | |
|---|---|---|---|
| 1973 | Independent | ||
| 1977 | Independent | ||
| 1981 | Independent | ||
| 1985 | No overall control | (boundary changes increased the number of seats by 4) [4] | |
| 1989 | No overall control | ||
| 1993 | Liberal Democrats | ||
| 1997 | No overall control | ||
| 2001 | No overall control | ||
| 2005 | Liberal Democrats | (boundary changes reduced the number of seats by 8) [5] | |
Result maps
 2005 results map

Unitary authority elections
| Year | Reform UK | Conservative | Liberal Democrats | Labour | Mebyon Kernow | UKIP | Green | Independent | Council control after election | |
|---|---|---|---|---|---|---|---|---|---|---|
| 2009 [6] | Did Not Exist | 50 | 38 | 0 | 3 | 0 | 0 | 32 | No overall control | |
| 2013 [d] [8] | Did Not Exist | 31 | 36 | 8 | 4 | 6 | 1 | 37 | No overall control | |
| 2017 [9] | Did Not Exist | 46 | 37 | 5 | 4 | 0 | 0 | 30 | No overall control | |
| 2021 [e] [11] | 0 | 47 | 13 | 5 | 5 | 0 | 1 | 16 | Conservative | |
| 2025 [12] | 28 | 7 | 26 | 4 | 3 | 0 | 3 | 16 | No overall control | |
Result maps
 2009 results map
 2013 results map
 2017 results map
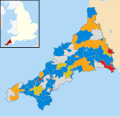 2021 results map
 2025 results map


