2017 Cornwall Council election

Last updated

2017 Cornwall Council election
Flag of Cornwall.svg
  2013 4 May 2017 2021  

123 seats to Cornwall Council
62 seats needed for a majority
 First partySecond partyThird party
 
Party Conservative Liberal Democrats Independent
Last election31 seats, 24.3%36 seats, 23.0%37 seats, 21.9%
Seats won463830
Seat changeIncrease2.svg15Increase2.svg2Decrease2.svg7
Popular vote58,89049,90033,950
Percentage35.2%29.8%20.3%
SwingIncrease2.svg10.9%Increase2.svg6.8%Decrease2.svg1.6%

 Fourth partyFifth party
 
Party Labour Mebyon Kernow
Last election8 seats, 8.1%4 seats, 4.8%
Seats won54
Seat changeDecrease2.svg3Steady2.svg
Popular vote13,4215,555
Percentage8.0%3.3%
SwingDecrease2.svg0.1%Decrease2.svg1.5%

Cornwall Council political divisions May 2017 map.svg
Map showing the composition of Cornwall Council following the election. Blue showing Conservative, red showing Labour, yellow showing Liberal Democrats, grey showing independents and old gold showing Mebyon Kernow.

Council control before election

No Overall Control

Council control after election

No Overall Control

The 2017 Cornwall Council election was held on 4 May 2017 as part of the 2017 local elections in the United Kingdom. [1] 122 councillors were elected from the 121 electoral divisions of Cornwall Council, which returned either one or two councillors each by first-past-the-post voting for a four-year term of office. Although originally scheduled to take place on the same day, the election in the Bodmin St Petroc ward was countermanded following the death of Liberal Democrat candidate Steve Rogerson and was held on 8 June. [2]

Contents

Background

The elections for Cornwall Council is the third since its creation in 2009. Cornwall had previously been administered as a non-metropolitan county, with local government powers split between Cornwall County Council and the six non-metropolitan districts of Caradon, Carrick, Kerrier, North Cornwall, Penwith and Restormel. These were abolished as part of the 2009 structural changes to local government in England, which created a singular unitary authority. [3] The previous two elections resulted in no group gaining a majority, requiring the support of independents for any single party to govern.[ citation needed ]

All wards were to be contested in the election, with a total of 123 wards being contested (Bude electing 2 councillors for a total of 123 available seats overall). The Liberal Democrats fielded a candidate in every single ward, followed closely by the Conservatives with 119 candidates. Labour fielded 58, the Green Party and UKIP each stood 21, and Cornish nationalist party Mebyon Kernow stood 19. The Liberal Party in Cornwall and TUSC stood two candidates each. 83 independents were also standing, with some wards having multiple independent candidates. [4]

Elections to town and parish councils across Cornwall were also scheduled to take place on 4 May. [5] However, not all council elections were contested, as the number of candidates was not greater than the seats available. Councils that have vacancies after the elections may attempt to co-opt additional councillors.

Eligibility

All locally registered electors (British, Irish, Commonwealth and European Union citizens) who are aged 18 or over on Thursday 4 May 2017 will be entitled to vote in the local elections. Those who are temporarily away from their ordinary address (for example, away working, on holiday, in student accommodation or in hospital) are also entitled to vote in the local elections, [6] although those who had moved abroad and registered as overseas electors cannot vote in the local elections. It is possible to register to vote at more than one address (such as a university student who had a term-time address and lives at home during holidays) at the discretion of the local Electoral Register Office, but it remains an offence to vote more than once in the same local government election. [7]

Composition before election

Elected in 2013Before election
PartySeatsPartySeats
Independent 37 Liberal Democrats 43
Liberal Democrats 36 Independent 34
Conservative 31 Conservative 28
Labour 8 Labour 7
UKIP 6 Mebyon Kernow 4
Mebyon Kernow 4 UKIP 1
Green 1 Green 1
Independent (non affiliated)0 Independent (non affiliated)5

Results summary

2017 Cornwall Council election [8] [9]
PartySeatsGainsLossesNet gain/lossSeats %Votes %Votes+/−
  Conservative 46249Increase2.svg1537.435.258,890Increase2.svg10.9
  Liberal Democrats 381210Increase2.svg230.929.849,900Increase2.svg6.8
  Independent 30613Decrease2.svg724.420.333,950Decrease2.svg1.6
  Labour 514Decrease2.svg34.18.013,421Decrease2.svg0.1
  Mebyon Kernow 400Steady2.svg03.33.35,555Decrease2.svg1.5
  Green 001Decrease2.svg10.02.03,409Decrease2.svg0.6
  UKIP 006Decrease2.svg60.01.32,183Decrease2.svg13.8
  Liberal 000Steady2.svg00.00.1116Steady2.svg0.0
  TUSC 000Steady2.svg00.00.196New

    Electoral division results

    The electoral division results listed below [10] are based on the changes from the 2013 elections, [11] not taking into account any mid-term by-elections or party defections.

    Altarnun
    PartyCandidateVotes%±%
    Liberal Democrats Adrian Parsons 694 50.1 +28.0
    Conservative Peter Hall56240.6+3.1
    Labour Rosalyn May1299.3-1.4
    Majority1329.5
    Turnout 1,38552.4+12.8
    Liberal Democrats gain from Conservative Swing
    Bodmin St Leonard
    PartyCandidateVotes%±%
    Liberal Democrats Pat Rogerson 480 62.3 +0.2
    Independent Roger Lashbrook17022.1N/A
    Labour Tobias Savage12015.6+6.8
    Majority31040.3+2.1
    Turnout 77022.8-0.7
    Liberal Democrats hold Swing
    Bodmin St Mary's
    PartyCandidateVotes%±%
    Liberal Democrats Jacquie Gammon 507 48.7 -7.7
    Conservative Louise Garfield28727.6N/A
    Labour Joy Bassett24723.7+16.5
    Majority22021.1-15.4
    Turnout 1,04128.4+1.0
    Liberal Democrats hold Swing

    The election for a councillor to represent the Bodmin St Petroc division was postponed to 8 June due to the death of the incumbent Liberal Democrat councillor Steve Rogerson during the campaign. [2]

    Bodmin St Petroc [12]
    PartyCandidateVotes%±%
    Liberal Democrats Leigh Frost 1,047 39.4 -16.7
    Conservative Sylvia Berry91434.4N/A
    Labour Marc Thorne46317.4N/A
    Mebyon Kernow John Gibbs2318.7-3.3
    Majority1335.0-34.9
    Turnout 2,65567.3+37.7
    Liberal Democrats hold Swing
    Breage, Germoe and Sithney
    PartyCandidateVotes%±%
    Conservative John Keeling 802 47.9 -7.2
    Mebyon Kernow Michael Tresidder34720.7N/A
    Green Karen La Borde32219.2N/A
    Liberal Democrats Philippe Hadley20512.2N/A
    Majority45527.2-20.0
    Turnout 1,67647.1+18.9
    Conservative hold Swing
    Bude (2)
    PartyCandidateVotes%±%
    Liberal Democrats Nigel Pearce 1,395 28.7
    Liberal Democrats Peter La Broy 1,272 26.2
    Conservative Bob Willingham1,00620.7
    Conservative Lea Deely93819.3
    Labour Fred Richens2485.1
    Turnout 4,85976.5+24.1
    Liberal Democrats hold Swing
    Liberal Democrats hold Swing
    Bugle
    PartyCandidateVotes%±%
    Conservative Sally-Anne Saunders 488 37.9 +14.0
    Mebyon Kernow Garry Tregidga 36028.0+13.3
    Liberal Democrats Kirk Pollard35427.5-5.9
    Independent David Highland846.5N/A
    Majority1289.9
    Turnout 1,28635.0+9.8
    Conservative gain from Liberal Democrats Swing
    Callington
    PartyCandidateVotes%±%
    Mebyon Kernow Andrew Long 636 55.0 -5.6
    Conservative Sally Ann Nicholson26923.2+14.1
    Labour Graham Fox978.4N/A
    Liberal Democrats Christopher Dwane827.1+4.2
    UKIP David Williams736.3-21.1
    Majority36731.7-0.5
    Turnout 1,15732.6+1.2
    Mebyon Kernow hold Swing
    Camborne Pendarves
    PartyCandidateVotes%±%
    Conservative John Herd 705 60.1 +30.3
    Liberal Democrats Tom Simmons26622.7N/A
    Mebyon Kernow John Gillingham20217.2-2.5
    Majority43937.4
    Turnout 1,17336.7+4.6
    Conservative gain from UKIP Swing
    Camborne Roskear
    PartyCandidateVotes%±%
    Independent Paul White 668 56.1 N/A
    Conservative Maurice Pascoe30425.5-10.3
    Liberal Democrats Roger Richards2379.7N/A
    Mebyon Kernow Linda Lemon1028.6+3.0
    Majority36430.6
    Turnout 1,19033.0-2.1
    Independent gain from Conservative Swing
    Camborne Trelowarren
    PartyCandidateVotes%±%
    Conservative Jeff Collins 197 21.5 -8.8
    Labour Geoffrey Guffogg19421.1-3.4
    Mebyon Kernow Zoe Fox19220.9+7.9
    Independent Val Dalley16918.4N/A
    Independent Jon Stoneman12613.7N/A
    Liberal Democrats Geoff Williams404.4N/A
    Majority30.4-1.8
    Turnout 91827.0+3.4
    Conservative hold Swing
    Camborne Treslothan
    PartyCandidateVotes%±%
    Conservative David Atherfold 380 40.8 +25.7
    Labour Paul Farmer21423.0+3.2
    Green Steve Medlyn16717.9+11.5
    Mebyon Kernow Alan Sanders10411.2-5.0
    Liberal Democrats Graham Ford677.2+0.4
    Majority16617.8
    Turnout 93230.3+2.2
    Conservative gain from Labour Swing
    Camborne Treswithian
    PartyCandidateVotes%±%
    Conservative David Biggs 451 44.9 +20.1
    Liberal Democrats Anna Pascoe23723.6N/A
    Labour Dave Wilkins21525.2-3.8
    Independent Mike Champion535.3N/A
    Green Jacqueline Merrick494.9N/A
    Majority21421.3
    Turnout 1,00533.8+5.3
    Conservative gain from UKIP Swing
    Camelford
    PartyCandidateVotes%±%
    Liberal Democrats Rob Rotchell 617 62.4 +12.0
    Green Claire Hewlett37237.6N/A
    Majority24524.8+24.0
    Turnout 98931.4+2.6
    Liberal Democrats hold Swing
    Carharrack, Gwennap and St Day
    PartyCandidateVotes%±%
    Independent Mark Kaczmarek 968 63.0 +0.6
    Conservative Kim Lonsdale24115.7N/A
    Labour Andy Blake1459.4+0.6
    Green Geoff Garbett1308.5-1.8
    Liberal Democrats Adam Killeya1308.5N/A
    Majority72747.3+3.3
    Turnout 1,53640.6+7.9
    Independent hold Swing
    Chacewater, Kenwyn and Baldhu
    PartyCandidateVotes%±%
    Conservative John Dyer 674 58.2 +5.9
    Liberal Democrats Ingrid Quaife30126.0N/A
    Green Julie Bennett18315.8N/A
    Majority37322.2-4.2
    Turnout 1,15837.5+3.8
    Conservative hold Swing
    Constantine, Mawnan and Budock
    PartyCandidateVotes%±%
    Conservative John Bastin 1,134 66.4 +9.1
    Liberal Democrats Graham Marsden57333.6N/A
    Majority56132.8+4.5
    Turnout 1,70744.3+5.7
    Conservative hold Swing
    Crowan and Wendron
    PartyCandidateVotes%±%
    Mebyon Kernow Loveday Jenkin 637 33.9 -21.0
    Conservative Roger Smith61232.6+11.4
    Independent Geoffrey Henwood32617.3N/A
    Labour Henry Hodson20711.0+3.7
    Liberal Democrats Kevan Cook975.2N/A
    Majority251.3-32.4
    Turnout 1,87943.1+11.0
    Mebyon Kernow hold Swing
    Falmouth Arwenack
    PartyCandidateVotes%±%
    Conservative Geoffrey Evans 668 53.6 -15.3
    Liberal Democrats Tony Parker30924.8+13.5
    Labour Kate Thomas27021.7+1.8
    Majority35928.8-20.2
    Turnout 90643.2+12.3
    Conservative hold Swing
    Falmouth Boslowick
    PartyCandidateVotes%±%
    Conservative Alan Jewell 489 32.1 +9.1
    Independent Roger Bonney33922.2N/A
    Labour Nicholas Jemmett30219.8+4.5
    Liberal Democrats Steve Eva27117.8-3.1
    Independent Patricia Minson795.1N/A
    Mebyon Kernow Jenny Booth453.0N/A
    Majority1509.8+8.6
    Turnout 1,52539.6+6.1
    Conservative hold Swing
    Falmouth Penwerris
    PartyCandidateVotes%±%
    Liberal Democrats Mathew McCarthy 502 39.5 N/A
    Labour Anna Gillett37729.6-6.6
    Independent Grenville Chappel25019.7-8.7
    Conservative Nigel Rimmer14311.2N/A
    Majority1259.9
    Turnout 1,27237.7+10.2
    Liberal Democrats gain from Labour Co-op Swing
    Falmouth Smithick
    PartyCandidateVotes%±%
    Labour Co-op Candy Atherton 480 40.3 +6.9
    Conservative Wendy Frost29124.4+10.6
    Liberal Democrats John Spargo22518.9+2.6
    Green Tom Scott19516.4N/A
    Majority18915.9-1.0
    Turnout 1,19535.6+8.3
    Labour Co-op hold Swing
    Falmouth Trescobeas
    PartyCandidateVotes%±%
    Independent David Saunby 623 50.6 +12.2
    Labour Co-op Brod Ross25520.7-3.0
    Conservative Frances Gwyn19916.2+8.4
    Liberal Democrats Stephen Williams887.1+4.6
    Green Euan McPhee675.4+1.8
    Majority36829.9+15.2
    Turnout 1,23235.1+2.5
    Independent hold Swing
    Feock and Playing Place
    PartyCandidateVotes%±%
    Conservative Martyn Alvey 894 46.7 +2.7
    Independent Bob Richards61732.3-6.1
    Liberal Democrats Ian Macdonald40221.0+11.0
    Majority27714.4+8.9
    Turnout 1,91349.8+2.9
    Conservative hold Swing
    Four Lanes
    PartyCandidateVotes%±%
    Independent Robert Hendry 509 43.1 N/A
    Liberal Democrats Florence Macdonald28023.7N/A
    Conservative Peter Sheppard23319.7-0.9
    Mebyon Kernow Chris Lawrence826.9-6.8
    Liberal Paul Holmes776.5-10.5
    Majority22919.4
    Turnout 1,18133.8+9.3
    Independent gain from UKIP Swing
    Fowey and Tywardreath
    PartyCandidateVotes%±%
    Conservative Andy Virr 855 48.2 +22.8
    Liberal Democrats David Hughes50928.7-9.1
    Independent Malcolm Harris36520.6N/A
    TUSC Robert Rooney462.6N/A
    Majority34619.5
    Turnout 1,77552.4+12.3
    Conservative gain from Liberal Democrats Swing
    Grenville and Stratton
    PartyCandidateVotes%±%
    Liberal Democrats Paula Dolphin 727 54.3 -13.5
    Conservative Shorne Tilbey61245.7+13.5
    Majority1158.6-27.0
    Turnout 1,33937.1+0.5
    Liberal Democrats hold Swing
    Gulval and Heamoor
    PartyCandidateVotes%±%
    Liberal Democrats Mario Fonk 961 63.9 -2.6
    Conservative Simon Jones32621.7+12.0
    Labour Alana Bates21814.5N/A
    Majority63542.2-0.6
    Turnout 1,50545.3+6.4
    Liberal Democrats hold Swing
    Gunnislake and Calstock
    PartyCandidateVotes%±%
    Labour Dorothy Kirk 800 44.4 +10.0
    Conservative Sydney Booth66036.7+6.6
    Liberal Democrats Theo Brown34018.9+7.9
    Majority1407.7+3.4
    Turnout 1,80050.0+12.4
    Labour hold Swing
    Gwinear-Gwithian and St Erth
    PartyCandidateVotes%±%
    Conservative Lionel Pascoe 690 45.9 +15.8
    Independent Angelo Spencer-Smith39626.4+8.4
    Independent Mike Smith24516.3N/A
    Liberal Democrats Frank Blewett17111.4+7.0
    Majority10319.5+12.0
    Turnout 1,50240.0+2.8
    Conservative hold Swing
    Hayle North
    PartyCandidateVotes%±%
    Independent John Pollard 821 69.8 +4.4
    Conservative Philip Southwood21918.6N/A
    Liberal Democrats Mary McWilliams13611.6N/A
    Majority60251.2+9.5
    Turnout 1,09432.7+3.4
    Independent hold Swing
    Hayle South
    PartyCandidateVotes%±%
    Independent Graham Coad 569 53.6 +40.5
    Conservative Peter Channon35633.6N/A
    Liberal Democrats Victoria Hatton13612.8N/A
    Majority21320.0
    Turnout 1,06132.3-1.6
    Independent gain from Independent Swing
    Helston North
    PartyCandidateVotes%±%
    Independent Mike Thomas 534 34.6 N/A
    Independent Phil Martin49031.7-12.5
    Conservative Andrew Lewis42127.3-9.7
    Liberal Democrats Yvonne Bates996.4+1.3
    Majority442.9
    Turnout 1,54442.3+6.7
    Independent gain from Independent Swing
    Helston South
    PartyCandidateVotes%±%
    Liberal Democrats John Martin 455 39.7 +19.9
    Conservative David Adams37132.4+19.4
    Independent James Buchanan13111.4N/A
    Mebyon Kernow Alice Waddoups1099.5N/A
    UKIP Thomas Maher796.9-12.4
    Majority847.3
    Turnout 1,14529.1+1.9
    Liberal Democrats gain from Independent Swing
    Illogan
    PartyCandidateVotes%±%
    Liberal Democrats David Ekinsmyth 558 42.8 +29.1
    Independent Dave Crabtree35927.5N/A
    Conservative Dominic Lonsdale34826.7+2.1
    Liberal Jean Pollock393.0N/A
    Majority19915.3
    Turnout 1,30435.6+5.2
    Liberal Democrats gain from Conservative Swing
    Ladock, St Clement and St Erme
    PartyCandidateVotes%±%
    Independent Mike Eathorne-Gibbons 602 44.6 N/A
    Conservative Paul Charlesworth39329.1-28.3
    Labour Steve Robinson21015.5+7.8
    Liberal Democrats Michael Wilson14610.8-3.9
    Majority20915.5
    Turnout 1,35138.0+5.4
    Independent gain from Conservative Swing
    Lanivet and Blisland
    PartyCandidateVotes%±%
    Liberal Democrats Chris Batters 735 53.2 +5.7
    Conservative Rachel Beadle48535.1N/A
    Independent Andy Coppin1047.5N/A
    UKIP Oliver Challis574.1-31.9
    Majority25018.1+6.6
    Turnout 1,38143.5+9.4
    Liberal Democrats hold Swing
    Lanner and Stithians
    PartyCandidateVotes%±%
    Independent John Thomas 547 40.4 +7.1
    Independent James Biscoe26319.4+4.7
    Conservative Oliver Mas25518.8N/A
    Labour Laura Eyre1349.9+3.5
    Liberal Democrats Nicholas Prescott836.1-4.5
    Mebyon Kernow Matt Blewett735.4N/A
    Majority24421.0+17.8
    Turnout 1,35535.8+1.6
    Independent hold Swing
    Launceston Central
    PartyCandidateVotes%±%
    Liberal Democrats Gemma Massey 522 58.1 -12.7
    Conservative Toby Benson25428.3+11.1
    Labour Alan Bowen12213.6+1.6
    Majority26829.8-23.8
    Turnout 89832.3+6.4
    Liberal Democrats hold Swing
    Launceston North and North Petherwin
    PartyCandidateVotes%±%
    Liberal Democrats Adam Paynter 1,007 53.3 +1.7
    Conservative Val Bugden-Cawsey78541.5+27.7
    Labour Gill Brown995.2N/A
    Majority22211.8-15.4
    Turnout 1,89150.9+11.6
    Liberal Democrats hold Swing
    Launceston South
    PartyCandidateVotes%±%
    Liberal Democrats Jade Farrington 732 69.2 +23.7
    Conservative Shaun Watchorn26324.9N/A
    Labour Co-op Matthew Harris636.0-3.2
    Majority46944.3+22.8
    Turnout 1,05835.4+1.0
    Liberal Democrats hold Swing
    Lelant and Carbis Bay
    PartyCandidateVotes%±%
    Conservative Linda Taylor 551 41.4 +6.7
    Independent Joan Symons46134.6N/A
    Independent Richard Glanville16412.3+2.2
    Liberal Democrats Julia Macdonald15511.6+1.7
    Majority906.8-5.3
    Turnout 1,33143.4+7.8
    Conservative hold Swing
    Liskeard East
    PartyCandidateVotes%±%
    Independent Sally Hawken 358 34.2 +0.7
    Conservative Kelvin Poplett28627.3+12.8
    Liberal Democrats Derris Watson25224.1-4.3
    Labour Susan Shand15114.4N/A
    Majority726.9+1.8
    Turnout 1,04728.8+2.7
    Independent hold Swing
    Liskeard North
    PartyCandidateVotes%±%
    Conservative Nick Craker 227 35.6 +13.5
    Independent Tony Powell14622.9N/A
    Labour Kerry Cassidy9715.2N/A
    Liberal Democrats Nik Alatortsev8913.9-13.9
    Independent Roger Holmes7912.4-16.6
    Majority8112.7
    Turnout 63841.0+4.9
    Conservative gain from Independent Swing
    Liskeard West and Dobwalls
    PartyCandidateVotes%±%
    Conservative Jane Pascoe 738 49.7 N/A
    Liberal Democrats Michael George50133.7-34.3
    Labour Tyler Bennetts18012.1N/A
    UKIP Chris Collins664.4-27.6
    Majority23716.0
    Turnout 1,48544.4+9.7
    Conservative gain from Liberal Democrats Swing
    Looe East
    PartyCandidateVotes%±%
    Independent Armand Toms 929 90.1 +31.4
    Liberal Democrats Gill Beswick1029.9+7.3
    Majority92780.2+40.8
    Turnout 1,03137.5-4.7
    Independent hold Swing
    Looe West, Lansallos and Lanteglos
    PartyCandidateVotes%±%
    Liberal Democrats Edwina Hannaford 1,119 63.8 +12.8
    Conservative Bob Davidson63636.2+8.5
    Majority48327.6+4.3
    Turnout 1,75546.0-2.2
    Liberal Democrats hold Swing
    Lostwithiel
    PartyCandidateVotes%±%
    Liberal Democrats Colin Martin 873 51.3 +42.2
    Conservative Clay Cowie68535.6+4.6
    UKIP Nigel Challis1458.5-20.0
    Majority18815.7+8.6
    Turnout 1,70350.3+13.7
    Liberal Democrats gain from Conservative Swing
    Ludgvan
    PartyCandidateVotes%±%
    Conservative Simon Elliott 547 40.2 -5.8
    Independent Roy Mann46429.2N/A
    Liberal Democrats Bill Mumford34521.7N/A
    Labour Mark Hassall1529.6N/A
    Green Ian Flindall805.0-18.9
    Majority8311.0+6.7
    Turnout 1,58847.9+13.2
    Conservative hold Swing
    Lynher
    PartyCandidateVotes%±%
    Conservative Sharon Daw 614 39.0 +9.8
    UKIP Stephanie McWilliam36122.9-12.1
    Labour Ruth Wilson23314.8N/A
    Liberal Democrats Christine Hordley22414.2-14.8
    Green Martin Corney1429.0N/A
    Majority25316.1
    Turnout 1,57444.6+6.8
    Conservative gain from UKIP Swing
    Mabe, Perranarworthal and St Gluvias
    PartyCandidateVotes%±%
    Conservative Reginald Williams 816 45.6 +17.2
    Liberal Democrats Simon Taylor47326.4+3.5
    Independent Peter Tisdale30316.9N/A
    Labour Cathy Page19911.1+2.2
    Majority34319.2
    Turnout 1,79141.4+1.7
    Conservative gain from UKIP Swing
    Marazion and Perranuthnoe
    PartyCandidateVotes%±%
    Conservative Sue Nicholas 741 46.0 +4.1
    Liberal Democrats Nigel Walker73445.6N/A
    UKIP Treve Green1368.4-28.7
    Majority70.4-4.5
    Turnout 1,61144.6+7.6
    Conservative hold Swing
    Menheniot
    PartyCandidateVotes%±%
    Conservative Phil Seeva 834 54.3 +16.4
    Liberal Democrats Charles Robert Boney70145.7+21.3
    Majority1338.6+1.7
    Turnout 1,53548.4+2.7
    Conservative hold Swing
    Mevagissey
    PartyCandidateVotes%±%
    Conservative James Mustoe 1,182 77.3 +53.3
    Liberal Democrats Garth Shephard34722.7+8.7
    Majority83554.6
    Turnout 1,52947.2+6.7
    Conservative gain from Labour Swing
    Mount Charles
    PartyCandidateVotes%±%
    Conservative Richard Pears 478 42.2 +16.0
    Liberal Democrats Peter Bishop25122.1+15.5
    Independent Gary King21418.9-18.1
    Labour Co-op Paul Roberts11910.5-1.6
    UKIP Andrea Gray726.3N/A
    Majority22720.1
    Turnout 1,13432.4+8.5
    Conservative gain from Independent Swing
    Mount Hawke and Portreath
    PartyCandidateVotes%±%
    Liberal Democrats Joyce Duffin 896 58.3 -8.4
    Conservative John Morgan46930.5+7.3
    Labour Linda Moore17311.2+1.1
    Majority42727.815.7
    Turnout 1,53841.4+8.0
    Liberal Democrats hold Swing
    Mullion and Grade-Ruan
    PartyCandidateVotes%±%
    Independent Carolyn Rule 704 42.8 -5.2
    Conservative Alfred Mesropians45827.8+4.1
    Liberal Democrats Marianna Baxter37522.8N/A
    Green Helen Angel1096.6N/A
    Majority24615.0-4.7
    Turnout 1,64649.6+13.7
    Independent hold Swing
    Newlyn and Goonhavern
    PartyCandidateVotes%±%
    Conservative Adrian Harvey 767 51.1 +4.9
    Liberal Democrats Howard Farmer56137.4N/A
    Independent James Tucker17211.5N/A
    Majority20613.7+11.5
    Turnout 1,50039.1+8.0
    Conservative hold Swing
    Newlyn and Mousehole
    PartyCandidateVotes%±%
    Conservative Roger Harding 725 45.9 -2.0
    Liberal Democrats Theo Blackmore51432.6+26.3
    Labour Christopher Drew22013.9+2.9
    Independent Nigel Davis724.6-1.4
    UKIP Adrian Smith483.0-15.3
    Majority21113.3-16.1
    Turnout 1,57947.1+6.7
    Conservative hold Swing
    Newquay Central
    PartyCandidateVotes%±%
    Liberal Democrats Geoff Brown 322 40.3 -12.0
    Green Steven Slade24630.8N/A
    Conservative Steve Pendleton23229.0N/A
    Majority769.5+5.0
    Turnout 80026.9+9.3
    Liberal Democrats hold Swing
    Newquay Pentire
    PartyCandidateVotes%±%
    Liberal Democrats Joanna Kenny 541 50.2 -14.6
    Conservative Paul Rees53749.8+14.6
    Majority40.4-29.2
    Turnout 1,07832.3+6.7
    Liberal Democrats hold Swing
    Newquay Treloggan
    PartyCandidateVotes%±%
    Conservative Olly Monk 431 48.1 +2.1
    Liberal Democrats Sandy Carter24927.8-26.2
    Independent Margaret North13014.5N/A
    Independent Roy Edwards869.6N/A
    Majority18220.3
    Turnout 89628.5+6.5
    Conservative gain from Liberal Democrats Swing
    Newquay Tretherras
    PartyCandidateVotes%±%
    Conservative Kevin Towill 580 53.6 +18.0
    Liberal Democrats Sally Michael-Jones26532.8-8.3
    Independent Rachel Craze23822.0N/A
    Majority31520.8+18.0
    Turnout 1,08334.9+8.0
    Conservative hold Swing
    Newquay Treviglas
    PartyCandidateVotes%±%
    Liberal Democrats Paul Summers 753 68.2 +43.3
    Conservative Mark Formosa35131.8+4.8
    Majority40236.4
    Turnout 1,10435.0+7.5
    Liberal Democrats gain from UKIP Swing
    Padstow
    PartyCandidateVotes%±%
    Liberal Democrats Richard Buscombe 755 55.7 +2.3
    Conservative Nick Morris49336.4-10.2
    Green Richard Clark1088.0N/A
    Majority26219.3+12.4
    Turnout 1,35642.2+3.7
    Liberal Democrats hold Swing
    Par and St Blazey Gate
    PartyCandidateVotes%±%
    Conservative Jordan Rowse 512 42.4 +11.3
    Liberal Democrats Douglas Scrafton47939.7+0.1
    Labour Ryan Chamberlain21617.9N/A
    Majority332.7
    Turnout 1,20737.7+8.8
    Conservative gain from Liberal Democrats Swing
    Penryn East and Mylor
    PartyCandidateVotes%±%
    Conservative Simon Symons 824 50.3 +27.0
    Labour Faisel Baig31018.9+10.5
    Liberal Democrats Mark Stubbs27616.9-4.8
    Independent Tony Martin22713.9N/A
    Majority51431.4+30.3
    Turnout 1,63738.3+2.7
    Conservative hold Swing
    Penryn West
    PartyCandidateVotes%±%
    Independent Mary May 464 45.8 +3.2
    Green Harry Willoughby24424.1N/A
    Conservative Ellie Phipps15515.3N/A
    Liberal Democrats Billy Burton15114.9-13.0
    Majority22021.7+7.0
    Turnout 1,01427.6+1.4
    Independent hold Swing
    Penwithick and Boscoppa
    PartyCandidateVotes%±%
    Mebyon Kernow Matthew Luke 397 41.7 -1.9
    Conservative Jamie Hanlon38140.0+19.8
    Liberal Democrats Robert Irwin17418.3-17.9
    Majority161.7-5.8
    Turnout 95226.9+3.2
    Mebyon Kernow hold Swing
    Penzance Central
    PartyCandidateVotes%±%
    Labour Cornelius Olivier 694 48.3 +16.9
    Liberal Democrats Penny Young38026.5-1.4
    Conservative Will Elliott25818.0+8.0
    Independent Dick Cliffe1047.2N/A
    Majority31421.8+18.3
    Turnout 1,43645.2+6.6
    Labour hold Swing
    Penzance East
    PartyCandidateVotes%±%
    Labour Tim Dwelly 761 52.2 +11.6
    Liberal Democrats Richard Goedegebuur31521.6-7.4
    Conservative Joseph Bennie19313.2+3.2
    Green Jonathan How857.2-1.4
    UKIP Paul Nicholson584.0-11.7
    Mebyon Kernow Rob Simmons473.2-4.2
    Majority44630.6+29.0
    Turnout 1,45945.3+7.4
    Labour hold Swing
    Penzance Promenade
    PartyCandidateVotes%±%
    Independent Jim McKenna 716 47.7 +14.3
    Labour Tracey Halliday27718.4-1.1
    Conservative Gemma Riley25817.2+9.1
    Liberal Democrats George Daniel20013.3-12.1
    Green William Morris513.4N/A
    Majority43929.3+21.3
    Turnout 1,50248.7+3.0
    Independent hold Swing
    Perranporth
    PartyCandidateVotes%±%
    Independent Michael Callan 778 50.2 -14.7
    Conservative William Rogers59938.7+27.5
    Liberal Democrats David Neale17211.1N/A
    Majority17911.5-40.1
    Turnout 1,54941.6+7.7
    Independent hold Swing
    Pool and Tehidy
    PartyCandidateVotes%±%
    Conservative Philip Desmonde 424 40.9 +11.5
    Liberal Democrats Tom Goldring24623.7N/A
    Labour Val Kelynack22521.7-19.7
    UKIP Michael Pascoe14113.6-15.6
    Majority17817.2
    Turnout 1,03630.4+4.8
    Conservative gain from Labour Swing
    Porthleven and Helston West
    PartyCandidateVotes%±%
    Independent Andrew Wallis 747 52.4 -12.6
    Conservative Danny Williams33423.4+6.0
    Independent Neil Clark26018.2N/A
    Liberal Democrats Jenny Dearlove845.9+2.7
    Majority41329.0-18.6
    Turnout 1,42541.8+9.9
    Independent hold Swing
    Poundstock
    PartyCandidateVotes%±%
    Liberal Democrats Nicky Chopak 999 60.1 +23.0
    Conservative Andrew Ades66440.0+5.8
    Majority33520.1+17.2
    Turnout 1,66345.5+9.6
    Liberal Democrats hold Swing
    Probus, Tregony and Grampound
    PartyCandidateVotes%±%
    Independent Bob Egerton 1,118 70.2 +4.1
    Conservative Richard Pears39124.6+14.5
    Liberal Democrats Steven Webb835.2N/A
    Majority73745.6+0.2
    Turnout 1,59248.5+6.1
    Independent hold Swing
    Rame Peninsular
    PartyCandidateVotes%±%
    Independent George Trubody 1,431 68.1 +40.0
    Conservative John Tivnan46922.3-5.7
    Liberal Democrats Marian Candy2029.6-6.8
    Majority96245.8+45.6
    Turnout 2,10255.6+6.8
    Independent hold Swing
    Redruth Central
    PartyCandidateVotes%±%
    Conservative Barbara Ellenbrook 449 49.8 +9.5
    Labour Deborah Reeve26829.7+4.6
    Independent Sam Rabey12413.8N/A
    Liberal Democrats Alexandra Leete606.7N/A
    Majority18120.1+14.5
    Turnout 90129.5+8.6
    Conservative hold Swing
    Redruth North
    PartyCandidateVotes%±%
    Labour Robert Barnes 439 34.0 0.0
    Independent Lisa Dolley43533.7-7.5
    Conservative Ian Jones34526.7N/A
    Liberal Democrats Moyra Nolan715.5N/A
    Majority40.3
    Turnout 1,29027.1+4.2
    Labour gain from Independent Swing
    Redruth South
    PartyCandidateVotes%±%
    Independent Ian Thomas 345 35.4 -6.0
    Conservative David Eyles33934.8N/A
    Labour Colin Garrick21121.7-16.0
    Liberal Democrats Margaret Thompson798.1N/A
    Majority60.6-3.2
    Turnout 97430.8+3.8
    Independent hold Swing
    Roche
    PartyCandidateVotes%±%
    Independent John Wood 601 46.9 -5.7
    Mebyon Kernow Brian Higman36928.8-10.7
    Conservative Andrew Hannan14010.9+3.0
    UKIP Zachary Bishop1007.8N/A
    Liberal Democrats George Taylor725.6N/A
    Majority23218.1+4.9
    Turnout 1,28241.1+13.3
    Independent hold Swing
    Roseland
    PartyCandidateVotes%±%
    Independent Julian German 876 53.7 -13.8
    Conservative Tim Whitaker47829.3+11.9
    Independent June Bertram21613.2N/A
    Liberal Democrats Charlie Hodgson613.7N/A
    Majority39824.4-25.7
    Turnout 1,63157.1+9.3
    Independent hold Swing
    Saltash East
    PartyCandidateVotes%±%
    Independent Derek Holley57546.1-34.4
    Liberal Democrats Richard Bickford39131.3+24.6
    Conservative Peter Samuels28222.6+9.7
    Majority18414.8-52.8
    Turnout 1,24838.7+6.5
    Independent hold Swing
    Saltash North
    PartyCandidateVotes%±%
    Conservative Sheila Lennox-Boyd 542 47.8 N/A
    Liberal Democrats Christopher Cook32828.9-4.2
    Independent John Brady26323.2+1.9
    Majority21418.9
    Turnout 1,13335.9+10.6
    Conservative gain from Independent Swing
    Saltash South
    PartyCandidateVotes%±%
    Liberal Democrats Hilary Frank 581 53.0 -17.3
    Conservative Eunice Davis29927.2-2.5
    Independent Stephen Thorn21619.7N/A
    Majority28225.8-14.9
    Turnout 1,09634.9+5.3
    Liberal Democrats hold Swing
    Saltash West
    PartyCandidateVotes%±%
    Liberal Democrats Sam Tamlin 659 49.7 -12.8
    Conservative Dorothy Rosekilly43132.5-5.0
    Independent Gloria Challen23517.7N/A
    Majority22817.2-7.8
    Turnout 1,32539.7+10.6
    Liberal Democrats hold Swing
    St Agnes
    PartyCandidateVotes%±%
    Liberal Democrats Pete Mitchell 908 64.1 +11.2
    Conservative Alan Dovey40628.7-5.7
    Labour Damian Heholt1037.3-5.4
    Majority50235.4+16.8
    Turnout 1,41737.9+6.5
    Liberal Democrats hold Swing
    St Austell Bay
    PartyCandidateVotes%±%
    Conservative Tom French 958 58.3 +12.0
    Liberal Democrats Nicky Oxenham42325.7N/A
    Independent Tim Jones17810.8N/A
    UKIP Kevin Solly845.1N/A
    Majority53532.6+29.7
    Turnout 1,64343.99.8
    Conservative hold Swing
    St Austell Bethel
    PartyCandidateVotes%±%
    Liberal Democrats Malcolm Brown 433 35.2 +8.2
    Independent Graham Walker41133.4+7.6
    Conservative Crystal Pearce33527.2+8.2
    TUSC Gill Birchall514.1N/A
    Majority221.8+0.6
    Turnout 1,23033.5+6.0
    Liberal Democrats hold Swing
    St Austell Gover
    PartyCandidateVotes%±%
    Independent Sandra Heyward 390 35.4 -17.9
    Conservative Sunny Krishnan30932.5-4.4
    Liberal Democrats Tim Styles14413.1N/A
    Labour Joey Bishop12511.4-2.7
    UKIP David Mathews766.9N/A
    Green Greg Matthews575.2N/A
    Majority812.9-17.9
    Turnout 1,10134.0+7.9
    Independent hold Swing
    St Austell Poltair
    PartyCandidateVotes%±%
    Liberal Democrats Jackie Bull 509 41.4 +5.8
    Conservative Mike Thompson32226.2+0.8
    Labour Co-op Andrea Lanxon26821.8+3.4
    UKIP Glyn Stephens13010.7N/A
    Majority18715.2+5.0
    Turnout 1,22936.5+8.9
    Liberal Democrats hold Swing
    St Blazey
    PartyCandidateVotes%±%
    Conservative Pauline Giles 484 48.3 +34.7
    Liberal Democrats Roy Taylor31131.0-9.1
    Labour Stuart Wheeler20720.7-3.4
    Majority17317.3
    Turnout 1,00243.5+8.5
    Conservative gain from Liberal Democrats Swing
    St Buryan
    PartyCandidateVotes%±%
    Liberal Democrats Helen Hawkins 604 33.7 +26.4
    Conservative Adrian Semmens55531.0-9.5
    Independent Bill Maddern33818.9N/A
    Labour Jane Dunsmuir20611.8-1.9
    UKIP Mary Smith824.6N/A
    Majority492.7
    Turnout 1,79050.4+9.5
    Liberal Democrats gain from Conservative Swing
    St Cleer
    PartyCandidateVotes%±%
    Liberal Democrats Philip Eddy 829 51.6 +19.4
    Conservative Clive Sargeant52032.4+12.4
    Labour Martin Menear1408.7N/A
    UKIP David Lucas1177.3-16.9
    Majority30919.2+11.2
    Turnout 1,60644.1+4.5
    Liberal Democrats hold Swing
    St Columb Major
    PartyCandidateVotes%±%
    Independent William Wills 862 65.0 N/A
    Conservative John Bell36527.5+8.3
    Liberal Democrats Jack Dixon1007.5-10.7
    Majority49737.5
    Turnout 1,32736.0+7.7
    Independent hold Swing
    St Dennis and Nanpean
    PartyCandidateVotes%±%
    Independent Fred Greenslade 363 37.2 -35.2
    Independent Nick Edmunds27127.8N/A
    Independent Julia Clarke19920.4N/A
    Conservative Barbara Hannan10310.6+4.6
    Liberal Democrats Sandra Preston394.0N/A
    Majority929.4-41.5
    Turnout 97529.3+8.3
    Independent hold Swing
    St Dominick, Harrowbarrow and Kelly Bray
    PartyCandidateVotes%±%
    Conservative Jim Flashman 690 40.2 +4.0
    Liberal Democrats Matthew Waterworth51730.1+19.6
    Mebyon Kernow Mark Smith36521.3+10.8
    Labour Alistair Tinto1438.3N/A
    Majority17310.1+2.1
    Turnout 1,71549.4+11.4
    Conservative hold Swing
    St Enoder
    PartyCandidateVotes%±%
    Mebyon Kernow Dick Cole 1,090 83.4 -3.5
    Conservative Rachel Andrews14310.9N/A
    Liberal Democrats Kate Martin745.7N/A
    Majority94772.5-1.3
    Turnout 1,30736.9+9.9
    Mebyon Kernow hold Swing
    St Germans and Landulph
    PartyCandidateVotes%±%
    Liberal Democrats Jesse Foot 633 37.3 +9.9
    Conservative Daniel Pugh62837.0+5.5
    Independent Chris Wilton25815.2N/A
    Independent Mervyn Richard Ellis17810.5-2.2
    Majority50.3
    Turnout 1,69749.0+11.1
    Liberal Democrats gain from Conservative Swing
    St Issey and St Tudy
    PartyCandidateVotes%±%
    Conservative Steven Rushworth 883 57.6 N/A
    Liberal Democrats Julia Fletcher65042.4-10.9
    Majority23315.2
    Turnout 1,53342.5+9.6
    Conservative gain from Liberal Democrats Swing
    St Ives East
    PartyCandidateVotes%±%
    Conservative Richard Robinson 565 41.6 +14.8
    Green Tim Andrews47835.2-2.1
    Labour Pedyr Prior15711.6+6.1
    Liberal Democrats Caroline White916.7+4.2
    UKIP William Guppy674.9-8.6
    Majority876.4
    Turnout 1,26349.2+8.0
    Conservative gain from Green Swing
    St Ives West
    PartyCandidateVotes%±%
    Independent Andrew Mitchell 446 34.4 +6.5
    Conservative Kevin Hughes23618.2+7.0
    Independent Colenso Nicholls23518.1N/A
    Labour Rex Henry20015.4+5.3
    Liberal Democrats Pauline Attwood1189.1+3.1
    UKIP Dan Hall634.9-12.7
    Majority21016.2+15.6
    Turnout 1,29840.6+6.5
    Independent hold Swing
    St Just In Penwith
    PartyCandidateVotes%±%
    Liberal Democrats Sue James 1,184 59.4 +22.6
    Conservative William McFadden57929.1+22.3
    Labour Louise Paine22911.5-4.5
    Majority60530.3+14.9
    Turnout 1,56752.5+11.3
    Liberal Democrats hold Swing
    St Keverne and Meneage
    PartyCandidateVotes%±%
    Independent Julian Rand 753 44.1 N/A
    Conservative Paul Parfitt72742.5+2.0
    Liberal Democrats Wendy Gauntlett22913.4N/A
    Majority261.6
    Turnout 1,70942.8+4.5
    Independent gain from Conservative Swing
    St Mawgan and Colan
    PartyCandidateVotes%±%
    Conservative John Fitter 728 61.4 -14.7
    Independent William Corbett27723.4N/A
    Liberal Democrats Anne Chappell18115.3N/A
    Majority45138.0-14.1
    Turnout 1,18636.2+7.9
    Conservative hold Swing
    St Mewan
    PartyCandidateVotes%±%
    Conservative Cherilyn Williams 713 56.8 +24.6
    Liberal Democrats Robin Teverson54343.2+12.1
    Majority17013.6
    Turnout 1,25641.2+8.5
    Conservative gain from Independent Swing
    St Minver and St Endellion
    PartyCandidateVotes%±%
    Conservative Carole Mould 692 55.5 +14.9
    Independent Andy Penny39431.6-10.5
    Liberal Democrats John Leach16112.9-4.3
    Majority29823.9
    Turnout 1,24750.5+8.5
    Conservative gain from Independent Swing
    St Stephen-In-Brannel
    PartyCandidateVotes%±%
    Conservative Mike McLening 484 43.8 N/A
    Liberal Democrats David Simpson26023.5N/A
    Independent Keith Wonnacott19417.6N/A
    Mebyon Kernow Jerry Jefferies16715.1N/A
    Majority22420.3
    Turnout 1,10530.0+4.4
    Conservative gain from Independent Swing
    St Teath and St Breward
    PartyCandidateVotes%±%
    Liberal Democrats Dominic Fairman 994 69.9 +38.1
    Conservative John Phillips34824.5+7.8
    Labour David Garrigan815.7N/A
    Majority64645.4
    Turnout 1,42344.7+7.0
    Liberal Democrats gain from Independent Swing
    Stokeclimsland
    PartyCandidateVotes%±%
    Independent Neil Burden 1,015 75.4 +13.4
    Liberal Democrats Paul Mannix21916.3+8.6
    Labour Carl Bradley-Hughes1128.3N/A
    Majority79659.1+17.9
    Turnout 1,30643.7+1.1
    Independent hold Swing
    Threemilestone and Gloweth
    PartyCandidateVotes%±%
    Liberal Democrats Dulcie Tudor 502 40.0 +24.4
    Conservative Steve Horne38130.4+11.4
    Independent Tim Deeble37129.6+3.4
    Majority1219.6
    Turnout 1,25436.8+7.0
    Liberal Democrats gain from Independent Swing
    Tintagel
    PartyCandidateVotes%±%
    Conservative George Jordan 611 40.2 +24.3
    Liberal Democrats John Lamb59939.4-17.7
    Independent Peter Dyer31020.4N/A
    Majority120.8
    Turnout 1,52048.1+12.0
    Conservative gain from Liberal Democrats Swing
    Torpoint East
    PartyCandidateVotes%±%
    Conservative Gary Davis 627 53.0 +23.9
    Liberal Democrats Brian Hobbs45838.7-6.5
    UKIP Mark Small998.4-17.3
    Majority16914.3
    Turnout 1,18439.9+6.7
    Conservative gain from Liberal Democrats Swing
    Torpoint West
    PartyCandidateVotes%±%
    Conservative Michael Crago 464 41.5 -41.8
    Independent Mike Pearn28925.9N/A
    Liberal Democrats Paul Goodall23521.0+4.3
    UKIP Rob White12911.5N/A
    Majority17515.6-51.0
    Turnout 1,11737.4+12.5
    Conservative hold Swing
    Trelawny
    PartyCandidateVotes%±%
    Conservative Richard Pugh 967 50.3 +18.2
    Liberal Democrats Jim Candy95549.7+6.3
    Majority120.6
    Turnout 1,92251.3+9.5
    Conservative gain from Liberal Democrats Swing
    Truro Boscawen
    PartyCandidateVotes%±%
    Independent Bert Biscoe 444 29.1 -23.5
    Conservative Jacqui Butler41327.1+9.6
    Liberal Democrats Maurice Vella36223.7+13.9
    Labour Chay Morris15510.2+0.5
    Green Lindsay Southcombe15210.0-0.4
    Majority312.0-33.1
    Turnout 1,52637.8+6.9
    Independent hold Swing
    Truro Redannick
    PartyCandidateVotes%±%
    Liberal Democrats Rob Nolan 887 59.3 +6.4
    Conservative Jan Allen44429.7+5.9
    Labour Kath Morgan16611.1+2.9
    Majority44329.6+0.4
    Turnout 1,49742.1+5.4
    Liberal Democrats hold Swing
    Truro Tregolls
    PartyCandidateVotes%±%
    Independent Loic Rich 1,116 75.5 +34.6
    Conservative Karlene Stokes25317.1+0.9
    Liberal Democrats Scott Bennett10912.4-11.9
    Majority86358.4+36.7
    Turnout 1,47840.7+9.6
    Independent hold Swing
    Truro Trehaverne
    PartyCandidateVotes%±%
    Conservative David Harris 623 42.0 -2.7
    Liberal Democrats Lucy Jones46431.3+25.4
    Labour Stuart Roden31921.5+14.8
    Green Martha Green765.1-1.8
    Majority15910.7-11.9
    Turnout 1,48238.6+4.9
    Conservative hold Swing
    Wadebridge East
    PartyCandidateVotes%±%
    Liberal Democrats Steve Knightley 586 45.9 +21.0
    Conservative Brian Aubone Bennetts50139.2+27.9
    Labour Co-op Adrian Jones19114.9+2.8
    Majority856.7
    Turnout 1,27842.0-2.2
    Liberal Democrats gain from Independent Swing
    Wadebridge West
    PartyCandidateVotes%±%
    Liberal Democrats Karen McHugh 605 49.1 +24.8
    Conservative Lindsay Richards45236.7-28.8
    Green Amanda Pennington967.8N/A
    Labour Neil Glover806.5-3.7
    Majority15312.4
    Turnout 1,23341.9+0.7
    Liberal Democrats gain from Conservative Swing

    Related Research Articles

    <span class="mw-page-title-main">North Cornwall (UK Parliament constituency)</span> UK Parliamentary constituency since 1918

    North Cornwall is a constituency represented in the House of Commons of the UK Parliament by Scott Mann, a Conservative since the 2015 general election. Like all British constituencies, the seat elects one Member of Parliament (MP) by the first past the post system of election at least every five years. The seat was created in 1918. Since 1950, the constituency has been held by MPs from either the Conservative Party or the Liberal Democrats.

    <span class="mw-page-title-main">Dan Rogerson</span> Cornish-British politician

    Daniel John Rogerson is a Cornish-British Liberal Democrat politician. He was the Member of Parliament (MP) for North Cornwall from the 2005 general election until his defeat at the 2015 general election. In October 2013, he became the Liberal Democrat Minister at the Department for Environment, Food and Rural Affairs, holding the office until losing his Parliamentary seat to Conservative candidate Scott Mann.

    <span class="mw-page-title-main">Cornwall Council</span> Unitary authority for Cornwall, England

    Cornwall Council, known until 2009 as Cornwall County Council, is the unitary authority which governs the district of Cornwall, which covers the majority of the ceremonial county of the same name in the South West of England. The council has had a Conservative Party majority since the 2021 local elections. Its headquarters is Lys Kernow in Truro.

    <span class="mw-page-title-main">2009 Somerset County Council election</span>

    An election to Somerset County Council took place on 4 June 2009 as part of the 2009 United Kingdom local elections, having been delayed from 7 May, to coincide with elections to the European Parliament. The result brought to an end 16 years of Liberal Democrat rule to a Conservative controlled administration. 58 councillors were elected from various electoral divisions, which returned one county councillor each. Members were elected by the first-past-the-post voting system for a four-year term of office. This was the last election before the number of seats was cut to 55 for the 2013 election. With a total of 58 seats being reduced to 55 for the next election.

    <span class="mw-page-title-main">2012 City of Lincoln Council election</span> UK municipal election

    The 2012 City of Lincoln Council election took place on 3 May 2012 to elect one-third of the members of City of Lincoln Council in Lincolnshire, England, for a 4-year term of office. This was on the same day as other 2012 United Kingdom local elections.

    <span class="mw-page-title-main">2013 United Kingdom local elections</span>

    The 2013 United Kingdom local elections took place on Thursday 2 May 2013. Elections were held in 35 English councils: all 27 non-metropolitan county councils and eight unitary authorities, and in one Welsh unitary authority. Direct mayoral elections took place in Doncaster and North Tyneside. These elections last took place on the 4 June 2009 at the same time as the 2009 European Parliament Elections, except for County Durham, Northumberland and the Anglesey where elections last took place in 2008.

    <span class="mw-page-title-main">2013 Hampshire County Council election</span>

    An election to Hampshire County Council took place on 2 May 2013 as part of the 2013 United Kingdom local elections. 78 councillors were elected from 75 electoral divisions, which returned either one or two county councillors each by first-past-the-post voting for a four-year term of office. The electoral divisions were the same as those of the previous election in 2009. No elections were held in Portsmouth and Southampton, which are unitary authorities outside the area covered by the County Council. The election saw the Conservative Party retain overall control of the council, with a reduced majority of five councillors.

    <span class="mw-page-title-main">2013 Cambridgeshire County Council election</span>

    An election to Cambridgeshire County Council took place on 2 May 2013 as part of the 2013 United Kingdom local elections. 69 councillors were elected from 60 electoral divisions, which returned either one or two county councillors each by first-past-the-post voting for a four-year term of office. The electoral divisions were the same as those used at the previous election in 2009. No elections were held in Peterborough, which is a unitary authority outside the area covered by the County Council. The election saw the Conservative Party lose overall control of the council.

    <span class="mw-page-title-main">2013 Durham County Council election</span>

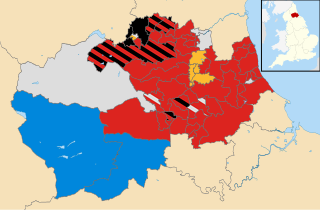
    An election to Durham County Council took place on 2 May 2013 as part of the 2013 United Kingdom local elections. Following a boundary review, 126 councillors were elected from 63 electoral divisions which returned either one, two or three councillors each by first-past-the-post voting for a four-year term of office. The previous election took place in 2008 in advance of the council becoming a unitary authority after the 2009 changes to local government. The election saw the Labour Party increase their majority on the council.

    <span class="mw-page-title-main">2013 Surrey County Council election</span>

    The Surrey County Council election, 2013 took place on 2 May 2013 as part of the 2013 United Kingdom local elections. 81 electoral divisions returned one county councillor each by first-past-the-post voting for a four-year term of office. Following a review, new electoral division boundaries were introduced for this election, increasing the number of councillors from 80 to 81.

    <span class="mw-page-title-main">2013 Gloucestershire County Council election</span>

    Elections to Gloucestershire County Council took place on 2 May 2013 as part of the 2013 United Kingdom local elections. 53 electoral divisions elected one county councillor each by first-past-the-post voting for a four-year term of office. No elections were held in South Gloucestershire, which is a unitary authority outside the area covered by the County Council.

    <span class="mw-page-title-main">2013 Essex County Council election</span>

    An election to Essex County Council took place on 2 May 2013 as part of the 2013 United Kingdom local elections. 75 councillors were elected from 70 electoral divisions, which returned either one or two county councillors each by first-past-the-post voting for a four-year term of office. The electoral divisions were the same as those used at the previous election in 2009. No elections were held in Thurrock or Southend-on-Sea, which are unitary authorities outside the area covered by the County Council.

    <span class="mw-page-title-main">2013 Cornwall Council election</span>

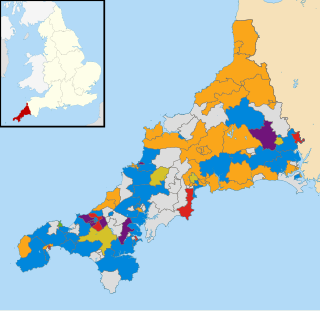
    The Cornwall Council election, 2013, was an election for all 123 seats on the council. Cornwall Council is a unitary authority that covers the majority of the ceremonial county of Cornwall, with the exception of the Isles of Scilly which have an independent local authority. The elections took place concurrently with other local elections across England and Wales.

    <span class="mw-page-title-main">2013 Dorset County Council election</span>

    An election to Dorset County Council took place on 2 May 2013 as part of the United Kingdom local elections. 45 councillors were elected from 42 electoral divisions, which returned either one or two county councillors each by first-past-the-post voting for a four-year term of office. The electoral divisions were the same as those used at the previous election in 2009. No elections were held in Bournemouth or Poole, which are unitary authorities outside the area covered by the County Council. The election saw the Conservative Party maintain overall control of the council.

    <span class="mw-page-title-main">2016 Exeter City Council election</span>

    The 2016 Exeter City Council election took place on 5 May 2016, to elect members of Exeter City Council in England. Following boundary changes, the entire council was up for election, and all 13 wards were contested, each electing three councillors. The election was held concurrently with other local elections held in England on the 5 May.

    <span class="mw-page-title-main">2017 United Kingdom local elections</span>

    The 2017 United Kingdom local elections were held on Thursday 4 May 2017. Local elections were held across Great Britain, with elections to 35 English local authorities and all councils in Scotland and Wales.

    <span class="mw-page-title-main">2021 Cornwall Council election</span>

    The 2021 Cornwall Council election took place on 6 May 2021 as part of the 2021 United Kingdom local elections. It was contested under new division boundaries as the number of seats on the council falls from 123 to 87.

    <span class="mw-page-title-main">Bodmin St Petroc (electoral division)</span> Former electoral division of Cornwall in the UK

    Bodmin St Petroc was an electoral division of Cornwall in the United Kingdom which returned one member to sit on Cornwall Council between 2013 and 2021. It was abolished at the 2021 local elections, being succeeded by the larger Bodmin St Petroc's.

    <span class="mw-page-title-main">Bodmin St Petroc's (electoral division)</span> Electoral division of Cornwall in the UK

    Bodmin St Petroc's is an electoral division of Cornwall in the United Kingdom which returns one member to sit on Cornwall Council. It was created at the 2021 local elections, being preceded by the smaller Bodmin St Petroc division. The current councillor is Leigh Frost, a Liberal Democrat.

    <span class="mw-page-title-main">2022 Cardiff Council election</span> Local election in Wales

    The 2022 Cardiff Council election took place on 5 May 2022 to elect 79 members to Cardiff Council. On the same day, elections were held to the other 21 local authorities and to community councils in Wales as part of the 2022 Welsh local elections.

    References

    1. "Upcoming elections & referendums". Electoral Commission. Archived from the original on 5 May 2018. Retrieved 15 September 2016.
    2. 1 2 "Cornwall Council and Parish and Town Council Elections - 4 May 2017: Bodmin St Petroc Division – Poll Countermanded". Cornwall Council. Retrieved 21 June 2017.
    3. "Unitary status agreed for council". BBC News Online . 5 December 2007. Retrieved 5 May 2013.
    4. Kennally, Kate (5 April 2017). "STATEMENT AS TO PERSONS NOMINATED" (PDF). cornwall.gov.uk. Cornwall Council. Archived from the original (PDF) on 5 November 2017.
    5. Kennally, Kate (5 April 2017). "STATEMENT AS TO PERSONS NOMINATED" (PDF). cornwall.gov.uk. Cornwall Council. Archived from the original (PDF) on 5 November 2017.
    6. "The Representation of the People (Form of Canvass) (England and Wales) Regulations 2006, Schedule Part 1". Legislation.gov.uk. 13 October 2011. Retrieved 18 April 2012.
    7. "I have two homes. Can I register at both addresses?". The Electoral Commission. Archived from the original on 7 May 2019. Retrieved 5 January 2011.
    8. "Cornwall Council election results 2017". Cornwall Council. 5 May 2017. Retrieved 10 May 2017.
    9. Andrew Teale. "Local Election Results 2017 - Cornwall". Local Elections Archive Project. Retrieved 24 October 2019.
    10. "Cornwall Council elections - Thursday, 4th May, 2017". Election results by electoral divisions. Cornwall Council. 4 May 2017. Retrieved 23 June 2017.
    11. "Cornwall Council elections - Thursday, 2nd May, 2013". Election results by electoral divisions. Cornwall Council. 2 May 2013. Retrieved 30 December 2013.
    12. "DECLARATION OF RESULT OF POLL - Bodmin St Petroc Electoral Division" (PDF). Cornwall Council. 9 June 2017. Retrieved 8 March 2018.