2017 Wiltshire Council election

Last updated

2017 Wiltshire Council election
County Flag of Wiltshire.svg
  2013 4 May 2017 (2017-05-04) 2021  

All 98 seats to Wiltshire Council
50 seats needed for a majority
 First partySecond party
  Official portrait of Baroness Scott of Bybrook crop 2.jpg
LD
Leader Baroness Scott of Bybrook Glenis Ansell
Party Conservative Liberal Democrats
Leader's seatBy BrookCalne North
(defeated)
Last election58 seats, 42.8%27 seats, 20.3%
Seats won6820
Seat changeIncrease2.svg 10Decrease2.svg 7
Popular vote74,25738,217
Percentage52.0%27.0%
SwingIncrease2.svg 9.2%Increase2.svg 6.7%

 Third partyFourth party
 
Ind
Lab
LeaderErnie ClarkRicky Rogers
Party Independent Labour
Leader's seatHilpertonSalisbury Bemerton
Last election8 seats, 10.6%4 seats, 10.2%
Seats won73
Seat changeDecrease2.svg 1Decrease2.svg 1
Popular vote12,09313,152
Percentage8.5%9.2%
SwingDecrease2.svg 2.1%Decrease2.svg 1.0%

Wiltshire UK local election 2017 map.svg
Map showing the composition of Wiltshire Council following the election. Blue showing Conservative, Red showing Labour, Yellow showing Liberal Democrats and Grey showing Independents.

Council control before election

Conservative

Council control after election

Conservative

The 2017 Wiltshire Council election took place on 4 May 2017 as part of the 2017 local elections in the United Kingdom. [1] All 98 councillors were elected from electoral divisions which returned one councillor each by first-past-the-post voting for a four-year term of office.

Contents

Composition before election

Elected in 2013Before election
PartySeatsPartySeats
Conservative 58 Conservative 62
Liberal Democrats 27 Liberal Democrats 22
Independent 8 Independent 10
Labour 4 Labour 4
UKIP 1 UKIP 1

Uncontested election

At the close of nominations on 4 April 2017, there was one electoral division in which only one candidate had come forward: John Smale (Conservative), in Bulford, Allington and Figheldean. He was thus elected unopposed. [2]

Results summary

Wiltshire Council election, 2017 [3]
PartySeatsGainsLossesNet gain/lossSeats %Votes %Votes+/−
  Conservative 68133+1069.451.965,58417,003
  Liberal Democrats 20310-720.426.032,8129812
  Labour 301-13.19.111,839314
  Independent 723-17.49.111,551-43
  Green 000002.13,0032323
  Devizes Guardians 000000.7905-494
  UKIP 001–100.5685-15,956
 Together We Can Reform000000.02121

    Electoral division results

    The electoral division results listed below are based on the changes from the 2013 elections, not taking into account any party defections or by-elections.

    Aldbourne and Ramsbury

    Aldbourne and Ramsbury
    PartyCandidateVotes%±%
    Conservative James Sheppard 1,056 67.4 +3.5
    Liberal Democrats Fran Bishop53817.8n/a
    Labour Jason Steven Haythornwaite1479.4n/a
    Green Brian Roy Utton1475.4n/a
    Majority77849.6
    Turnout 1,56838.8+1.5
    Conservative hold Swing

    Alderbury and Whiteparish

    Alderbury and Whiteparish
    PartyCandidateVotes%±%
    Conservative Richard Britton 825 59.4 +2.8
    Independent Gideon Bruce Aymes34224.6n/a
    Liberal Democrats John Phillip Edrich1188.5n/a
    Labour Kim Eleanor Glennon-Alty1057.6-3.7
    Majority48334.8
    Turnout 1,39441.0+5.0
    Conservative hold Swing

    Amesbury East

    Amesbury East
    PartyCandidateVotes%±%
    Conservative Robert Alexander Yuill 669 48.2 +3.5
    Liberal Democrats Helen Martina Holdsworth43431.3n/a
    UKIP Rhod Evans1188.5-33.8
    Labour Julie Anne Martingale846.1-6.9
    Majority23516.9
    Turnout 1,38929.7
    Conservative hold Swing

    Note: Jamie Paul Capp had previously gained the seat for the Liberal Democrats in a 2016 by-election.

    Amesbury West

    Amesbury West
    PartyCandidateVotes%±%
    Conservative Fred Westmoreland 874 74.2 +37.2
    Labour Tom Corbin16814.3+3.0
    Liberal Democrats Gerard Francis Wynn13611.5n/a
    Majority70658.9
    Turnout 1,19632.3+0.2
    Conservative hold Swing

    Bourne and Woodford Valley

    Bourne and Woodford Valley
    PartyCandidateVotes%±%
    Conservative Mike Hewitt 983 65.5 -6.4
    Liberal Democrats Dineen Marianne Hopper36424.2n/a
    Labour Lindsey Elizabeth Bellringer15510.3-17.8
    Majority61941.3
    Turnout 1,50943.7+8.7
    Conservative hold Swing

    Box and Colerne

    Box and Colerne
    PartyCandidateVotes%±%
    Liberal Democrats Brian George Felton Matthew 979 52.4 +15.2
    Conservative Sheila Gladys Parker81843.8+0.8
    Labour Peter Neil Baldrey703.8-5.2
    Majority1618.6
    Turnout 1,86749.2+8.1
    Liberal Democrats gain from Conservative Swing

    Bradford-on-Avon North

    Bradford-on-Avon North
    PartyCandidateVotes%±%
    Liberal Democrats Jim Lynch 1,262 59.8 +13.1
    Conservative Pam Hyde85040.3+20.1
    Majority41219.5
    Turnout 2,14556.5+14.9
    Liberal Democrats hold Swing

    Bradford-on-Avon South

    Bradford-on-Avon South
    PartyCandidateVotes%±%
    Liberal Democrats Sarah Gibson 1,197 55.8 +7.3
    Conservative Clive Alfred Samuel Hilton72433.8+11.4
    Labour Rosie Macgregor22410.4-3.4
    Majority47322.0
    Turnout 2,15752.8+8.9
    Liberal Democrats hold Swing

    Brinkworth

    Brinkworth
    PartyCandidateVotes%±%
    Conservative Toby Russell Sturgis 1,083 65.4 +6.2
    Liberal Democrats Christopher Hugh Tuite57234.6+20.3
    Majority51130.8
    Turnout 1,66745.2+7.3
    Conservative hold Swing

    Bromham, Rowde and Potterne

    Bromham, Rowde and Potterne
    PartyCandidateVotes%±%
    Conservative Anna Louise Cuthbert 823 59.3 +3.8
    Independent Philip Alfred Brown24217.4n/a
    Liberal Democrats Ralph Andre Frederick Elia1389.9n/a
    Labour Dianne Mary Gilpin1067.6n/a
    Green Margaret Ursula Green795.7n/a
    Majority58141.9
    Turnout 1,39436.1-38.4
    Conservative hold Swing

    Note: Anna Louise Cuthbert had previously held the seat for the Conservative Party in a 2015 by-election.

    Bulford, Allington and Figheldean

    Bulford, Allington and Figheldean
    PartyCandidateVotes%±%
    Conservative John Frederick Smale unopposed n/a n/a
    Conservative hold

    Burbage and The Bedwyns

    Burbage and The Bedwyns
    PartyCandidateVotes%±%
    Conservative Stuart John Kennedy Wheeler 1,021 68.0 -14.6
    Liberal Democrats Parvis Jamieson21614.4n/a
    Labour John Brian Thornton1348.9-8.5
    Green Emma Jane Clarissa Dawnay1308.7n/a
    Majority80553.6
    Turnout 1,50438.8+7.2
    Conservative hold Swing

    By Brook

    By Brook
    PartyCandidateVotes%±%
    Conservative Jane Scott 1,032 71.5 +5.5
    Liberal Democrats Mary Geraldine Sheila Finch22315.5+2.8
    Green Phillip Christopher Chamberlain1006.9n/a
    Labour Stephen Charles Wheeler886.1n/a
    Majority80956.0
    Turnout 1,44640.3+4.7
    Conservative hold Swing

    Note: Jane Scott retired in February 2020. [4]

    Calne Central

    Calne Central
    PartyCandidateVotes%±%
    Liberal Democrats Ian Leslie Thorn 754 51.6 +13.5
    Conservative Howard Robin Marshall56238.5+2.1
    Labour John Boaler1449.9n/a
    Majority19213.1
    Turnout 1,46242.6+9.5
    Liberal Democrats hold Swing

    Calne Chilvester and Abberd

    Calne Chilvester and Abberd
    PartyCandidateVotes%±%
    Conservative Tony Trotman 683 50.4 +3.9
    Liberal Democrats Robert Matthew Merrick41730.8+6.2
    Labour Mike MacGregor-Fairlie25418.8n/a
    Majority26619.6
    Turnout 1,35634.4+7.6
    Conservative hold Swing

    Calne North

    Calne North
    PartyCandidateVotes%±%
    Conservative Tom Rounds 459 45.4 +11.1
    Liberal Democrats Glenis Jean Ansell38037.6-2.4
    Labour Jon Fisher17217.0n/a
    Majority797.8
    Turnout 1,01430.8+6.4
    Conservative gain from Liberal Democrats Swing

    Calne Rural

    Calne Rural
    PartyCandidateVotes%±%
    Conservative Christine Crisp 1,092 68.2 +21.0
    Liberal Democrats Rob Clarke35622.2+13.2
    Labour Tom Morris1549.6n/a
    Majority73645.8
    Turnout 1,60745.5+4.7
    Conservative hold Swing

    Calne South and Cherhill

    Calne South and Cherhill
    PartyCandidateVotes%±%
    Conservative Alan Kenneth Hill 892 65.1 +18.5
    Liberal Democrats Declan Alexander William Boore31222.8-5.4
    Labour John Alan Bennett16712.2n/a
    Majority58045.8
    Turnout 1,38036.6+0.4
    Conservative hold Swing

    Chippenham Cepen Park and Derriads

    Chippenham Cepen Park and Derriads
    PartyCandidateVotes%±%
    Conservative Peter John Hutton 901 68.0 +22.3
    Liberal Democrats Christopher Leonard Norris27020.4+11.1
    Labour Ian Shaun Flower15511.7-3.2
    Majority63147.3
    Turnout 1,33339.7+6.3
    Conservative hold Swing

    Chippenham Cepen Park and Redlands

    Chippenham Cepen Park and Redlands
    PartyCandidateVotes%±%
    Conservative Andy Phillips 700 63.4 +13.4
    Liberal Democrats Conor Melvin26824.3+14.4
    Labour Jeremy Richard Griffin Comerford13712.4-4.8
    Majority43239.1
    Turnout 1,10631.4+2.3
    Conservative hold Swing

    Chippenham Hardenhuish

    Chippenham Hardenhuish
    PartyCandidateVotes%±%
    Conservative Melody Rhonda Thompson 669 46.7 +27.5
    Liberal Democrats Daniel Andrew Webb63444.3+14.3
    Labour David Charles Barter1288.9+2.2
    Majority352.4
    Turnout 1,44041.5+4.4
    Conservative gain from Liberal Democrats Swing

    Note: Melody Rhonda Thompson had previously gained the seat for the Conservative Party in a 2015 by-election.

    Chippenham Hardens and England

    Chippenham Hardens and England
    PartyCandidateVotes%±%
    Liberal Democrats Bill Douglas 662 54.9 +17.3
    Conservative Robert John Bradfield Giles54345.1+22.5
    Majority1199.7
    Turnout 1,22337.1+6.2
    Liberal Democrats hold Swing

    Chippenham Lowden and Rowden

    Chippenham Lowden and Rowden
    PartyCandidateVotes%±%
    Liberal Democrats Ross Henning 539 40.1 +7.9
    Independent David Keith Poole40630.2n/a
    Conservative Paul Duncan Newman40029.7+9.5
    Majority1339.8
    Turnout 1,35337.0+6.7
    Liberal Democrats hold Swing

    Chippenham Monkton

    Chippenham Monkton
    PartyCandidateVotes%±%
    Independent Nick Murry 983 62.4 n/a
    Conservative Caroline Veronica Ramsey30019.0+6.7
    Liberal Democrats Matt Harding29318.6-51.7
    Majority68343.1
    Turnout 1,58552.2+5.8
    Independent gain from Liberal Democrats Swing

    Chippenham Pewsham

    Chippenham Pewsham
    PartyCandidateVotes%±%
    Liberal Democrats Clare Morforwyn Cape 740 51.5 +3.6
    Conservative Teresa Marie Hutton69648.5+23.9
    Majority443.0
    Turnout 1,44842.0+10.6
    Liberal Democrats hold Swing

    Chippenham Queens and Sheldon

    Chippenham Queens and Sheldon
    PartyCandidateVotes%±%
    Conservative Ashley O'Neill 817 60.4 +27.9
    Liberal Democrats Desna Barbara Allen53639.6+4.4
    Majority28120.7
    Turnout 1,35741.3+4.0
    Conservative gain from Liberal Democrats Swing

    Corsham Pickwick

    Corsham Pickwick
    PartyCandidateVotes%±%
    Liberal Democrats Ruth Mary Catherine Hopkinson 753 50.3 +36.7
    Conservative Alan MacRae60140.2+4.4
    Labour William Stephen Gilbert1429.5-12.4
    Majority15210.1
    Turnout 1,50039.8+8.8
    Liberal Democrats gain from Conservative Swing

    Corsham Town

    Corsham Town
    PartyCandidateVotes%±%
    Conservative Philip Hardman Whalley 980 52.5 +12.8
    Liberal Democrats Kelly Ann Duckhouse74640.0+6.5
    Labour Steve Abbott1417.6+0.3
    Majority23412.5
    Turnout 1,86849.0+5.7
    Conservative hold Swing

    Corsham Without and Box Hill

    Corsham Without and Box Hill
    PartyCandidateVotes%±%
    Conservative Ben Anderson 1,168 69.4 +12.8
    Green Tina Maria Johnston51430.6n/a
    Majority65438.6
    Turnout 1,69341.3+3.0
    Conservative hold Swing

    Cricklade and Latton

    Cricklade and Latton
    PartyCandidateVotes%±%
    Liberal Democrats Bob Jones 923 48.8 -7.8
    Conservative Peter Anthony Colmer88346.7+3.3
    Labour Graham William Davies854.5n/a
    Majority402.1
    Turnout 1,89448.7+7.1
    Liberal Democrats hold Swing

    Devizes and Roundway South

    Devizes and Roundway South
    PartyCandidateVotes%±%
    Conservative Simon David Jacobs 613 40.2 +6.0
    Devizes Guardians Chris Greenwood29419.3-10.7
    Independent Chris Callow17711.6n/a
    Independent Ian Richard Porter Hopkins16811.0-5.6
    Labour Ivor Llewellyn Blackmore1469.6-3.6
    Liberal Democrats James Thomas Melville Kay1288.4+2.4
    Majority31920.8
    Turnout 1,53244.4+3.7
    Conservative hold Swing

    Devizes East

    Devizes East
    PartyCandidateVotes%±%
    Conservative Peter Evans 483 42.8 -2.0
    Devizes Guardians Jane Mary Burton27624.5-7.8
    Liberal Democrats Alan Charles Rankin19217.0n/a
    Labour Laura Kate Naylor17715.7-7.2
    Majority20718.2
    Turnout 1,13536.7+5.5
    Conservative hold Swing

    Devizes North

    Devizes North
    PartyCandidateVotes%±%
    Conservative Sue Evans 579 46.8 +4.9
    Devizes Guardians Nigel Denys Carter 33527.1-9.4
    Green Simon Charles Thompson17113.8n/a
    Labour Patricia Baxter15312.4-9.2
    Majority24419.6
    Turnout 1,24538.7+5.5
    Conservative hold Swing

    Downton and Ebble Valley

    Downton and Ebble Valley
    PartyCandidateVotes%±%
    Conservative Richard John Clewer 944 64.7 +2.6
    Green Robert William Steel20814.3n/a
    Labour Ben Wynn18812.9n/a
    Liberal Democrats Harry David Ashcroft1208.2n/a
    Majority73650.3
    Turnout 1,46439.0+0.6
    Conservative hold Swing

    Durrington and Larkhill

    Durrington and Larkhill
    PartyCandidateVotes%±%
    Independent Graham Wright 1,384 80.1 +1.7
    Conservative Jan Burns34520.0-1.6
    Majority1,03959.8
    Turnout 1,73834.9+5.3
    Independent hold Swing

    Note: Graham Wright had previously been elected in 2013 for the Liberal Democrats. The change in his voteshare shown is the change from the voteshare he won as a Liberal Democrat in 2013.

    Ethandune

    Ethandune
    PartyCandidateVotes%±%
    Conservative Jerry Wickham1,05971.8+11.1
    Liberal Democrats Anne Elizabeth Ball41628.2+3.6
    Majority64343.1
    Turnout 1,49241.3+5.6
    Conservative hold Swing

    Note: Jerry Wickham had previously held the seat for the Conservatives in a 2014 by-election.

    Fovant and Chalke Valley

    Fovant and Chalke Valley
    PartyCandidateVotes%±%
    Conservative Jose Green 971 65.0 n/a
    Independent William Donald Keir Holmes33922.7n/a
    Liberal Democrats Oliver Arthur Broomfield Holdsworth18512.4n/a
    Majority63242.1
    Turnout 1,50144.1n/a
    Conservative hold Swing

    Hilperton

    Hilperton
    PartyCandidateVotes%±%
    Independent Ernie Clark 1,342 79.7 -7.7
    Conservative Charles Russ20812.3+4.5
    Liberal Democrats George Stanton1358.0n/a
    Majority1,13467.0
    Turnout 1,69243.3+2.5
    Independent hold Swing

    Holt and Staverton

    Holt and Staverton
    PartyCandidateVotes%±%
    Liberal Democrats Trevor William Carbin 941 64.3 +18.9
    Conservative Richard William Nathaniel Warren52235.7+5.7
    Majority41928.6
    Turnout 1,46642.0+8.4
    Liberal Democrats hold Swing

    Kington

    Kington
    PartyCandidateVotes%±%
    Conservative Howard Greenman 1,257 69.2 +6.0
    Liberal Democrats Matthew John Bragg38020.9+4.5
    Labour Liam Nicholas John Stokes1799.9n/a
    Majority87748.3
    Turnout 1,81745.4+4.5
    Conservative hold Swing

    Laverstock, Ford and Old Sarum

    Laverstock, Ford and Old Sarum
    PartyCandidateVotes%±%
    Labour Ian David McLennan 1,050 63.4 -11.1
    Conservative Mark Jonathan Lamdin McClelland60736.6+11.1
    Majority44326.7
    Turnout 1,66041.7+9.3
    Labour hold Swing

    Ludgershall and Perham Down

    Ludgershall and Perham Down
    PartyCandidateVotes%±%
    Conservative Chris Williams 679 69.9 n/a
    Liberal Democrats Charles Edward Lambert10010.3n/a
    UKIP Leslie Alexander Webster9810.1n/a
    Green Teresa Mary Thornton949.7n/a
    Majority57969.6
    Turnout 97626.7n/a
    Conservative hold Swing

    Lyneham

    Lyneham
    PartyCandidateVotes%±%
    Conservative Allison Mary Bucknell 938 77.0 +18.0
    Liberal Democrats Trudie Ann Clarkson21717.8+5.0
    Labour Terry Couchman645.3n/a
    Majority72159.0
    Turnout 1,22338.7+5.3
    Conservative hold Swing

    Malmesbury

    Malmesbury
    PartyCandidateVotes%±%
    Liberal Democrats Gavin Grant 946 53.9 +5.7
    Conservative Frances Sheppard69939.8+11.6
    Labour Fred Price1106.3-1.7
    Majority24714.0
    Turnout 1,76143.1+3.3
    Liberal Democrats hold Swing

    Marlborough East

    Marlborough East
    PartyCandidateVotes%±%
    Conservative Stewart Raymond Dobson 733 60.5 +28.4
    Liberal Democrats John Alexander Kirk Wilson27422.6+10.9
    Labour Katherine Grace Davis20516.9+8.6
    Majority45937.7
    Turnout 1,21737.1+3.6
    Conservative hold Swing

    Marlborough West

    Marlborough West
    PartyCandidateVotes%±%
    Independent Nick Fogg 754 54.6 -0.9
    Conservative Tamara Louise Reay50736.7-1.9
    Labour Sylvia Christine Card1218.8+2.9
    Majority24717.8
    Turnout 1,38646.6+6.6
    Independent hold Swing

    Melksham Central

    Melksham Central
    PartyCandidateVotes%±%
    Liberal Democrats Hayley Jayne Spencer 481 37.9 +8.2
    Conservative Mike Swanton37929.8+6.2
    UKIP David Martin Pollitt15212.0-21.5
    Independent Martin Willard Pain15011.8n/a
    Labour Paul Grainger1088.5-4.7
    Majority1027.9
    Turnout 1,28433.7+4.0
    Liberal Democrats gain from UKIP Swing

    Melksham North

    Melksham North
    PartyCandidateVotes%±%
    Liberal Democrats Pat Aves 590 45.5 +13.7
    Conservative Nick Holder51940.0+11.0
    Independent Geoff Mitcham1048.0n/a
    Independent Richard George Wiltshire856.6n/a
    Majority715.4
    Turnout 1,31136.3+3.3
    Liberal Democrats hold Swing

    Melksham South

    Melksham South
    PartyCandidateVotes%±%
    Liberal Democrats Jon Hubbard 1,045 68.4 +17.6
    Conservative Mike Sankey48431.7+16.8
    Majority56136.3
    Turnout 1,54438.6+1.6
    Liberal Democrats hold Swing

    Melksham Without North

    Melksham Without North
    PartyCandidateVotes%±%
    Conservative Phil Alford 1,019 54.9 +28.4
    Independent Terry Chivers83845.1+4.2
    Majority1819.7
    Turnout 1,87143.3+0.9
    Conservative gain from Independent Swing

    Melksham Without South

    Melksham Without South
    PartyCandidateVotes%±%
    Conservative Roy Sidney While 709 55.3 +14.4
    Liberal Democrats Ryan James Clarke23218.1+5.9
    UKIP Paul Robert Carter17813.9-24.5
    Independent Steve Petty16312.7-n/a
    Majority47737.0
    Turnout 1,28932.0+2.4
    Conservative hold Swing

    Mere

    Mere
    PartyCandidateVotes%±%
    Independent George Edwin Jeans 1,339 66.9 -9.3
    Conservative Mike Liddicoat39919.9+4.1
    Labour John Anthony Jordan26413.2n/a
    Majority94046.8
    Turnout 2,01057.9
    Independent hold Swing

    Minety

    Minety
    PartyCandidateVotes%±%
    Conservative Chuck Berry 1,137 74.3 +21.7
    Liberal Democrats Nicola Helen Middleton29419.2+9.5
    Labour Hilary Ann Foord996.5-1.2
    Majority84354.9
    Turnout 1,53540.1-2.6
    Conservative hold Swing

    Nadder and East Knoyle

    Nadder and East Knoyle
    PartyCandidateVotes%±%
    Conservative Bridget Anne Wayman 964 66.9 +4.4
    Liberal Democrats Jill Caudle47833.2n/a
    Majority48633.6
    Turnout 1,44741.5+2.4
    Conservative hold Swing

    Pewsey

    Pewsey
    PartyCandidateVotes%±%
    Conservative Jeremy James Kunkler 1,085 72.1 -2.0
    Liberal Democrats David Roland Leighton24916.6n/a
    Labour Hannah Sarah White-Overton17011.3-14.6
    Majority83655.2
    Turnout 1,51439.4+4.6
    Conservative hold Swing

    Pewsey Vale

    Pewsey Vale
    PartyCandidateVotes%±%
    Conservative Paul Oatway 1,064 77.3 +12.9
    Liberal Democrats Fiona Clare Hornby17612.8-9.5
    Labour Michael Anthony Bohan13710.0-3.3
    Majority88864.3
    Turnout 1,38239.2+4.3
    Conservative hold Swing

    Purton

    Purton
    PartyCandidateVotes%±%
    Conservative Jacqui Lay 991 74.7 +3.9
    Liberal Democrats Kate Ann Blye33525.3n/a
    Majority65649.1
    Turnout 1,33732.2+2.9
    Conservative hold Swing

    Redlynch and Landford

    Redlynch and Landford
    PartyCandidateVotes%±%
    Conservative Leo Randall 1,020 66.5 +7.9
    Liberal Democrats Martin James Rosell31620.6n/a
    Labour Finbarr Sheehan19812.9-2.5
    Majority70445.9
    Turnout 1,53541.0+6.9
    Conservative hold Swing

    Roundway

    Roundway
    PartyCandidateVotes%±%
    Conservative Laura Evelyn Mayes 838 69.0 +5.1
    Labour Kathleen Margaret Shaw13711.3+1.3
    Green Geoff Brewer12410.2n/a
    Liberal Democrats Alasdair Kirkpatrick1159.5n/a
    Majority70157.7
    Turnout 1,21534.9+2.9
    Conservative hold Swing

    Royal Wootton Bassett East

    Royal Wootton Bassett East
    PartyCandidateVotes%±%
    Conservative Mollie Eileen May Groom 1,048 69.8 -4.0
    Liberal Democrats Simon Richard Hodkinson27918.6-7.6
    Labour James Edward Sexton17411.6n/a
    Majority76950.9
    Turnout 1,51239.2+5.8
    Conservative hold Swing

    Royal Wootton Bassett North

    Royal Wootton Bassett North
    PartyCandidateVotes%±%
    Conservative Mary Isabel Champion 744 52.6 +6.6
    Liberal Democrats Stephen Richard Walls51036.1+7.0
    Labour Heather Denise Reilly16011.3n/a
    Majority23416.5
    Turnout 1,41839.5+10.3
    Conservative hold Swing

    Royal Wootton Bassett South

    Royal Wootton Basset South
    PartyCandidateVotes%±%
    Liberal Democrats Chris Hurst 1,061 49.2 +9.5
    Conservative Paul Justin Heaphy86340.0+3.1
    Labour Ron Bardwell1326.1-0.1
    Independent Peter Joseph Doyle1024.7n/a
    Majority1989.1
    Turnout 2,16444.0+6.1
    Liberal Democrats hold Swing

    Salisbury Bemerton

    Salisbury Bemerton
    PartyCandidateVotes%±%
    Labour Ricky Rogers 568 46.3 -11.0
    Conservative Gavin Paul Barrett40833.2+14.6
    UKIP Dean Palethorpe927.5-16.6
    Liberal Democrats Robert William Steel877.1n/a
    Green Julia Anne Richardson735.9n/a
    Majority16013.0
    Turnout 1,23228.0+6.1
    Labour hold Swing

    Salisbury Fisherton and Bemerton Village

    Salisbury Fisherton and Bemerton Village
    PartyCandidateVotes%±%
    Labour John Michael Perrings Walsh 471 34.3 -2.2
    Conservative Jeremy Robert Lloyd Nettle40529.5-6.9
    Liberal Democrats Mark Philip Duly20815.1-12.0
    Independent Chris Cochrane13910.1n/a
    Green Alison Craig1027.4n/a
    UKIP Paddy Singh493.6n/a
    Majority674.9
    Turnout 1,37939.9+7.9
    Labour hold Swing

    Salisbury Harnham

    Salisbury Harnham
    PartyCandidateVotes%±%
    Liberal Democrats Brian Edward Dalton 827 44.5 -2.3
    Conservative Simon James Jackson75640.7+8.9
    Labour Merrin Holroyd1126.0-0.9
    Green Peter Jolyon Matthews975.2n/a
    UKIP Naomi May King663.6-9.9
    Majority713.8
    Turnout 1,86245.5+8.6
    Liberal Democrats hold Swing

    Salisbury St Edmund and Milford

    Salisbury St Edmund and Milford
    PartyCandidateVotes%±%
    Conservative Atiqul Hoque 654 40.5 +17.5
    Liberal Democrats Bobbie Chettleburgh55134.1-8.9
    Labour Clive Robert Vincent20912.9-1.6
    Green Sue Wright18211.3+3.8
    Together We Can ReformColin Skelton211.3n/a
    Majority1036.4
    Turnout 1,61944.4+10.8
    Conservative gain from Liberal Democrats Swing

    Note: Atiqul Hoque had previously gained the seat for the Conservative Party in a 2015 by-election.

    Salisbury St Francis and Stratford

    Salisbury St Francis and Stratford
    PartyCandidateVotes%±%
    Conservative Mary Jacquelin Douglas 909 49.4 -4.7
    Liberal Democrats Julian James Sargood Ellis59632.4+18.4
    Green Richard Bolton18710.2-1.7
    Labour Steven Ian Wadsworth1478.0-12.1
    Majority31317.0
    Turnout 1,84545.0+11.0
    Conservative hold Swing

    Salisbury St Marks and Bishopdown

    Salisbury St Marks and Bishopdown
    PartyCandidateVotes%±%
    Conservative Derek William Brown 671 45.0 -12.4
    Independent Hilary Anne Davidson41627.9n/a
    Liberal Democrats Rebecca Ann Heulwen Foster24116.2+0.2
    Labour Tom Mettyear16411.0-15.6
    Majority25517.0
    Turnout 1,49637.2+5.8
    Conservative hold Swing

    Salisbury St Martins and Cathedral

    Salisbury St Martins and Cathedral
    PartyCandidateVotes%±%
    Conservative Sven Hocking 817 41.0 +9.8
    Labour Ian Robert Tomes69935.1-6.1
    Liberal Democrats Greg Condliffe31315.7+9.3
    Green Teresa Jane Mary Fallon1155.8-0.2
    UKIP Frances Mary Patricia Howard502.5-12.7
    Majority1185.9
    Turnout 2,00748.0+9.1
    Conservative gain from Labour Swing

    Salisbury St Pauls

    Salisbury St Pauls
    PartyCandidateVotes%±%
    Conservative Matthew Jonathan Anthony Dean 650 44.7 +11.7
    Liberal Democrats Paul William Leslie Sample32422.3+15.1
    Labour Caroline Susan Corbin30120.7-7.1
    Green Benji Goehl18012.4-2.6
    Majority32622.3
    Turnout 1,46239.3+7.7
    Conservative hold Swing

    Sherston

    Sherston
    PartyCandidateVotes%±%
    Conservative John Percy Simon Stuart Thomson 1,150 68.6 -6.0
    Liberal Democrats Martin Fausing Smith41824.9+10.9
    Labour Steven James Clark1086.4-5.0
    Majority73243.5
    Turnout 1,68342.0+6.4
    Conservative hold Swing

    Southwick

    Southwick
    PartyCandidateVotes%±%
    Conservative Horace John Prickett 1,142 81.5 +38.6
    Liberal Democrats Kevin Ian Cottrell25918.5+14.5
    Majority88362.4
    Turnout 1,41539.9+6.3
    Conservative hold Swing

    Summerham and Seend

    Summerham and Seend
    PartyCandidateVotes%±%
    Conservative Jonathon Seed 1,047 56.1 -12.2
    Liberal Democrats Jo McManus82144.0n/a
    Majority22612.1
    Turnout 1,87353.7+10.6
    Conservative hold Swing

    The Collingbournes and Netheravon

    The Collingbournes and Netheravon
    PartyCandidateVotes%±%
    Conservative Ian Charles Duke Blair-Pilling 808 63.8 n/a
    Independent Alan Stephen Wood27621.8n/a
    Liberal Democrats Glenn Barry Price917.2n/a
    Green Denis Christopher Griffin917.2n/a
    Majority53242.0
    Turnout 1,26638.6n/a
    Conservative hold Swing

    The Lavingtons and Erlestoke

    The Lavingtons and Erlestoke
    PartyCandidateVotes%±%
    Conservative Richard Elliott Gamble 1,213 74.1 -2.5
    Liberal Democrats Mark Domnech William Mangham1579.6n/a
    Labour Carol Black1428.7-14.7
    Green Chris Gingell1257.6n/a
    Majority1,05664.2
    Turnout 1,64440.7+8.2
    Conservative hold Swing

    Tidworth

    Tidworth
    PartyCandidateVotes%±%
    Conservative Mark Connolly 711 84.3 n/a
    Labour Joan Barnett13315.8n/a
    Majority57868.4
    Turnout 84518.1n/a
    Conservative hold Swing

    Till and Wylye Valley

    Till and Wylye Valley
    PartyCandidateVotes%±%
    Conservative Darren George Henry 1,134 54.2 +14.5
    Liberal Democrats Ian Clive West92344.1-11.0
    Labour Gary James Buckley341.6-3.6
    Majority21110.1
    Turnout 2,09557.8+12.5
    Conservative gain from Liberal Democrats Swing

    Tisbury

    Tisbury
    PartyCandidateVotes%±%
    Conservative Tony Deane 846 61.8 +1.3
    Liberal Democrats Marcus Deyes34124.9n/a
    Green Christopher H Walford18213.3n/a
    Majority50536.9
    Turnout 1,37038.4+1.4
    Conservative hold Swing

    Trowbridge Adcroft

    Trowbridge Adcroft
    PartyCandidateVotes%±%
    Conservative Edward Kirk 483 42.7 +25.0
    Liberal Democrats Nicholas Blakemore44639.4-12.3
    Labour Adrian John Poole20217.9n/a
    Majority373.3
    Turnout 1,13531.5+3.2
    Conservative gain from Liberal Democrats Swing

    Trowbridge Central

    Trowbridge Central
    PartyCandidateVotes%±%
    Liberal Democrats Stewart Martin Palmen 511 42.6 +1.8
    Conservative John Roland Wallace Knight41734.8+17.0
    Labour Phoebe Eliana Rosalind Kemp27122.6+7.6
    Majority947.8
    Turnout 1,20232.0+6.4
    Liberal Democrats hold Swing

    Trowbridge Drynham

    Trowbridge Drynham
    PartyCandidateVotes%±%
    Conservative Graham David Payne 654 66.3 -5.8
    Labour Laura Michelle Pictor20320.6n/a
    Liberal Democrats John Richard Marsden13013.2-14.7
    Majority45145.5
    Turnout 99231.2+7.7
    Conservative hold Swing

    Trowbridge Grove

    Trowbridge Grove
    PartyCandidateVotes%±%
    Conservative David Edward Halik 509 44.8 +25.8
    Liberal Democrats Bob Brice45740.2n/a
    Labour Liz Gifford17015.0n/a
    Majority524.6
    Turnout 1,13834.5
    Conservative gain from Independent Swing

    Note: Chris Auckland had previously gained the seat for the Liberal Democrats in a 2016 by-election.

    Trowbridge Lambrok

    Trowbridge Lambrok
    PartyCandidateVotes%±%
    Conservative Deborah Ann Halik 488 45.5 +13.8
    Liberal Democrats Ben Midgley34432.1n/a
    Labour Shaun Samuel James Henley16515.4n/a
    Green Marie Hillcoat757.0n/a
    Majority14413.4
    Turnout 1,07529.3+2.3
    Conservative gain from Independent Swing

    Trowbridge Park

    Trowbridge Park
    PartyCandidateVotes%±%
    Conservative Peter Fuller 551 47.8 +7.6
    Independent Dennis Paul Drewett21318.5-24.6
    Labour Jackie Harding19917.3n/a
    Liberal Democrats Roger Guy Andrews19016.5-0.2
    Majority33829.2
    Turnout 1,15831.3+6.1
    Conservative gain from Independent Swing

    Trowbridge Paxcroft

    Trowbridge Paxcroft
    PartyCandidateVotes%±%
    Liberal Democrats Stephen John Oldrieve 750 54.5 -11.1
    Conservative James Rothschild St Clair51637.5+3.1
    Labour Maria Adlam-Apps1108.0n/a
    Majority23417.0
    Turnout 1,37930.8+1.5
    Liberal Democrats hold Swing

    Urchfont and The Cannings

    Urchfont and The Cannings
    PartyCandidateVotes%±%
    Conservative Philip Whitehead 1,156 71.8 +22.1
    Liberal Democrats John Nicholas Merrett25615.9n/a
    Labour Amanda Hopgood19912.4-4.5
    Majority90055.1
    Turnout 1,63342.4+5.3
    Conservative hold Swing

    Warminster Broadway

    Warminster Broadway
    PartyCandidateVotes%±%
    Conservative Tony Jackson 665 49.5 -5.1
    Independent Paul Batchelor33524.9n/a
    Labour Eden Morris17312.9n/a
    Liberal Democrats Martin David John Papworth17112.7n/a
    Majority33024.5
    Turnout 1,34936.8+6.3
    Conservative hold Swing

    Warminster Copheap and Wylye

    Warminster Copheap and Wylye
    PartyCandidateVotes%±%
    Conservative Christopher Newbury 1,046 74.6 +3.3
    Liberal Democrats Ryan John Ellis Bird20414.5n/a
    Labour Nicola Clare Grove15310.9n/a
    Majority84259.5
    Turnout 1,41639.9+8.5
    Conservative hold Swing

    Warminster East

    Warminster East
    PartyCandidateVotes%±%
    Conservative Andrew Davis 734 48.3 +8.7
    Independent Paul Ian MacDonald48031.6-2.3
    Labour Eleanor May Free1369.0n/a
    Liberal Democrats Nigel Paul Hampson1097.2n/a
    Green Maggie Richens604.0n/a
    Majority25416.6
    Turnout 1,52836.1+3.9
    Conservative hold Swing

    Warminster West

    Warminster West
    PartyCandidateVotes%±%
    Conservative Pip Ridout 694 58.4 n/a
    Independent Stacie Allensby18915.9n/a
    Liberal Democrats Andy Hinchcliffe15212.8n/a
    Green Carrie Moyes907.6n/a
    Labour Tony Free645.4n/a
    Majority50542.3
    Turnout 1,19328.7n/a
    Conservative hold Swing

    Warminster Without

    Warminster Without
    PartyCandidateVotes%±%
    Conservative Fleur de Rhé-Philipe 1,014 73.3 +0.9
    Liberal Democrats Jonathan Whitehead-Whiting21415.5n/a
    Labour Anthony Paul Tyler15611.3-11/4
    Majority65849.3
    Turnout 1,33439.4+7.3
    Conservative hold Swing

    West Selkley

    West Selkley
    PartyCandidateVotes%±%
    Conservative Jane Frances Davies 933 70.2 -7.1
    Liberal Democrats Sara Elizabeth Spratt27520.7n/a
    Labour Matthew James Bowman Lee1229.2n/a
    Majority80057.8
    Turnout 1,38540.3+4.4
    Conservative hold Swing

    Westbury East

    Westbury East
    PartyCandidateVotes%±%
    Liberal Democrats Gordon Ian King 661 47.1 +5.4
    Conservative Rupert Ashley Lescott60743.2+26.5
    Labour Mike Kettlety1379.8n/a
    Majority543.8
    Turnout 1,40837.1+5.3
    Liberal Democrats hold Swing

    Westbury North

    Westbury North
    PartyCandidateVotes%±%
    Liberal Democrats David Jenkins 596 57.9 +3.8
    Conservative David Lancashire29929.1+16.7
    Labour Michael Sutton13413.0+1.3
    Majority29728.8
    Turnout 1,03329.1+1.8
    Liberal Democrats hold Swing

    Westbury West

    Westbury West
    PartyCandidateVotes%±%
    Independent Russell Mark Jonathan Hawker 352 33.4 -4.7
    Conservative Nick Stovold30128.6+15.5
    Liberal Democrats Carole King26024.7+19.1
    Labour Jane Francesca Russ11110.5-4.6
    Green Margaret Frances Cavanna292.8n/a
    Majority514.8
    Turnout 1,05327.1+5.1
    Independent hold Swing

    Wilton and Lower Wylye Valley

    Wilton and Lower Wylye Valley
    PartyCandidateVotes%±%
    Conservative Pauline Elizabeth Church 760 46.0 +12.3
    Liberal Democrats Peter Derek Edge69241.9-15.1
    Labour Olivia McLennan20012.1+2.8
    Majority684.1
    Turnout 1,66143.3+10.0
    Conservative gain from Liberal Democrats Swing

    Winsley and Westwood

    Winsley and Westwood
    PartyCandidateVotes%±%
    Conservative Johnny Kidney 1,040 56.9 +15.7
    Liberal Democrats Magnus Ian Macdonald78843.1-3.0
    Majority25213.7
    Turnout 1,83655.2+11.8
    Conservative gain from Liberal Democrats Swing

    Winterslow

    Winterslow
    PartyCandidateVotes%±%
    Independent Christopher Devine 775 47.2 n/a
    Conservative Christopher Duncan Miller59035.9n/a
    Liberal Democrats Colin Richard Baxter1599.7n/a
    Green Alice Jean Kiff744.5n/a
    Labour Ian Martingale452.7n/a
    Majority18511.2
    Turnout 1,64551.9
    Independent gain from Conservative Swing

    Note: In 2013, Christopher Devine had won the seat unopposed as a Conservative candidate.

    By-elections between 2017 and 2021

    Trowbridge Drynham

    Trowbridge Drynham By-Election 4 July 2019 [5]
    PartyCandidateVotes%±%
    Liberal Democrats Andrew James Bryant 431 41.6 +28.4
    Conservative Khamal Akeem Reynolds31630.5–35.8
    IndependentJohn Roland Wallace Knight24623.7+23.7
    Labour Shaun Samuel James Henley444.2–16.4
    Majority11511.1
    Turnout 1,03833
    Liberal Democrats gain from Conservative Swing +32.1

    Westbury North

    Westbury North By-Election 18 July 2019 [6]
    PartyCandidateVotes%±%
    Liberal Democrats Carole King 488 52.4 –5.6
    IndependentIan Cunningham23124.8n/a
    Conservative Antonio Piazza14015.0–14.0
    Labour Jane Russ576.1–6.9
    IndependentFrancis Morland161.7n/a
    Majority25727.6
    Turnout 93624.43
    Liberal Democrats hold Swing +4.2

    Ethandune

    Ethandune By-Election 19 September 2019 [7]
    PartyCandidateVotes%±%
    Conservative Suzanne Grahem Wickham 778 57.0 –14.8
    Liberal Democrats Alan Charles Rankin58743.0+14.8
    Majority19114.0
    Turnout 1,37138.01
    Conservative hold Swing –14.8

    Melksham Without South

    Melksham Without South By-Election 24 October 2019 [8]
    PartyCandidateVotes%±%
    Conservative Nicholas James Holder 593 60.4 +5.1
    Liberal Democrats Vanessa Fiorelli38839.6+21.5
    Majority20520.9–16.1
    Turnout 99224.8
    Conservative hold Swing –8.2

    Trowbridge Lambrok

    Trowbridge Lambrok By-Election 28 November 2019 [9]
    PartyCandidateVotes%±%
    Liberal Democrats Joanne Lisa Trigg 622 57.5 +25.4
    Conservative David Charles Cavill45542.1–3.4
    Majority16715.4
    Turnout 1,08129.53
    Liberal Democrats gain from Conservative Swing +14.4

    Till and Wylye Valley

    Till and Wylye Valley By-Election 10 March 2020 [10]
    PartyCandidateVotes%±%
    Conservative Kevin Stuart Daley 637 49.6 –4.6
    Liberal Democrats Harry David Ashcroft62348.5+4.4
    Labour Timothy John Treslove241.9+0.3
    Majority141.1–9.0
    Turnout 1,28635.6–22.2
    Conservative hold Swing –4.5

    By-election not held

    Jane Scott retired as councillor for By Brook in February 2020, following her appointment as a government whip in the House of Lords. [4] In March 2020, a by-election to take place on 2 April was announced. Nick Botterill was selected to stand for the Conservatives, Lesley Bennet for the Liberal Democrats. [11] However, later in March the by-election was cancelled by the Returning Officer, due to COVID-19 lockdown guidance. [12] [13]

    The seat remained vacant [14] until the Wiltshire Council election in May 2021, when Botterill was elected.

    Related Research Articles

    Salisbury was a local government district in Wiltshire, England from 1974 to 2009. Its main urban area was the city of Salisbury.

    <span class="mw-page-title-main">Isle of Wight Council</span> Principal local authority of the Isle of Wight

    The Isle of Wight Council, known until 1995 as Isle of Wight County Council, is the unitary authority which governs the county of the Isle of Wight in South East England. The council is controlled by the Alliance Group, a coalition of Independent, Green, Independent Network, and Our Island councillors. Its headquarters is County Hall in Newport.

    <span class="mw-page-title-main">Bath and North East Somerset Council</span> English local government council

    Bath and North East Somerset Council is the local council for the district of Bath and North East Somerset in Somerset, England.

    <span class="mw-page-title-main">Burnley Borough Council elections</span>

    Burnley Borough Council elections are generally held three years out of every four, with a third of the council elected each time. Burnley Borough Council is the local authority for the non-metropolitan district of Burnley in Lancashire, England. Since the last boundary changes in 2002, 45 councillors have been elected from 15 wards.

    Shropshire Council elections are held every four years, and since 2009 74 councillors have been elected from 63 electoral divisions.

    <span class="mw-page-title-main">Jane Scott, Baroness Scott of Bybrook</span> English Conservative politician

    Jane Antoinette Scott, Baroness Scott of Bybrook, is a British Conservative politician serving as Parliamentary Under-Secretary of State for Social Housing and Faith since September 2022. She is a member of the House of Lords and was a government whip from 2020 to 2022. She was leader of Wiltshire County Council between 2003 and 2009 and then of its successor the Wiltshire Council unitary authority from June 2009 until July 2019, when she stood down, also retiring as a councillor in February 2020.

    <span class="mw-page-title-main">2009 Wiltshire Council election</span>

    Elections to Wiltshire Council, a new unitary authority, were held on 4 June 2009.

    <span class="mw-page-title-main">2010 Swindon Borough Council election</span>

    The 2010 Swindon Borough Council election took place on 6 May 2010 to elect members of Swindon Unitary Council in Wiltshire, England. One third of the council was up for election and the Conservative Party stayed in overall control of the council.

    <span class="mw-page-title-main">2013 Wiltshire Council election</span> English local council election

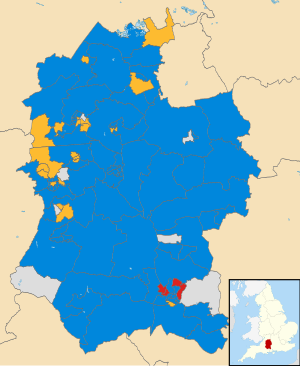
    Elections to the Wiltshire Council unitary authority took place on 2 May 2013. All ninety-eight seats were up for election, with each councillor being elected in a single-member electoral division, although in six of the divisions only one candidate was nominated and was thus declared the winner without elections taking place.

    <span class="mw-page-title-main">2013 Cornwall Council election</span>

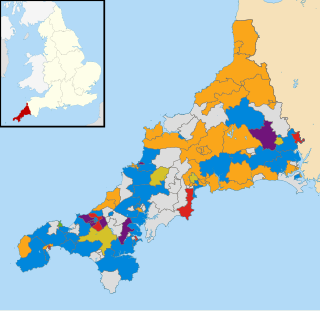
    The Cornwall Council election, 2013, was an election for all 123 seats on the council. Cornwall Council is a unitary authority that covers the majority of the ceremonial county of Cornwall, with the exception of the Isles of Scilly which have an independent local authority. The elections took place concurrently with other local elections across England and Wales.

    <span class="mw-page-title-main">2017 United Kingdom local elections</span>

    The 2017 United Kingdom local elections were held on Thursday 4 May 2017. Local elections were held across Great Britain, with elections to 35 English local authorities and all councils in Scotland and Wales.

    <span class="mw-page-title-main">2017 Cornwall Council election</span>

    The 2017 Cornwall Council election was held on 4 May 2017 as part of the 2017 local elections in the United Kingdom. 122 councillors were elected from the 121 electoral divisions of Cornwall Council, which returned either one or two councillors each by first-past-the-post voting for a four-year term of office. Although originally scheduled to take place on the same day, the election in the Bodmin St Petroc ward was countermanded following the death of Liberal Democrat candidate Steve Rogerson and was held on 8 June.

    <span class="mw-page-title-main">2019 United Kingdom local elections</span> Elections to local councils and mayoralties

    The 2019 United Kingdom local elections took place on Thursday 2 May 2019, with 248 English local councils, six directly elected mayors in England, and all 11 local councils in Northern Ireland being contested.

    <span class="mw-page-title-main">2021 United Kingdom local elections</span> Elections to local councils and mayoralties

    The 2021 United Kingdom local elections were held on Thursday 6 May 2021. More than 145 English local councils, around 5,000 councillor seats, thirteen directly elected mayors in England, and 39 police and crime commissioners in England and Wales were contested. On the same day, the 2021 Hartlepool by-election took place, and there were also elections to the Scottish Parliament, Senedd and London Assembly, the last in conjunction with the London mayoral election.

    <span class="mw-page-title-main">2019 North Somerset Council election</span>

    The 2019 North Somerset Council election took place on 2 May 2019 to elect members of North Somerset Council in England.

    Wiltshire County Council elections were first held on 23 January 1889, with the election of the first Wiltshire County Council. Thereafter, elections were held every three years, with all members being elected on the same day. Later, the cycle was changed to one election in every four years, and the last such election was in 2005. There were also occasional by-elections, the last of which took place in February 2008.

    <span class="mw-page-title-main">2021 Hampshire County Council election</span>

    Elections to Hampshire County Council took on 6 May 2021 as part of the 2021 United Kingdom local elections. All 78 seats were up for election, with each ward returning either one or two councillors by first-past-the-post voting for a four-year term of office. This took place at the same time as the elections for the Hampshire Police and Crime Commissioner and district councils.

    The 2022 North Yorkshire Council election took place on 5 May 2022, alongside the other local elections. These were the last elections to North Yorkshire County Council, and the elected councillors would also serve as the first councillors on the North Yorkshire Council, which replaced the existing county council in April 2023.

    <span class="mw-page-title-main">2021 Wiltshire Council election</span>

    The 2021 Wiltshire Council election took place on 6 May 2021 as part of the 2021 local elections in the United Kingdom. All 98 councillors were elected from electoral divisions which returned one councillor each by first-past-the-post voting for a four-year term of office.

    Nicholas Byron "Nick" Botterill is a British businessman, company director, and Conservative politician.

    References

    1. "Upcoming elections & referendums". Electoral Commission. Archived from the original on 5 May 2018. Retrieved 15 September 2016.
    2. Bulford, Allington and Figheldean election 2017 at wiltshire.gov.uk, accessed 30 September 2020
    3. "Unitary council election on Thursday 4 May 2017". Wiltshire Council. 11 May 2017. Retrieved 11 May 2017.
    4. 1 2 "Councillor resigns following appointment to Government role". Wiltshire Council. 18 February 2020. Retrieved 20 March 2021.
    5. Declaration of Result of Poll Archived 10 September 2020 at the Wayback Machine at Wiltshire.gov.uk
    6. "Wiltshire Local Election". Democracy Club. Retrieved 19 July 2019.
    7. "Declaration of Result of Poll" (PDF). wiltshire.gov.uk. Wiltshire Council. Archived from the original (PDF) on 10 September 2020. Retrieved 20 September 2019.
    8. "Declaration of Result of Poll" (PDF). wiltshire.gov.uk. Wiltshire Council. Archived from the original (PDF) on 10 September 2020. Retrieved 27 October 2019.
    9. Declaration of Result of Poll Archived 10 September 2020 at the Wayback Machine at Wiltshire.gov.uk
    10. "Declaration of Result of Poll". wiltshire.gov.uk. Wiltshire Council. Archived from the original on 10 September 2020. Retrieved 11 March 2020.
    11. Matthew McLaughlin, "By-election: Meet the two By Brook candidates", wiltshiretimes.co.uk, 17 March 2020, accessed 25 April 2020
    12. "SUSPENDED: Unitary council by-election for By Brook Unitary Division on Thursday 2 April 2020", wiltshire.gov.uk, 2 April 2020
    13. Matthew McLaughlin, "By Brook by-election suspended due to Coronavirus", Gazette and Herald , 23 March 2020, accessed 25 April 2021
    14. "Councillor details - By Brook Division Vacancy". Wiltshire Council. 20 March 2021. Archived from the original on 6 March 2021. Retrieved 20 March 2021.

    "Statement of Persons Nominated", 4 April 2017, Marlborough Town Council