| |||||||||||||||||||||
All 57 seats to Warwickshire County Council 29 seats needed for a majority | |||||||||||||||||||||
---|---|---|---|---|---|---|---|---|---|---|---|---|---|---|---|---|---|---|---|---|---|
| |||||||||||||||||||||
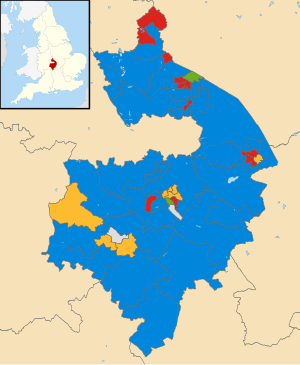
Map showing the results of the 2017 Warwickshire County Council elections. | |||||||||||||||||||||
|
The 2017 Warwickshire County Council election took place as part of the 2017 local elections in the UK. [1] All 57 councillors were elected for single-member electoral divisions for a four-year term. The voting system used was first-past-the-post.
Boundary changes took effect at this election after a review by the Local Government Boundary Commission for England. [2] [3]
The result was Conservative councillors formed a majority of 15 on the council which had been three seats short of any single political grouping's control before the election. The second-largest party became ten councillors of the Labour Party and the balance of the council became formed by seven Liberal Democrats.
Party | Seats | Gains | Losses | Net gain/loss | Seats % | Votes % | Votes | +/− | |
---|---|---|---|---|---|---|---|---|---|
Conservative | 36 | +10 | 49.1 | 76,519 | |||||
Labour | 10 | -12 | 23.6 | 36,678 | |||||
Liberal Democrats | 7 | -2 | 16.2 | 25,265 | |||||
Green | 2 | - | 7.5 | 11,666 | |||||
Other parties | 2 | -1 | 1.0 | 1,505 | |||||
UKIP | 0 | - | 2.6 | 4,090 |
North Warwickshire had 7 seats.
Party | Candidate | Votes | % | ±% | |
---|---|---|---|---|---|
Labour | Neil Dirveiks | 834 | 41.0 | ||
Conservative | Mark Simpson | 817 | 40.2 | ||
UKIP | Robert Gisbourne | 313 | 15.4 | ||
Green | Aaron Gibson | 69 | 3.4 | ||
Majority | 17 | 0.8 | - | ||
Turnout | 2,033 | 29.8 | |||
Labour win (new seat) |
Party | Candidate | Votes | % | ±% | |
---|---|---|---|---|---|
Conservative | Andy Wright | 1,315 | 55.5 | ||
Labour | Peter Morson | 982 | 41.4 | ||
Green | Ian Davidson | 73 | 3.1 | ||
Majority | 333 | 14.1 | |||
Turnout | 2,370 | 31.8 | |||
Conservative win (new seat) |
Party | Candidate | Votes | % | ±% | |
---|---|---|---|---|---|
Conservative | Dave Reilly | 1,676 | 62.5 | ||
Labour | Adam Farrell | 935 | 34.9 | ||
Green | James Barrett | 70 | 2.6 | ||
Majority | 741 | 27.6 | |||
Turnout | 2,681 | 40.4 | |||
Conservative win (new seat) |
Party | Candidate | Votes | % | ±% | |
---|---|---|---|---|---|
Conservative | Colin Hayfield | 1,732 | 68.0 | ||
Labour | Carl Jerromes | 697 | 27.4 | ||
Green | Nick Brierley | 118 | 4.6 | ||
Majority | 1035 | 40.6 | |||
Turnout | 2,547 | 35.9 | |||
Conservative win (new seat) |
Party | Candidate | Votes | % | ±% | |
---|---|---|---|---|---|
Conservative | Margaret Bell | 1,155 | 52.0 | ||
Labour | Chris Clark | 799 | 36.1 | ||
UKIP | Richard Freer | 183 | 8.3 | ||
Green | Ian Bourne | 79 | 3.6 | ||
Majority | 356 | 15.9 | - | ||
Turnout | 2,216 | 31.3 | |||
Conservative win (new seat) |
Party | Candidate | Votes | % | ±% | |
---|---|---|---|---|---|
Conservative | Andy Jenns | 1,471 | 58.8 | ||
Labour | Jacqueline Chambers | 611 | 24.4 | ||
Independent | Brian Moss | 346 | 13.8 | ||
Green | Julia Hart | 72 | 3.0 | ||
Majority | 860 | 34.4 | - | ||
Turnout | 2,500 | 36.0 | |||
Conservative win (new seat) |
Party | Candidate | Votes | % | ±% | |
---|---|---|---|---|---|
Labour | Dave Parsons | 1,191 | 50.3 | ||
Conservative | Dave Humphreys | 1073 | 45.3 | ||
Green | Alix Dearing | 103 | 4.4 | ||
Majority | 118 | ||||
Turnout | 2367 | 31.9 | |||
Labour win (new seat) |
Nuneaton and Bedworth had 13 seats.
Party | Candidate | Votes | % | ±% | |
---|---|---|---|---|---|
Conservative | Clare Golby | 1,249 | 57.4 | ||
Labour | Steve Hey | 782 | 35.9 | ||
Green | Mike Wright | 147 | 6.7 | ||
Majority | 467 | 21.5 | |||
Turnout | 2178 | 30.13 | |||
Conservative win (new seat) |
Party | Candidate | Votes | % | ±% | |
---|---|---|---|---|---|
Conservative | Andy Sargeant | 1,086 | 49.0 | ||
Labour | June Tandy | 956 | 43.1 | ||
Green | Sophie Bonner | 176 | 7.9 | ||
Majority | 130 | 5.9 | |||
Turnout | 2218 | ||||
Conservative win (new seat) |
Party | Candidate | Votes | % | ±% | |
---|---|---|---|---|---|
Labour | Richard Chattaway | 1,076 | 50.9 | ||
Conservative | Kyle Evans | 809 | 38.3 | ||
UKIP | Craig Carpenter | 181 | 8.6 | ||
Green | Sarah Richards | 47 | 2.2 | ||
Majority | 267 | 12.6 | |||
Turnout | 2113 | ||||
Labour win (new seat) |
Party | Candidate | Votes | % | ±% | |
---|---|---|---|---|---|
Conservative | Bhagwant Pandher | 971 | 45.6 | ||
Labour | Julie Jackson | 909 | 42.7 | ||
Independent | Steve Young | 171 | 8.0 | ||
Green | James Alty | 79 | 3.7 | ||
Majority | 62 | 2.9 | |||
Turnout | 2130 | ||||
Conservative win (new seat) |
Party | Candidate | Votes | % | ±% | |
---|---|---|---|---|---|
Conservative | Seb Gran | 1,549 | 64.1 | ||
Labour | Bob Copland | 765 | 31.7 | ||
Green | Theresa Brookes | 102 | 4.2 | ||
Majority | 784 | 32.4 | |||
Turnout | 2416 | ||||
Conservative win (new seat) |
Party | Candidate | Votes | % | ±% | |
---|---|---|---|---|---|
Conservative | Pete Gilbert | 1,155 | 49.3 | ||
Labour | Ian Lloyd | 947 | 40.5 | ||
UKIP | Andrew Wilson | 133 | 5.7 | ||
Green | Merle Gering | 106 | 4.5 | ||
Majority | 208 | 8.8 | |||
Turnout | 2341 | ||||
Conservative win (new seat) |
Party | Candidate | Votes | % | ±% | |
---|---|---|---|---|---|
Conservative | Jeff Morgan | 2,461 | 71.2 | ||
Labour | John Beaumont | 816 | 23.6 | ||
Green | Laurel Brindley | 180 | 5.2 | ||
Majority | 1645 | 47.6 | |||
Turnout | 3467 | ||||
Conservative win (new seat) |
Party | Candidate | Votes | % | ±% | |
---|---|---|---|---|---|
Labour | Corrine Davies | 777 | 47.2 | ||
Conservative | Olu Tokode | 506 | 30.7 | ||
UKIP | Tony Grant | 211 | 12.8 | ||
Green | Christopher Brookes | 152 | 9.3 | ||
Majority | 271 | ||||
Turnout | 1646 | ||||
Labour win (new seat) |
Party | Candidate | Votes | % | ±% | |
---|---|---|---|---|---|
Conservative | Dan Gissane | 1,254 | 56.87 | ||
Labour | Philip Johnson | 675 | 30.61 | ||
UKIP | Ray Wilkinson | 167 | 7.26 | ||
Green | Amanda Hotley | 114 | 5.17 | ||
Majority | 579 | 26.26 | |||
Turnout | 2205 | 28.1 | |||
Conservative win (new seat) |
Party | Candidate | Votes | % | ±% | |
---|---|---|---|---|---|
Labour | Bill Olner | 1,690 | 67.17 | ||
Conservative | Sajid Sayed | 602 | 23.93 | ||
Green | Ian Bonner | 213 | 8.14 | ||
Majority | 1,088 | 43.24 | |||
Turnout | 2516 | 32.71 | |||
Labour win (new seat) |
Party | Candidate | Votes | % | ±% | |
---|---|---|---|---|---|
Conservative | Jeff Clarke | 1,949 | 63.44 | ||
Green | Michele Kondakor | 649 | 21.13 | ||
Labour | Andrew Crichton | 462 | 15.21 | ||
Majority | 1,300 | 42.31 | |||
Turnout | 3587 | 42.11 | |||
Conservative win (new seat) |
Party | Candidate | Votes | % | ±% | |
---|---|---|---|---|---|
Labour | Caroline Phillips | 952 | 50.4 | ||
Conservative | Jamie Cummings | 776 | 41.1 | ||
Green | Maggie Morrissey | 162 | 8.6 | ||
Majority | 176 | 9.3 | |||
Turnout | 1890 | ||||
Labour win (new seat) |
Party | Candidate | Votes | % | ±% | |
---|---|---|---|---|---|
Green | Keith Kondakor | 1,658 | 46.3 | ||
Conservative | Rob Tromans | 1,521 | 42.5 | ||
Labour | Brian Walmsley | 400 | 11.2 | ||
Majority | 137 | 3.8 | |||
Turnout | 3579 | ||||
Green win (new seat) |
Rugby had 13 seats.
Party | Candidate | Votes | % | ±% | |
---|---|---|---|---|---|
Conservative | Peter Butlin | 1,412 | 52.1 | ||
Labour | Ish Mistry | 822 | 30.4 | ||
Liberal Democrats | Lee Chase | 227 | 8.4 | ||
UKIP | Frank McGowan | 144 | 5.3 | ||
Green | Judith Barrett | 103 | 3.8 | ||
Majority | 590 | 21.7 | |||
Turnout | 2708 | ||||
Conservative win (new seat) |
Party | Candidate | Votes | % | ±% | |
---|---|---|---|---|---|
Labour | Alan Webb | 1,054 | 54.1 | ||
Conservative | Charlie Hull | 502 | 25.7 | ||
Liberal Democrats | Hugh Trimble | 189 | 9.7 | ||
Green | Graham Bliss | 137 | 7.0 | ||
TUSC | Marian Wakelin | 68 | 3.5 | ||
Majority | 552 | 28.4 | |||
Turnout | 1950 | ||||
Labour win (new seat) |
Party | Candidate | Votes | % | ±% | |
---|---|---|---|---|---|
Conservative | Kam Kaur | 1,691 | 49.2 | ||
Liberal Democrats | Noreen New | 1,146 | 33.4 | ||
Labour | Howard Davis | 446 | 13.0 | ||
Green | Kate Crowley | 151 | 4.4 | ||
Majority | 545 | 15.8 | |||
Turnout | 3434 | ||||
Conservative win (new seat) |
Party | Candidate | Votes | % | ±% | |
---|---|---|---|---|---|
Conservative | Jill Simpson-Vince | 1,007 | 47.3 | ||
Labour | Mary Webb | 802 | 37.7 | ||
Liberal Democrats | Jerome Perrier | 167 | 7.8 | ||
Green | Peter Reynolds | 153 | 7.2 | ||
Majority | 205 | 9.6 | |||
Turnout | 2129 | ||||
Conservative win (new seat) |
Party | Candidate | Votes | % | ±% | |
---|---|---|---|---|---|
Conservative | Howard Roberts | 2,636 | 75.1 | ||
Labour | Bob Hughes | 434 | 12.4 | ||
Liberal Democrats | Laura Slinn | 294 | 8.4 | ||
Green | James Harrison | 145 | 4.1 | ||
Majority | 1,562 | 48.8 | |||
Turnout | 3509 | ||||
Conservative win (new seat) |
Party | Candidate | Votes | % | ±% | |
---|---|---|---|---|---|
Conservative | Heather Timms | 1,735 | 66.1 | ||
Labour | Scott Prior | 580 | 22.1 | ||
UKIP | John Birch | 168 | 6.4 | ||
Green | Felicity Rock | 143 | 5.4 | ||
Majority | 1,155 | 44.0 | |||
Turnout | 3203 | ||||
Conservative win (new seat) |
Party | Candidate | Votes | % | ±% | |
---|---|---|---|---|---|
Liberal Democrats | Jerry Roodhouse | 1,584 | 54.0 | ||
Conservative | Tony Meeson | 745 | 25.4 | ||
Labour | Matt Weston | 507 | 17.3 | ||
Green | Ellie Roderick | 99 | 3.4 | ||
Majority | 545 | 15.8 | |||
Turnout | 2935 | ||||
Liberal Democrats win (new seat) |
Party | Candidate | Votes | % | ±% | |
---|---|---|---|---|---|
Conservative | Adrian Warwick | 2,188 | 68.3 | ||
Labour | Kieren Brown | 626 | 19.5 | ||
Liberal Democrats | Trisha Trimble | 260 | 8.1 | ||
Green | Peggy Wiseman | 129 | 4.0 | ||
Majority | 1,562 | 48.8 | |||
Turnout | 3203 | ||||
Conservative win (new seat) |
Party | Candidate | Votes | % | ±% | |
---|---|---|---|---|---|
Conservative | Yousef Dahmash | 1,625 | 55.9 | ||
Labour | Jim Ellis | 739 | 25.4 | ||
Liberal Democrats | Craig McQueen | 426 | 14.7 | ||
Green | Julie-Ann Machin | 116 | 4.0 | ||
Majority | 886 | 30.5 | |||
Turnout | 2906 | ||||
Conservative win (new seat) |
Party | Candidate | Votes | % | ±% | |
---|---|---|---|---|---|
Labour | Maggie O'Rourke | 1,019 | 45.9 | ||
Conservative | Sara Last | 715 | 32.2 | ||
Liberal Democrats | Neil Sandison | 333 | 15.0 | ||
Green | Roy Sandison | 111 | 5.0 | ||
TUSC | Julie Weekes | 44 | 2.0 | ||
Majority | 304 | 13.7 | |||
Turnout | 2222 | ||||
Labour win (new seat) |
Stratford-on-Avon had 13 seats.
Party | Candidate | Votes | % | ±% | |
---|---|---|---|---|---|
Conservative | Mark Cargill | 1,841 | 55.2 | ||
Liberal Democrats | Susan Juned | 1,227 | 36.8 | ||
Labour | Andrew Foster | 161 | 4.8 | ||
Green | Duncan Parker | 106 | 3.2 | ||
Majority | 614 | 18.4 | |||
Turnout | 3335 | ||||
Conservative win (new seat) |
Party | Candidate | Votes | % | ±% | |
---|---|---|---|---|---|
Conservative | John Horner | 2,451 | 81.6 | ||
Liberal Democrats | Karyl Rees | 365 | 12.2 | ||
Green | Mark Griffiths | 187 | 6.2 | ||
Majority | 2,086 | 69.4 | |||
Turnout | 3003 | ||||
Conservative win (new seat) |
Party | Candidate | Votes | % | ±% | |
---|---|---|---|---|---|
Conservative | Mike Brain | 1,945 | 59.0 | ||
Liberal Democrats | William Horton | 702 | 21.3 | ||
Labour | Cat Price | 323 | 9.8 | ||
UKIP | Graham Porter | 178 | 5.4 | ||
Green | Debbie Griffiths | 150 | 4.5 | ||
Majority | 1,243 | 37.7 | |||
Turnout | 3298 | ||||
Conservative win (new seat) |
Party | Candidate | Votes | % | ±% | |
---|---|---|---|---|---|
Conservative | Bob Stevens | 1,901 | 66.3 | ||
Liberal Democrats | Bev Veasey-Walshe | 436 | 15.2 | ||
Labour | Matthew Panton | 356 | 12.4 | ||
Green | Pat Hotson | 174 | 6.1 | ||
Majority | 590 | 21.7 | |||
Turnout | 2624 | ||||
Conservative win (new seat) |
Party | Candidate | Votes | % | ±% | |
---|---|---|---|---|---|
Conservative | Chris Williams | 1,351 | 45.0 | ||
Liberal Democrats | Laura Steele | 1,218 | 40.5 | ||
Labour | Patrick Jenkins | 178 | 5.9 | ||
UKIP | Edward Fila | 143 | 4.8 | ||
Green | Rob Ballantyne | 114 | 3.8 | ||
Majority | 133 | 4.5 | |||
Turnout | 3004 | ||||
Conservative win (new seat) |
Party | Candidate | Votes | % | ±% | |
---|---|---|---|---|---|
Conservative | Jo Barker | 2,011 | 65.7 | ||
Liberal Democrats | Roger Billins | 647 | 21.1 | ||
Labour | John Hartigan | 227 | 7.4 | ||
Green | Dave Passingham | 176 | 5.7 | ||
Majority | 1364 | 44.6 | |||
Turnout | 3061 | ||||
Conservative win (new seat) |
Party | Candidate | Votes | % | ±% | |
---|---|---|---|---|---|
Conservative | Andy Crump | 1,854 | 70.7 | ||
Labour | Ros Grant | 514 | 19.6 | ||
Green | Derek Price | 129 | 4.9 | ||
Liberal Democrats | Andrew Milton | 127 | 4.8 | ||
Majority | 590 | 21.7 | |||
Turnout | 2624 | ||||
Conservative win (new seat) |
Party | Candidate | Votes | % | ±% | |
---|---|---|---|---|---|
Conservative | Izzi Seccombe | 1,862 | 74.2 | ||
Liberal Democrats | Di Walden | 278 | 11.1 | ||
Labour | Jan Sewell | 199 | 7.9 | ||
Green | Dean Jones | 171 | 6.8 | ||
Majority | 1,584 | 63.1 | |||
Turnout | 2510 | ||||
Conservative win (new seat) |
Party | Candidate | Votes | % | ±% | |
---|---|---|---|---|---|
Stratford First | Edward Keith Lloyd | 876 | 33.1 | ||
Conservative | Anthony Jefferson | 753 | 28.4 | ||
Liberal Democrats | Dominic Skinner | 640 | 24.2 | ||
Labour | John Allan Hartley | 244 | 9.2 | ||
Green | John David Stott | 134 | 5.1 | ||
Majority | 123 | 4.7 | |||
Turnout | 2647 | ||||
Stratford First win (new seat) |
Party | Candidate | Votes | % | ±% | |
---|---|---|---|---|---|
Liberal Democrats | Kate Rolfe | 1,949 | 51.8 | ||
Conservative | Philip Applin | 1,437 | 38.2 | ||
Labour | Emma Bradley | 258 | 6.9 | ||
Green | Tony Dennis | 119 | 3.2 | ||
Majority | 512 | 13.6 | |||
Turnout | 3763 | ||||
Liberal Democrats win (new seat) |
Party | Candidate | Votes | % | ±% | |
---|---|---|---|---|---|
Liberal Democrats | Jenny Fradgley | 1,608 | 59.1 | ||
Conservative | Jonathan Gullis | 849 | 31.2 | ||
Labour | Eleanor Whitehead | 177 | 6.5 | ||
Green | John Riley | 86 | 3.2 | ||
Majority | 759 | 17.9 | |||
Turnout | 2720 | ||||
Liberal Democrats win (new seat) |
Party | Candidate | Votes | % | ±% | |
---|---|---|---|---|---|
Liberal Democrats | Clive Rickhards | 1,195 | 44.2 | ||
Conservative | Justin Kerridge | 1,170 | 43.3 | ||
Labour | Chris Pilkington | 270 | 10.0 | ||
Green | Alistair Goddon | 67 | 2.5 | ||
Majority | 25 | 0.9 | |||
Turnout | 2702 | ||||
Liberal Democrats win (new seat) |
Party | Candidate | Votes | % | ±% | |
---|---|---|---|---|---|
Conservative | Anne Parry | 1,852 | 53.7 | ||
Liberal Democrats | David Johnston | 1,201 | 34.8 | ||
Labour | James Briggs | 163 | 4.7 | ||
UKIP | Frank Rietz | 122 | 3.5 | ||
Green | Roger Fisher | 110 | 3.2 | ||
Majority | 651 | 18.9 | |||
Turnout | 3448 | ||||
Conservative win (new seat) |
Warwick had 14 seats.
Party | Candidate | Votes | % | ±% | |
---|---|---|---|---|---|
Conservative | Les Caborn | 2,082 | 66.5 | ||
Labour | Colin Quinney | 533 | 17.0 | ||
Liberal Democrats | John Cooper | 361 | 11.5 | ||
Green | Derrick Knight | 155 | 5.0 | ||
Majority | 1,549 | 49.5 | |||
Turnout | 3131 | ||||
Conservative win (new seat) |
Party | Candidate | Votes | % | ±% | |
---|---|---|---|---|---|
Conservative | Wallace Redford | 1,725 | 62.3 | ||
Labour | Nicholas Hoten | 465 | 16.8 | ||
Liberal Democrats | Helen James | 302 | 10.9 | ||
Green | Chris Philpott | 275 | 9.9 | ||
Majority | 1,260 | 45.5 | |||
Turnout | 2767 | ||||
Conservative win (new seat) |
Party | Candidate | Votes | % | ±% | |
---|---|---|---|---|---|
Conservative | Dave Shilton | 1,591 | 53.1 | ||
Liberal Democrats | Rachel Clayton | 699 | 23.3 | ||
Labour | Audrey Mullender | 390 | 13.0 | ||
Green | John Dearing | 317 | 10.6 | ||
Majority | 892 | 29.8 | |||
Turnout | 2997 | ||||
Conservative win (new seat) |
Party | Candidate | Votes | % | ±% | |
---|---|---|---|---|---|
Conservative | Alan Cockburn | 1,486 | 42.3 | ||
Liberal Democrats | Richard Dickson | 1,385 | 39.4 | ||
Labour | Wallace McDowell | 378 | 10.8 | ||
Green | Pippa Austin | 162 | 4.6 | ||
UKIP | Martin Mackenzie | 102 | 2.9 | ||
Majority | 101 | 2.9 | |||
Turnout | 3513 | ||||
Conservative win (new seat) |
Party | Candidate | Votes | % | ±% | |
---|---|---|---|---|---|
Conservative | John Cooke | 1,602 | 60.3 | ||
Liberal Democrats | Kate Dickson | 655 | 24.7 | ||
Labour | Joshua Payne | 246 | 9.3 | ||
Green | Samuel Porter | 96 | 3.6 | ||
UKIP | Ian Tyres | 58 | 2.2 | ||
Majority | 947 | 35.6 | |||
Turnout | 2657 | ||||
Conservative win (new seat) |
Party | Candidate | Votes | % | ±% | |
---|---|---|---|---|---|
Green | Jonathan Chilvers | 1,340 | 55.3 | ||
Labour | Jojo Norris | 774 | 31.9 | ||
Conservative | Samuel Carter | 233 | 9.6 | ||
Liberal Democrats | Louis Adam | 78 | 3.2 | ||
Majority | 566 | 23.4 | |||
Turnout | 2425 | ||||
Green win (new seat) |
Party | Candidate | Votes | % | ±% | |
---|---|---|---|---|---|
Liberal Democrats | Nicola Davies | 998 | 34.1 | ||
Conservative | Elizabeth Phillips | 944 | 32.2 | ||
Labour | Jerry Weber | 771 | 26.3 | ||
Green | Will Roberts | 139 | 4.7 | ||
UKIP | Gerry Smith | 76 | 2.6 | ||
Majority | 54 | 1.9 | |||
Turnout | 2928 | ||||
Liberal Democrats win (new seat) |
Party | Candidate | Votes | % | ±% | |
---|---|---|---|---|---|
Liberal Democrats | Bill Gifford | 1,907 | 58.8 | ||
Conservative | Anne-Marie Campion | 839 | 25.9 | ||
Labour | Andy Marshall | 383 | 11.8 | ||
Green | Will Bryce | 116 | 3.6 | ||
Majority | 1,068 | 32.9 | |||
Turnout | 3245 | ||||
Liberal Democrats win (new seat) |
Party | Candidate | Votes | % | ±% | |
---|---|---|---|---|---|
Liberal Democrats | Sarah Boad | 1,501 | 43.9 | ||
Labour | Diana Taulbut | 960 | 28.1 | ||
Conservative | Stacey Calder | 835 | 24.4 | ||
Green | Marcia Watson | 126 | 3.7 | ||
Majority | 541 | 15.8 | |||
Turnout | 3422 | ||||
Liberal Democrats win (new seat) |
Party | Candidate | Votes | % | ±% | |
---|---|---|---|---|---|
Labour | Matt Western | 1,244 | 45.9 | ||
Green | Martin Luckhurst | 940 | 34.7 | ||
Conservative | Sean Rose | 430 | 15.9 | ||
Liberal Democrats | Simon Wheeler | 95 | 3.5 | ||
Majority | 304 | 11.2 | |||
Turnout | 2709 | ||||
Labour win (new seat) |
Party | Candidate | Votes | % | ±% | |
---|---|---|---|---|---|
Conservative | Pam Williams | 1,172 | 45.1 | ||
Labour | Helen Adkins | 1,011 | 38.9 | ||
Liberal Democrats | Chris Begg | 177 | 6.8 | ||
UKIP | Alastair MacBrayne | 141 | 5.4 | ||
Green | Tracey Drew | 99 | 3.8 | ||
Majority | 161 | 6.2 | |||
Turnout | 2600 | ||||
Conservative win (new seat) |
Party | Candidate | Votes | % | ±% | |
---|---|---|---|---|---|
Conservative | Parminder Birdi | 1,409 | 49.8 | ||
Liberal Democrats | Kelvin Lambert | 579 | 20.4 | ||
Labour | Serhan Wade | 486 | 17.2 | ||
Green | Matt Swift | 195 | 6.9 | ||
UKIP | Mark Skinner | 163 | 5.8 | ||
Majority | 830 | 29.4 | |||
Turnout | 2832 | ||||
Conservative win (new seat) |
Party | Candidate | Votes | % | ±% | |
---|---|---|---|---|---|
Labour | John Holland | 1,263 | 41.6 | ||
Conservative | Clare Hopkinson | 1,259 | 41.5 | ||
Liberal Democrats | Dale Cox | 268 | 8.8 | ||
UKIP | Bob Dhillon | 137 | 4.5 | ||
Green | Pam Lunn | 109 | 3.6 | ||
Majority | 4 | 0.1 | |||
Turnout | 3036 | ||||
Labour win (new seat) |
Party | Candidate | Votes | % | ±% | |
---|---|---|---|---|---|
Whitnash Residents | Judy Falp | 1,154 | 47.9 | ||
Labour | Dave Rawcliffe | 419 | 17.4 | ||
Independent | Adrian Barton | 323 | 13.4 | ||
Conservative | Jules Morgan | 253 | 10.5 | ||
Green | Eloise Chilvers | 218 | 9.1 | ||
Liberal Democrats | Chris Walsh | 41 | 1.7 | ||
Majority | 735 | 30.5 | |||
Turnout | 2408 | ||||
Whitnash Residents win (new seat) |
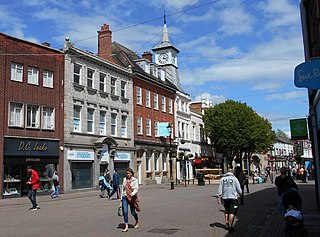
Nuneaton is a market town in the borough of Nuneaton and Bedworth in Warwickshire, England, located adjacent to the county border with Leicestershire to the north-east. Nuneaton's population at the 2021 census was 88,813, making it the largest town in Warwickshire. Nuneaton's larger urban area, which also includes the large adjoining villages of Bulkington and Hartshill had a population of 99,372 in the 2021 census.
Bedworth is a market town in the borough of Nuneaton and Bedworth, Warwickshire, England. It is situated between Coventry, 6 miles to the south, and Nuneaton, 3 miles (5 km) to the north.
Nuneaton and Bedworth is a local government district with borough status in Warwickshire, England. It includes the towns of Nuneaton and Bedworth, as well as a modest rural hinterland including the village of Bulkington.
Warwickshire is a ceremonial county in the West Midlands of England. It is bordered by Staffordshire and Leicestershire to the north, Northamptonshire to the east, Oxfordshire and Gloucestershire to the south, and Worcestershire and the West Midlands county to the west. The largest settlement is Nuneaton and the county town is Warwick.
William John Olner was a British Labour Co-operative politician who served as Member of Parliament (MP) for Nuneaton from 1992 until 2010. Previously, he led Nuneaton Borough Council.
North Warwickshire is a local government district with borough status in Warwickshire, England. The borough includes the two towns of Atherstone and Coleshill, and the large villages of Polesworth, Kingsbury, Hartshill and Water Orton along with smaller villages and surrounding rural areas.
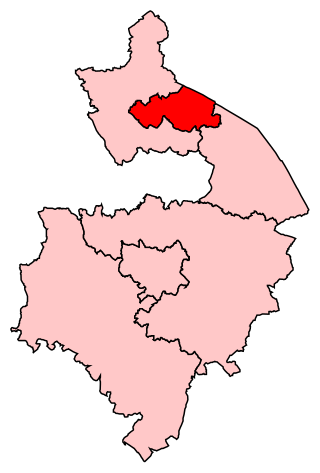
Nuneaton is a constituency represented in the House of Commons of the UK Parliament since 2010 by Marcus Jones, a Conservative. Since 1997, the seat has been seen as an important national bellwether.
North Warwickshire is a constituency represented in the House of Commons of the UK Parliament since 2015 by Craig Tracey, a Conservative.
Rugby is a constituency represented in the House of Commons of the UK Parliament since its 2010 recreation by Mark Pawsey, a Conservative.
Warwickshire County Council elections are held every four years. Warwickshire County Council is the upper-tier authority for the non-metropolitan county of Warwickshire in England. Since the last boundary changes in 2017, 57 councillors have been elected from 57 electoral divisions.
Warwickshire County Council is the county council that governs the non-metropolitan county of Warwickshire in England. Its headquarters are at Shire Hall in the centre of Warwick, the county town. The council's principal functions are county roads and rights of way, social services, education and libraries, but it also provides numerous other local government services in its area.
Nuneaton and Bedworth Borough Council elections are held every other year, with half the council being elected each time. Nuneaton and Bedworth Borough Council is the local authority for the non-metropolitan district of Nuneaton and Bedworth in Warwickshire, England. Since the last boundary changes in 2002, 34 councillors have been elected from 17 wards. Prior to 2002 elections were held three years out of every four, with a third of the council elected each time.
An election to Warwickshire County Council took place on 2 May 2013 as part of the 2013 United Kingdom local elections. 62 councillors were elected from 56 electoral divisions, which returned either one or two county councillors each by first-past-the-post voting for a four-year term of office. The electoral divisions were the same as those used at the previous election in 2009. The election saw the Conservative Party lose overall control of the council.
Craig Paul Tracey is a British Conservative Party politician, who has been the Member of Parliament (MP) for North Warwickshire since his election in 2015 and Deputy Chairman of the Conservative Party since February 2024. Originally from the North East, Tracey settled in North Warwickshire in 1997. After serving as a parish councillor he was selected as the Conservative Party's parliamentary candidate for North Warwickshire in 2014. He unexpectedly increased the Conservative majority in the constituency despite not being the favourite to win. A former member of the Business, Innovation and Skills Select Committee, Tracey has served as co-chair of the All Party Parliamentary Group for Insurance and Financial Services since July 2016.
The 2016 Nuneaton and Bedworth Borough Council election was held on 5 May 2016 as part of the 2016 United Kingdom local elections and alongside the 2016 Warwickshire Police and Crime Commissioner election. As part of the staggered four-year election cycle, half of the borough council was up for re-election in addition to a vacant seat in the Exhall ward. Overall this meant that eighteen council seats were contested.
The 2017 United Kingdom local elections were held on Thursday 4 May 2017. Local elections were held across Great Britain, with elections to 35 English local authorities and all councils in Scotland and Wales.
The 2021 Nuneaton and Bedworth Borough Council election was held on 6 May 2021 as part of the 2021 United Kingdom local elections and alongside elections for Warwickshire County Council and Warwickshire Police and Crime Commissioner. Half of the borough council seats were up for election and the results provided the Conservative Party with a majority on the council, with the party winning all but two seats up for election.
The 2022 Nuneaton and Bedworth Borough Council election was held on 5 May 2022 to elect members of Nuneaton and Bedworth Borough Council. Seventeen seats of the thirty-four seats on the council were elected, as part of the wider 2022 local elections.
The 2024 Nuneaton and Bedworth Borough Council election was held on Thursday 2 May 2024, alongside the other local elections in the United Kingdom being held on the same day. All 38 members of Nuneaton and Bedworth Borough Council in Warwickshire were elected following boundary changes.