Elections to Nuneaton and Bedworth Borough Council took place on 22 May 2014. [1] They coincided with other local elections happening in the UK that day, as well as the 2014 election to the European Parliament.
Labour retained control of the council, gaining 3 seats and winning back Arbury ward that was won by the Conservatives in a December 2013 byelection.
Party | Seats | Gains | Losses | Net gain/loss | Seats % | Votes % | Votes | +/− | |
---|---|---|---|---|---|---|---|---|---|
Labour | 14 | 4 | 0 | +4 | 82.4% | 41.5% | 13069 | -3.4 | |
Conservative | 2 | 0 | 5 | -5 | 11.8% | 29.9% | 9411 | -11 | |
Green | 1 | 1 | 0 | +1 | 5.8% | 6.5% | 2064 | +3.7 | |
UKIP | 0 | 0 | 0 | 0 | 0 | 18.7% | 5882 | +18.7 | |
TUSC | 0 | 0 | 0 | 0 | 0 | 1.6% | 506 | +1.6 | |
BNP | 0 | 0 | 0 | 0 | 0 | 1.0% | 325 | -7.2 | |
English Democrat | 0 | 0 | 0 | 0 | 0 | 0.8% | 238 | +0.5 | |
Independent | 0 | 0 | 3 | -3 | 0 | 0.1% | 28 | +0.1 | |
Total votes cast | 31,523 |
Turnout (approx) |
Total number of seats on the council after the elections:
Party | New council | |
---|---|---|
Labour | 28 | |
Conservative | 3 | |
Green | 2 | |
Independent | 1 | |
Liberal Democrats | 0 | |
Party | Candidate | Votes | % | ±% | |
---|---|---|---|---|---|
Labour | Neil Phillips | 1045 | 54.5 | +4.7 | |
UKIP | Charles Stuart | 409 | 21.3 | +21.3 | |
Conservative | Christopher Eddy | 274 | 14.3 | -9.8 | |
Green | Andrew Saffrey | 121 | 6.3 | +2.9 | |
TUSC | George Clark | 69 | 3.6 | +3.6 | |
Majority | 636 | ||||
Turnout | |||||
Labour hold | Swing | ||||
Party | Candidate | Votes | % | ±% | |
---|---|---|---|---|---|
Labour | Caroline Phillips | 583 | 35.1 | -7.1 | |
Conservative | Jeff Morgan | 542 | 32.7 | -8.7 | |
UKIP | Andrew Hutchings | 403 | 24.3 | +24.3 | |
Green | Maggie Morrissey | 84 | 5.1 | -1.7 | |
BNP | Phill Kimberley | 48 | 2.8 | -6.6 | |
Majority | 41 | ||||
Turnout | |||||
Labour gain from Conservative | Swing | ||||
Party | Candidate | Votes | % | ±% | |
---|---|---|---|---|---|
Labour | Sam Margrave | 690 | 38.1 | -5 | |
Conservative | Martin Heatley | 547 | 30.2 | -16.3 | |
UKIP | Alan Baxter | 397 | 21.9 | +21.9 | |
Green | Sophie Bonner | 111 | 6.1 | +6.1 | |
English Democrat | Stephen Paxton | 44 | 2.4 | +2.4 | |
TUSC | Lucy Newman | 22 | 1.3 | +1.3 | |
Majority | 143 | ||||
Turnout | |||||
Labour gain from Conservative | Swing | ||||
Party | Candidate | Votes | % | ±% | |
---|---|---|---|---|---|
Labour | Tricia Elliott | 695 | 43.7 | -1.1 | |
UKIP | Andrew Hammerscheidt | 402 | 25.3 | +25.3 | |
Conservative | Neal Pointon | 382 | 24.0 | -2.9 | |
BNP | Alwyn Deacon | 71 | 4.5 | -7.1 | |
TUSC | Paul Reilly | 40 | 2.5 | +2.5 | |
Majority | 293 | ||||
Turnout | |||||
Labour hold | Swing | ||||
Party | Candidate | Votes | % | ±% | |
---|---|---|---|---|---|
Labour | John Haynes | 933 | 56.7 | +3.4 | |
Conservative | Damon Brown | 312 | 19.0 | -6.7 | |
BNP | Yvonne Decaon | 206 | 12.5 | -1.8 | |
English Democrat | David Lane | 194 | 11.8 | +5 | |
Majority | 621 | ||||
Turnout | 1645 | ||||
Labour hold | Swing | ||||
Party | Candidate | Votes | % | ±% | |
---|---|---|---|---|---|
Labour | Terry Doherty | 748 | 36.0 | -2.8 | |
Conservative | Des O'Brien | 741 | 35.7 | -16.6 | |
UKIP | Wendy Beard | 589 | 28.3 | +28.3 | |
Majority | 7 | ||||
Turnout | |||||
Labour gain from Conservative | Swing | ||||
Party | Candidate | Votes | % | ±% | |
---|---|---|---|---|---|
Labour | Dennis Harvey | 713 | 50.4 | -1.3 | |
UKIP | Louis John | 440 | 31.0 | +31.0 | |
Conservative | Bethan Eddy | 220 | 15.5 | -13.7 | |
TUSC | Peter Bradley | 43 | 3.1 | -6.6 | |
Majority | 273 | ||||
Turnout | |||||
Labour hold | Swing | ||||
Party | Candidate | Votes | % | ±% | |
---|---|---|---|---|---|
Labour | Roma Ann Taylor | 868 | 46.1 | -1.6 | |
UKIP | Karen Wilson | 521 | 27.7 | +27.7 | |
Conservative | Roger Rowland | 373 | 19.8 | -8.9 | |
Green | Merle Gering | 92 | 4.9 | +4.9 | |
TUSC | Natara Hunter | 30 | 1.5 | +1.5 | |
Majority | 347 | ||||
Turnout | 1884 | ||||
Labour hold | Swing | ||||
Party | Candidate | Votes | % | ±% | |
---|---|---|---|---|---|
Labour | Christine Bennett | 614 | 35.5 | -7.1 | |
UKIP | Tony Grant | 570 | 32.9 | +32.9 | |
Conservative | Phillip Seik-Neilsen | 513 | 29.6 | -15.3 | |
TUSC | Paige Reilly-McGuire | 35 | 2 | +2 | |
Majority | 44 | ||||
Turnout | 1732 | ||||
Labour gain from Conservative | Swing | ||||
Party | Candidate | Votes | % | ±% | |
---|---|---|---|---|---|
Labour | Danny Aldington | 1075 | 58.7 | +8.4 | |
Conservative | Janet Batterbee | 568 | 31.0 | -8.1 | |
TUSC | Eileen Hunter | 187 | 10.3 | +10.3 | |
Majority | 507 | ||||
Turnout | 1830 | ||||
Labour hold | Swing | ||||
Party | Candidate | Votes | % | ±% | |
---|---|---|---|---|---|
Labour | Chris Watkins | 662 | 48% | -4.6 | |
UKIP | Katrina Slomczynksi | 399 | 29 | +29 | |
Conservative | Hayden Walmsley | 279 | 20.2 | -14.9 | |
TUSC | Edward Kay | 38 | 2.8 | +2.8 | |
Majority | 263 | ||||
Turnout | 1378 | ||||
Labour hold | Swing | ||||
Party | Candidate | Votes | % | ±% | |
---|---|---|---|---|---|
Labour | Bob Copland | 1284 | 71 | +7 | |
Conservative | Ann Brown | 525 | 29 | -7 | |
Majority | 759 | ||||
Turnout | 1809 | ||||
Labour hold | Swing | ||||
Party | Candidate | Votes | % | ±% | |
---|---|---|---|---|---|
Labour | Tony Lloyd | 1122 | 58.6 | +8.2 | |
Conservative | Seb Gran | 793 | 41.4 | +5.2 | |
Majority | 329 | ||||
Turnout | 1915 | ||||
Labour hold | Swing | ||||
Party | Candidate | Votes | % | ±% | |
---|---|---|---|---|---|
Conservative | Robert Tromans | 995 | 43.7 | -15.1 | |
Green | Michele Kondakor | 602 | 26.4 | +14.3 | |
UKIP | Mick Gee | 347 | 15.2 | +15.2 | |
Labour | Jack Bonner | 334 | 14.7 | -14.4 | |
Majority | 393 | ||||
Turnout | 2278 | ||||
Conservative hold | Swing | ||||
Party | Candidate | Votes | % | ±% | |
---|---|---|---|---|---|
Green | Ian Bonner | 982 | 38.6 | +27.3 | |
Conservative | Jack Bircher | 800 | 31.4 | -27.2 | |
UKIP | Trevor Beard | 432 | 17 | +17 | |
Labour | Sonja Wilson | 317 | 12.5 | -17.6 | |
TUSC | Brendan McGrath | 13 | |||
Majority | 182 | ||||
Turnout | 2544 | ||||
Green gain from Conservative | Swing | ||||
Party | Candidate | Votes | % | ±% | |
---|---|---|---|---|---|
Labour | Tracy Sheppard | 884 | 54.1 | -6 | |
UKIP | Julie Lewis | 354 | 21.7 | +21.7 | |
Conservative | Andy Sargeant | 268 | 16.4 | -12 | |
Green | Mike Wright | 72 | 4.4 | +4.4 | |
TUSC | Aidan O'Toole | 29 | 1.8 | +1.8 | |
Independent | Scott Harbison | 28 | 1.7 | +1.7 | |
Majority | 530 | ||||
Turnout | 1635 | ||||
Labour hold | Swing | ||||
Party | Candidate | Votes | % | ±% | |
---|---|---|---|---|---|
Conservative | Kristofer Wilson | 1279 | 53.3 | -8.5 | |
UKIP | Alwyn Waine | 619 | 25.8 | +25.8 | |
Labour | Richard Chattaway | 502 | 20.9 | -8.8 | |
Majority | 660 | ||||
Turnout | 2400 | ||||
Conservative hold | Swing | ||||
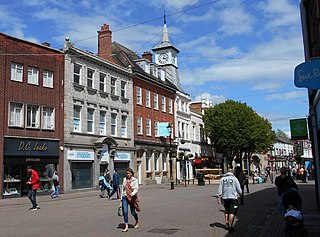
Nuneaton is a market town in the borough of Nuneaton and Bedworth in Warwickshire, England, located adjacent to the county border with Leicestershire to the north-east. Nuneaton's population at the 2021 census was 88,813, making it the largest town in Warwickshire. Nuneaton's larger urban area, which also includes the large adjoining villages of Bulkington and Hartshill had a population of 99,372 in the 2021 census.
Nuneaton and Bedworth is a local government district with borough status in Warwickshire, England. It includes the towns of Nuneaton and Bedworth, as well as a modest rural hinterland including the village of Bulkington.
William John Olner was a British Labour Co-operative politician who served as Member of Parliament (MP) for Nuneaton from 1992 until 2010. Previously, he led Nuneaton Borough Council.
North Warwickshire is a local government district with borough status in Warwickshire, England. The borough includes the two towns of Atherstone and Coleshill, and the large villages of Polesworth, Kingsbury, Hartshill and Water Orton along with smaller villages and surrounding rural areas.
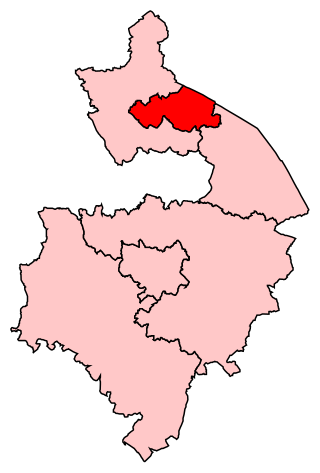
Nuneaton is a constituency represented in the House of Commons of the UK Parliament since 2010 by Marcus Jones, a Conservative. Since 1997, the seat has been seen as an important national bellwether.
North Warwickshire is a constituency represented in the House of Commons of the UK Parliament since 2015 by Craig Tracey, a Conservative.
Whitestone is an area of Nuneaton in Warwickshire, England, approximately two miles south-east of Nuneaton town centre. It is also the name of a ward within the Borough of Nuneaton and Bedworth. The 2011 census gives the population of the ward as 6,877.
Hawkesbury or Hawkesbury Village is a village in the Nuneaton and Bedworth district of Warwickshire, England. It lies between Coventry and Bedworth. In 2021 it had a population of 2,290.
Nuneaton and Bedworth Borough Council elections are held every other year, with half the council being elected each time. Nuneaton and Bedworth Borough Council is the local authority for the non-metropolitan district of Nuneaton and Bedworth in Warwickshire, England. Since the last boundary changes in 2002, 34 councillors have been elected from 17 wards. Prior to 2002 elections were held three years out of every four, with a third of the council elected each time.
Elections to Nuneaton and Bedworth Borough Council were held on 2 May 2002. The whole council was up for election following boundary changes, and the Labour Party retained control of the council.
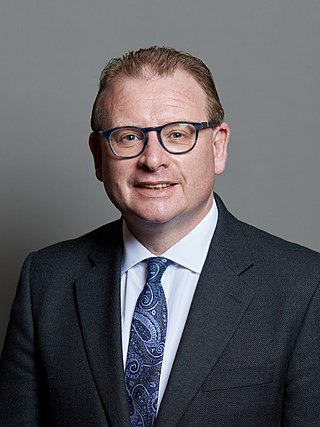
Marcus Charles Jones is an English Conservative Party politician who has been the Member of Parliament (MP) for Nuneaton since 2010. Previously he had been the Leader of Nuneaton and Bedworth Borough Council. He has been serving as Government Deputy Chief Whip and Treasurer of the Household since October 2022.
Elections to North Warwickshire District Council were held on Thursday 5 May 2011.
The 2016 Nuneaton and Bedworth Borough Council election was held on 5 May 2016 as part of the 2016 United Kingdom local elections and alongside the 2016 Warwickshire Police and Crime Commissioner election. As part of the staggered four-year election cycle, half of the borough council was up for re-election in addition to a vacant seat in the Exhall ward. Overall this meant that eighteen council seats were contested.
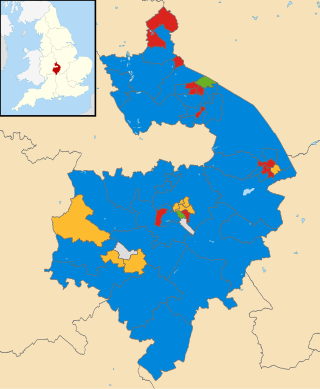
The 2017 Warwickshire County Council election took place as part of the 2017 local elections in the UK. All 57 councillors were elected for single-member electoral divisions for a four-year term. The voting system used was first-past-the-post.
The 2018 United Kingdom local elections were held on Thursday 3 May 2018, with local council elections taking place in all 32 London boroughs, 34 metropolitan boroughs, 67 district and borough councils and 17 unitary authorities. There were also direct elections for the mayoralties of Hackney, Lewisham, Newham, Tower Hamlets and Watford.
The 2018 Nuneaton and Bedworth Borough Council election was held on 3 May 2018, as part of 2018 United Kingdom local elections. Half of the council was up for election and the Labour Party lost overall control of the council to no overall control.
The 2021 Nuneaton and Bedworth Borough Council election was held on 6 May 2021 as part of the 2021 United Kingdom local elections and alongside elections for Warwickshire County Council and Warwickshire Police and Crime Commissioner. Half of the borough council seats were up for election and the results provided the Conservative Party with a majority on the council, with the party winning all but two seats up for election.
The 2022 Nuneaton and Bedworth Borough Council election was held on 5 May 2022 to elect members of Nuneaton and Bedworth Borough Council. Seventeen seats of the thirty-four seats on the council were elected, as part of the wider 2022 local elections.
The 2024 Nuneaton and Bedworth Borough Council election was held on Thursday 2 May 2024, alongside the other local elections in the United Kingdom being held on the same day. All 38 members of Nuneaton and Bedworth Borough Council in Warwickshire were elected following boundary changes.