 | |||||||
| |||||||
 | |||||||
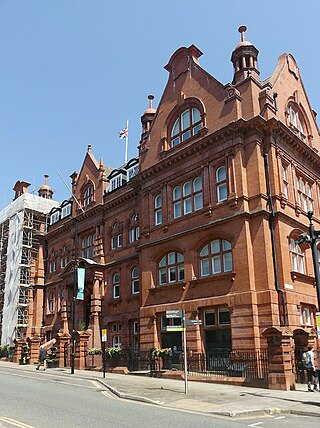
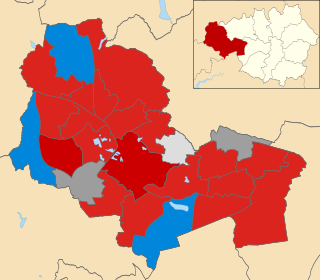
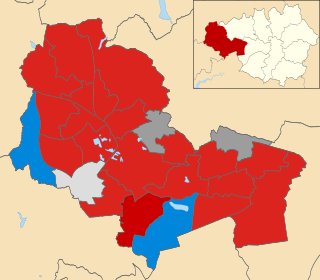
The 2014 Wigan Metropolitan Borough Council election took place on 22 May 2014 to elect members of Wigan Metropolitan Borough Council in England. [1] This was on the same day as other local elections.
 | |||||||
| |||||||
 | |||||||
The 2014 Wigan Metropolitan Borough Council election took place on 22 May 2014 to elect members of Wigan Metropolitan Borough Council in England. [1] This was on the same day as other local elections.
| Party | Number of Candidates |
|---|---|
| Labour Party | 25 |
| Conservative Party | 25 |
| UKIP | 15 |
| Community Action Party | 7 |
| Left Unity | 7 |
| Independents | 7 |
| Green | 3 |
| Liberal Democrats | 2 |
| Wigan Independents | 2 |
| BNP | 1 |
| TUSC | 1 |
| Wigan Real Labour | 1 |
| 2014 Wigan Metropolitan Borough Council election | ||||||||||
|---|---|---|---|---|---|---|---|---|---|---|
| Party | This election | Full council | This election | |||||||
| Seats | Net | Seats % | Other | Total | Total % | Votes | Votes % | +/− | ||
| Labour | 23 | 92 | 39 | 62 | 82.7 | 36,065 | 51.1 | |||
| Conservative | 1 | 4 | 1 | 2 | 2.7 | 11,722 | 16.6 | |||
| Wigan Independents | 1 | 4 | 2 | 3 | 4 | 2,340 | 3.3 | |||
| Independent | 0 | 0 | 8 | 8 | 10.7 | 5,252 | 7.4 | |||
| UKIP | 0 | 0 | 0 | 0 | 0 | 11,327 | 16.0 | |||
| Community Action | 0 | 0 | 0 | 0 | 0 | 1,590 | 2.3 | |||
| Left Unity | 0 | 0 | 0 | 0 | 0 | 796 | 1.1 | |||
| Liberal Democrats | 0 | 0 | 0 | 0 | 0 | 693 | 1.0 | |||
| Green | 0 | 0 | 0 | 0 | 0 | 574 | 0.8 | |||
| BNP | 0 | 0 | 0 | 0 | 0 | 134 | 0.2 | |||
| Wigan Real Labour | 0 | 0 | 0 | 0 | 0 | 63 | 0.1 | |||
| TUSC | 0 | 0 | 0 | 0 | 0 | 56 | 0.1 | |||
| Party | Candidate | Votes | % | ±% | |
|---|---|---|---|---|---|
| Labour | Karen Joyce Aldred | 1,494 | 48.1 | ||
| Independent | John Trevor Higson | 1,106 | 35.6 | ||
| Conservative | Paul Fairhurst | 374 | 12.1 | ||
| Left Unity | Craig Anthony Wilson | 129 | 4.2 | ||
| Majority | 388 | 12.5 | |||
| Turnout | 3,103 | 27.5 | |||
| Labour hold | Swing | ||||
| Party | Candidate | Votes | % | ±% | |
|---|---|---|---|---|---|
| Labour | Barry John Taylor | 1,812 | 67.6 | ||
| Conservative | Nasri Barghothi | 867 | 32.4 | ||
| Majority | 945 | 35.2 | |||
| Turnout | 2,679 | 28.9 | |||
| Labour hold | Swing | ||||
| Party | Candidate | Votes | % | ±% | |
|---|---|---|---|---|---|
| Labour | Pamela Stuart | 1,152 | 49.5 | ||
| Independent | Stuart Andrew Gerrard | 750 | 32.2 | ||
| Conservative | Denise Young | 339 | 14.6 | ||
| Left Unity | Stephen Michael Hall | 85 | 3.7 | ||
| Majority | 402 | 17.3 | |||
| Turnout | 2,326 | 26.7 | |||
| Labour hold | Swing | ||||
| Party | Candidate | Votes | % | ±% | |
|---|---|---|---|---|---|
| Labour | Richard Andrew Barber | 1,596 | 65.0 | ||
| Community Action | Abbey Aspey | 456 | 18.6 | ||
| Conservative | Kathleen Houlton | 403 | 16.4 | ||
| Majority | 1,140 | 46.4 | |||
| Turnout | 2,455 | 27.0 | |||
| Labour hold | Swing | ||||
| Party | Candidate | Votes | % | ±% | |
|---|---|---|---|---|---|
| Labour | Frederick Brown Walker | 1,633 | 70.9 | ||
| Conservative | Ian Aspinall | 671 | 29.1 | ||
| Majority | 962 | 41.8 | |||
| Turnout | 2,304 | 24.9 | |||
| Labour hold | Swing | ||||
| Party | Candidate | Votes | % | ±% | |
|---|---|---|---|---|---|
| Labour | Charles Rigby | 1,955 | 65.5 | ||
| Conservative | Richard Alan Short | 1,032 | 34.5 | ||
| Majority | 923 | 31.0 | |||
| Turnout | 2,987 | 28.6 | |||
| Labour hold | Swing | ||||
| Party | Candidate | Votes | % | ±% | |
|---|---|---|---|---|---|
| Labour | Peter Richard Charles Smith | 2,005 | 75.3 | ||
| Conservative | Andrew John Oxley | 658 | 24.7 | ||
| Majority | 1,347 | 50.6 | |||
| Turnout | 2,663 | 24.9 | |||
| Labour hold | Swing | ||||
| Party | Candidate | Votes | % | ±% | |
|---|---|---|---|---|---|
| Conservative | Edward Noel Houlton | 1,603 | 46.2 | ||
| Labour | Eleanor Mary Blackburn | 1,137 | 32.7 | ||
| UKIP | Sandra Margaret Atherton | 589 | 17.0 | ||
| Community Action | Sophie Aspey | 144 | 4.1 | ||
| Majority | 466 | 13.5 | |||
| Turnout | 3,473 | 35.1 | |||
| Conservative gain from Labour | Swing | ||||
| Party | Candidate | Votes | % | ±% | |
|---|---|---|---|---|---|
| Labour | Joanne Marshall | 1,821 | 65.6 | ||
| Conservative | Margaret Mary Winstanley | 551 | 19.8 | ||
| Liberal Democrats | John Charles Skipworth | 404 | 14.6 | ||
| Majority | 1,270 | 45.8 | |||
| Turnout | 2,776 | 26.4 | |||
| Labour gain from Liberal Democrats | Swing | ||||
| Party | Candidate | Votes | % | ±% | |
|---|---|---|---|---|---|
| Labour | Carl Sweeney | 1,580 | 57.4 | ||
| UKIP | Janet Markland | 760 | 27.6 | ||
| Conservative | Joseph Sheedy | 180 | 6.5 | ||
| BNP | Dennis Shambley | 134 | 4.9 | ||
| Community Action | Susan Brown | 101 | 3.7 | ||
| Majority | 820 | 29.8 | |||
| Turnout | 2,755 | 24.7 | |||
| Labour hold | Swing | ||||
| Party | Candidate | Votes | % | ±% | |
|---|---|---|---|---|---|
| Labour | Nigel Dennis Ash | 1,144 | 42.3 | ||
| UKIP | John Stuart Littler | 591 | 21.9 | ||
| Independent | Peter Merry | 403 | 14.9 | ||
| Community Action | Michael Moulding | 395 | 14.6 | ||
| Conservative | Marie Winstanley | 170 | 6.3 | ||
| Majority | 553 | 20.4 | |||
| Turnout | 2,703 | 29.6 | |||
| Labour hold | Swing | ||||
| Party | Candidate | Votes | % | ±% | |
|---|---|---|---|---|---|
| Labour | Margaret Ann Rampling | 1,190 | 40.2 | ||
| UKIP | Stephen Jones | 724 | 24.5 | ||
| Independent | Brian Merry | 625 | 21.1 | ||
| Liberal Democrats | Catherine Aspey | 289 | 9.8 | ||
| Conservative | Susan Atherton | 131 | 4.4 | ||
| Majority | 466 | 15.7 | |||
| Turnout | 2,959 | 31.8 | |||
| Labour hold | Swing | ||||
| Party | Candidate | Votes | % | ±% | |
|---|---|---|---|---|---|
| Labour | James Talbot | 1,418 | 53.1 | ||
| Independent | Brian Leslie Ellis | 913 | 34.2 | ||
| Conservative | Gerald Joseph Houlton | 263 | 9.8 | ||
| Left Unity | Ian Heyes | 78 | 2.9 | ||
| Majority | 505 | 18.9 | |||
| Turnout | 2,672 | 26.4 | |||
| Labour hold | Swing | ||||
| Party | Candidate | Votes | % | ±% | |
|---|---|---|---|---|---|
| Labour | David Keir Stitt | 1,145 | 43.9 | ||
| Independent | John Melville Vickers | 908 | 34.8 | ||
| Community Action | Kieron Creegan | 325 | 12.5 | ||
| Conservative | Stephen Gerrard Holt | 231 | 8.9 | ||
| Majority | 237 | 9.1 | |||
| Turnout | 2,609 | 29.7 | |||
| Labour hold | Swing | ||||
| Party | Candidate | Votes | % | ±% | |
|---|---|---|---|---|---|
| Labour | David John Arrowsmith | 1,102 | 34.9 | ||
| Conservative | Michael William Winstanley | 1,031 | 32.6 | ||
| UKIP | Philip Easton | 818 | 25.9 | ||
| Green | Norma Stout | 210 | 6.6 | ||
| Majority | 71 | 2.3 | |||
| Turnout | 3,161 | 33.2 | |||
| Labour hold | Swing | ||||
| Party | Candidate | Votes | % | ±% | |
|---|---|---|---|---|---|
| Labour | Clive William Morgan | 1,177 | 44.1 | ||
| UKIP | Andrew Collinson | 874 | 32.7 | ||
| Conservative | Allan Atherton | 263 | 9.8 | ||
| Green | Steven Charles Heyes | 208 | 7.8 | ||
| Community Action | Lee Aspey | 149 | 5.6 | ||
| Majority | 303 | 11.4 | |||
| Turnout | 2,671 | 29.4 | |||
| Labour hold | Swing | ||||
| Party | Candidate | Votes | % | ±% | |
|---|---|---|---|---|---|
| Labour | Patricia Lynne Holland | 1,552 | 60.4 | ||
| UKIP | Gillian Mary Gibson | 813 | 31.7 | ||
| Conservative | Judith Atherton | 203 | 7.9 | ||
| Majority | 739 | 28.7 | |||
| Turnout | 2,568 | 28.2 | |||
| Labour hold | Swing | ||||
| Party | Candidate | Votes | % | ±% | |
|---|---|---|---|---|---|
| Labour | Ronald Josef Conway | 1,581 | 46.0 | ||
| UKIP | Maureen McCoy | 827 | 24.1 | ||
| Aspull and Standish Independent | Janet Brown | 547 | 15.9 | ||
| Conservative | Linda Jane Surples | 393 | 11.4 | ||
| Left Unity | John Stuart Bolton | 88 | 2.6 | ||
| Majority | 754 | 21.9 | |||
| Turnout | 3,436 | 33.2 | |||
| Labour hold | Swing | ||||
| Party | Candidate | Votes | % | ±% | |
|---|---|---|---|---|---|
| Labour | Shirley Ann Dewhurst | 1,502 | 60.0 | ||
| UKIP | Derek Wilkes | 790 | 31.6 | ||
| Conservative | Margaret Atherton | 210 | 8.4 | ||
| Majority | 712 | 28.4 | |||
| Turnout | 2,502 | 24.9 | |||
| Labour hold | Swing | ||||
| Party | Candidate | Votes | % | ±% | |
|---|---|---|---|---|---|
| Labour | James Moodie | 1,397 | 56.8 | ||
| UKIP | Ross Allan Wright | 851 | 34.6 | ||
| Conservative | Raymond Whittingham | 133 | 5.4 | ||
| Left Unity | Janet Elizabeth Phillips | 79 | 3.2 | ||
| Majority | 546 | 22.2 | |||
| Turnout | 2,460 | 26.1 | |||
| Labour hold | Swing | ||||
| Party | Candidate | Votes | % | ±% | |
|---|---|---|---|---|---|
| Labour | Paul Prescott | 1,632 | 62.7 | ||
| UKIP | Alan Freeman | 692 | 26.6 | ||
| Conservative | Jonathon Charles Cartwright | 195 | 7.5 | ||
| Left Unity | Adele Joanne Andrews | 85 | 3.3 | ||
| Majority | 940 | 36.1 | |||
| Turnout | 2,604 | 25.4 | |||
| Labour hold | Swing | ||||
| Party | Candidate | Votes | % | ±% | |
|---|---|---|---|---|---|
| Labour | Michael John Crosby | 1,050 | 33.3 | ||
| Shevington Independents | Angela Maria Bland | 797 | 25.3 | ||
| UKIP | Arnold Jefferson Foster | 797 | 25.3 | ||
| Conservative | Claire Houlton | 353 | 11.2 | ||
| Green | Joseph Robert Rylance | 156 | 4.9 | ||
| Majority | 253 | 8.0 | |||
| Turnout | 3,153 | 33.5 | |||
| Labour hold | Swing | ||||
"Shevington Independents" is a description used by candidates for the Wigan Independents.
| Party | Candidate | Votes | % | ±% | |
|---|---|---|---|---|---|
| Standish Independents | Deborah Fairhurst | 1,543 | 42.6 | ||
| Conservative | David Marcus Jon Ollerton | 701 | 19.4 | ||
| Labour | Deborah Gaye Parkinson | 646 | 17.9 | ||
| UKIP | Joanne Bradley | 590 | 16.3 | ||
| Wigan Real Labour | Emma Jayne Mcgurrin | 63 | 1.7 | ||
| TUSC | Joanne Bradley | 56 | 1.5 | ||
| Community Action | Daniel Willson | 20 | 0.6 | ||
| Majority | 842 | 23.2 | |||
| Turnout | 3,619 | 36.7 | |||
| Standish Independents gain from Labour | |||||
"Standish Independents" is a description used by candidates for the Wigan Independents.
| Party | Candidate | Votes | % | ±% | |
|---|---|---|---|---|---|
| Labour | George Davies | 1,618 | 51.8 | ||
| UKIP | Keith Robert Jones | 893 | 28.6 | ||
| Conservative | Callum David Owen Chadwick | 614 | 19.6 | ||
| Majority | 725 | 23.2 | |||
| Turnout | 3,125 | 33.2 | |||
| Labour hold | Swing | ||||
| Party | Candidate | Votes | % | ±% | |
|---|---|---|---|---|---|
| Labour | Pyhllis Mary Cullen | 1,726 | 60.6 | ||
| UKIP | John Stanley Atherton | 718 | 25.2 | ||
| Left Unity | Hazel Duffy | 252 | 8.8 | ||
| Conservative | Jean Peet | 153 | 5.4 | ||
| Majority | 1,008 | 35.4 | |||
| Turnout | 2,849 | 28.1 | |||
| Labour hold | Swing | ||||
| Party | Candidate | Votes | % | ±% | |
|---|---|---|---|---|---|
| Labour | Maggie Skilling | 874 | 59.3 | ||
| UKIP | Derek Wilkes | 452 | 30.7 | ||
| Conservative | Margaret Atherton | 80 | 5.4 | ||
| Green | Damien Hendry | 37 | 2.5 | ||
| Community Action | Michael Moulding | 29 | 2.0 | ||
| Majority | 422 | 28.6 | |||
| Turnout | 1,474 | 14.5 | |||
| Labour hold | Swing | ||||

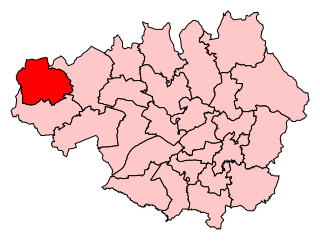
The Metropolitan Borough of Wigan is a metropolitan borough of Greater Manchester, England. It is named after its largest town, Wigan but covers a far larger area which includes the towns of Atherton, Ashton-in-Makerfield, Golborne, Hindley, Ince-in-Makerfield, Leigh and Tyldesley. The borough also covers the villages and suburbs of Abram, Aspull, Astley, Bryn, Hindley Green, Lowton, Mosley Common, Orrell, Pemberton, Shevington, Standish, Winstanley and Worsley Mesnes. The borough is also the second-most populous district in Greater Manchester.

Wigan is a constituency in Greater Manchester, represented in the House of Commons of the UK Parliament since 2010 by Lisa Nandy of the Labour Party, who currently serves as the Shadow Cabinet Minister for International Development.

The Community Action Party was a minor political party in the United Kingdom, mostly active in Greater Manchester and Merseyside. It advocated free health care and education provision, a managed public transport infrastructure free to all at the point of use and a moratorium on the use of green belt land for building. It also supported a zero tolerance policy toward crime, and was against the introduction of identity cards and recent anti-terrorist legislation on civil liberties grounds.

Wigan Metropolitan Borough Council elections are generally held three years out of every four, with a third of the council being elected each time. Wigan Metropolitan Borough Council, generally known as Wigan Council, is the local authority for the metropolitan borough of Wigan in Greater Manchester, England. Since the last boundary changes in 2004, 75 councillors have been elected from 25 wards.

The 1973 Wigan Council elections for the First Wigan Metropolitan Borough Council were held on 10 May 1973, with the entirety of the 72 seat council - three seats for each of the 24 wards - up for vote. It was the first council election as the newly formed metropolitan borough under a new constitution. The Local Government Act 1972 stipulated that the elected members were to shadow and eventually take over from the predecessor corporation on 1 April 1974. The order in which the councillors were elected dictated their term serving, with third-place candidates serving two years and up for re-election in 1975, second-placed three years expiring in 1976 and 1st-placed five years until 1978.
The by-thirds 2015 Rotherham Metropolitan Borough Council election took place on Thursday 7 May 2015, to elect approximately one third of the members of the Rotherham Metropolitan Borough Council in England as part of the 2015 United Kingdom local elections held on the same day as the general election. All seats contested at this election were last contested in 2011, and of these, 20 were held by Labour Party councillors.

The 2015 Wigan Metropolitan Borough Council election took place on 7 May 2015 to elect members of Wigan Metropolitan Borough Council in England. This was on the same day as other local elections and the general election.
The 1964 Camden Council election took place on 7 May 1964 to elect members of Camden London Borough Council in London, England. The whole council was up for election and the Labour Party gained control of the council.
The 1964 Tower Hamlets Council election took place on 7 May 1964 to elect members of Tower Hamlets London Borough Council in London, England. The whole council was up for election and the Labour party won control.
Elections for the London Borough of Merton were held on 8 May 1986 to elect members of Merton London Borough Council in London, England. This was on the same day as other local elections in England and Scotland.

The 2016 Wakefield Metropolitan Borough Council election took place on 5 May 2016 to elect members of Wakefield Metropolitan District Council in England. This was on the same day as other local elections. The Labour Party and the Conservative Party fielded a full slate of 21 candidates, with UK Independence Party putting forward 11 candidates, 9 Liberal Democrat candidates, 6 Trade Union and Socialist Coalition candidates, 5 Yorkshire First candidates, 3 Green Party candidates and 4 Independent candidates.

The 2016 Wigan Metropolitan Borough Council election took place on 5 May 2016 to elect members of Wigan Metropolitan Borough Council in England. This was on the same day as other local elections.

The 2018 Wigan Metropolitan Borough Council election took place on 3 May 2018 to elect members of Wigan Metropolitan Borough Council in England. This was on the same day as other local elections.

The 2019 Wigan Metropolitan Borough Council election took place on Thursday 2 May 2019 to elect members of Wigan Metropolitan Borough Council in England. This was on the same day as other local elections.

The 2019 Wakefield Metropolitan Borough Council election took place on 2 May 2019 to elect members of Wakefield Metropolitan District Council in England. The election was held on the same day as other local elections. The Labour Party and the Conservative Party fielded a full slate of 21 candidates, as well as 14 Liberal Democrats, 8 Yorkshire Party candidates, 7 UK Independence Party candidates, 6 Green Party candidates, 6 Independent candidates, 1 Socialist Alternative candidate and 1 Democrats and Veteran's Party candidate.

The 2021 Wigan Metropolitan Borough Council election took place on 6 May 2021 to elect members of Wigan Metropolitan Borough Council in England. This election was held on the same day as other local elections. The election was originally due to take place on 7 May 2020, but was postponed due to the COVID-19 pandemic. A by-election was held on the same day in Orrell ward to fill the seat left vacant by the death of Conservative councillor Richard Clayton.

The 2022 St Helens Metropolitan Borough Council election took place on 5 May 2022. Due to boundary changes, all 48 councillors were elected at the same time, with the council moving to a system of all-out elections every four years. The election took place alongside other local elections across the United Kingdom.

The 2022 Wigan Metropolitan Borough Council election took place on 5 May 2022 to elect members of Wigan Metropolitan Borough Council in England. This election was held on the same day as other local elections. A by-election was held on the same day in Leigh East ward to fill the seat left vacant by the death of Labour councillor Anita Thorpe.

The 2023 Wigan Metropolitan Borough Council elections took place on 4 May 2023 alongside other local elections in the United Kingdom. Due to boundary changes all 75 seats on Wigan Metropolitan Borough Council were contested.