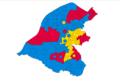
Results maps
 1973 results map
 1975 results map
 1976 results map
 1978 results map
 1979 results map
 1980 results map
 1982 results map
 1983 results map
 1984 results map
 1986 results map
 1987 results map
 1988 results map
 1990 results map
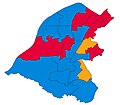 1991 results map
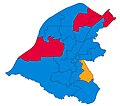 1992 results map
 1994 results map
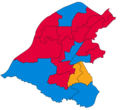 1995 results map
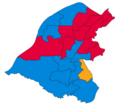 1996 results map
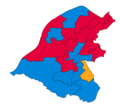 1998 results map
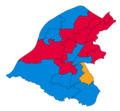 1999 results map
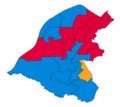 2000 results map
 2002 results map
 2003 results map
 2004 results map
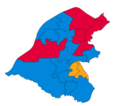 2006 results map
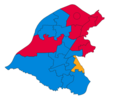 2007 results map
 2008 results map
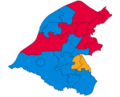 2010 results map
 2011 results map
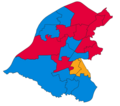 2012 results map
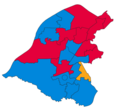 2014 results map
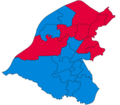 2015 results map
 2016 results map
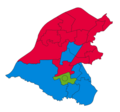 2018 results map
 2019 results map
 2021 results map
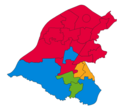 2022 results map
 2023 results map
 2024 results map


