This article needs additional citations for verification .(March 2020) |
| |||||||||||||||||||||||||||||||||||||||||||||||||
| |||||||||||||||||||||||||||||||||||||||||||||||||
21 of 63 seats to Trafford Metropolitan Borough Council 32 seats needed for a majority | |||||||||||||||||||||||||||||||||||||||||||||||||
---|---|---|---|---|---|---|---|---|---|---|---|---|---|---|---|---|---|---|---|---|---|---|---|---|---|---|---|---|---|---|---|---|---|---|---|---|---|---|---|---|---|---|---|---|---|---|---|---|---|
| |||||||||||||||||||||||||||||||||||||||||||||||||
Map of results of 1994 election | |||||||||||||||||||||||||||||||||||||||||||||||||
|
Elections to Trafford Council were held on 5 May 1994. One-third of the council was up for election, with each successful candidate to serve a four-year term of office, expiring in 1998. The Conservative party retained overall control of the council. [1]
Party | Votes | Seats | Full Council | |||||||
Conservative Party | 28,764 (38.1%) | 15.3 | 8 (42.9%) | 8 / 21 | 2 | 35 (55.6%) | 35 / 63 | |||
Labour Party | 30,896 (41.0%) | 10.5 | 11 (52.4%) | 11 / 21 | 1 | 23 (36.5%) | 23 / 63 | |||
Liberal Democrats | 15,648 (20.7%) | 5.4 | 2 (9.5%) | 2 / 21 | 1 | 5 (7.9%) | 5 / 63 | |||
Green Party | 134 (0.2%) | 0.5 | 0 (0.0%) | 0 / 21 | 0 (0.0%) | 0 / 63 |
23 | 5 | 35 |
Party | Candidate | Votes | % | ±% | |
---|---|---|---|---|---|
Conservative | R. A. Mrozinski | 1,642 | 43.5 | -14.7 | |
Labour | J. Torpey | 1,573 | 41.6 | +13.1 | |
Liberal Democrats | K. Clarke | 564 | 14.9 | +4.5 | |
Majority | 69 | 1.8 | -27.9 | ||
Turnout | 3,779 | 43.4 | +2.6 | ||
Conservative hold | Swing | ||||
Party | Candidate | Votes | % | ±% | |
---|---|---|---|---|---|
Conservative | M. C. Harney* | 2,018 | 52.1 | -21.6 | |
Liberal Democrats | N. S. Harrison | 1,046 | 27.0 | +12.0 | |
Labour | H. F. Busteed | 809 | 20.9 | +9.6 | |
Majority | 972 | 25.1 | -33.6 | ||
Turnout | 3,873 | 41.4 | +1.6 | ||
Conservative hold | Swing | ||||
Party | Candidate | Votes | % | ±% | |
---|---|---|---|---|---|
Labour | J. E. Baugh* | 2,068 | 49.1 | +17.2 | |
Conservative | L. Leggett | 1,522 | 36.1 | -18.7 | |
Liberal Democrats | B. C. Lynch | 623 | 14.8 | +1.5 | |
Majority | 546 | 13.0 | -9.9 | ||
Turnout | 4,213 | 47.0 | +6.0 | ||
Labour hold | Swing | ||||
Party | Candidate | Votes | % | ±% | |
---|---|---|---|---|---|
Conservative | R. Barber | 1,736 | 48.4 | -20.1 | |
Liberal Democrats | A. Rhodes | 1,095 | 30.5 | +14.2 | |
Labour | T. G. Crewe | 754 | 21.0 | +7.9 | |
Majority | 641 | 17.9 | -33.7 | ||
Turnout | 3,585 | 45.3 | -6.3 | ||
Conservative hold | Swing | ||||
Party | Candidate | Votes | % | ±% | |
---|---|---|---|---|---|
Labour | S. M. Batty | 1,368 | 55.2 | -13.7 | |
Liberal Democrats | F. Holland* | 1,111 | 44.8 | +13.7 | |
Majority | 257 | 10.4 | -27.5 | ||
Turnout | 2,479 | 39.0 | +10.0 | ||
Labour gain from Liberal Democrats | Swing | ||||
Party | Candidate | Votes | % | ±% | |
---|---|---|---|---|---|
Labour | P. W. Mitchell | 1,879 | 76.8 | +14.7 | |
Conservative | J. M. Ansari | 434 | 17.7 | -14.5 | |
Green | D. W. Alexander | 134 | 5.5 | -0.2 | |
Majority | 1,445 | 59.1 | +29.2 | ||
Turnout | 2,447 | 31.1 | +4.2 | ||
Labour hold | Swing | ||||
Party | Candidate | Votes | % | ±% | |
---|---|---|---|---|---|
Conservative | E. R. Eadie | 1,888 | 52.5 | -14.2 | |
Labour | S. Hesford | 1,401 | 39.0 | +11.9 | |
Liberal Democrats | F. A. Cameron | 305 | 8.5 | +2.3 | |
Majority | 487 | 13.6 | -26.1 | ||
Turnout | 3,594 | 48.5 | +7.9 | ||
Conservative hold | Swing | ||||
Party | Candidate | Votes | % | ±% | |
---|---|---|---|---|---|
Conservative | M. Bates* | 1,653 | 45.7 | -10.9 | |
Labour | A. Stringer | 1,578 | 43.6 | +5.8 | |
Liberal Democrats | D. M. Browne | 388 | 10.7 | +5.2 | |
Majority | 75 | 2.1 | -16.7 | ||
Turnout | 3,619 | 45.9 | +2.7 | ||
Conservative hold | Swing | ||||
Party | Candidate | Votes | % | ±% | |
---|---|---|---|---|---|
Conservative | T. R. Seddon* | 1,625 | 40.8 | -11.4 | |
Labour | J. D. Chapman-Barker | 1,238 | 31.1 | +6.5 | |
Liberal Democrats | A. Vernon | 1,115 | 28.0 | +4.8 | |
Majority | 387 | 9.7 | -18.0 | ||
Turnout | 3,978 | 53.7 | +5.1 | ||
Conservative hold | Swing | ||||
Party | Candidate | Votes | % | ±% | |
---|---|---|---|---|---|
Conservative | M. Lucas | 2,015 | 51.0 | -18.9 | |
Liberal Democrats | C. S. Fink | 1,528 | 38.7 | +15.6 | |
Labour | R. E. Lucas | 409 | 10.3 | +3.3 | |
Majority | 487 | 12.3 | -34.5 | ||
Turnout | 3,952 | 46.2 | +3.5 | ||
Conservative hold | Swing | ||||
Party | Candidate | Votes | % | ±% | |
---|---|---|---|---|---|
Labour | J. P. Hagan* | 1,779 | 56.1 | +12.7 | |
Conservative | E. J. Kelson | 1,137 | 35.9 | -17.7 | |
Liberal Democrats | C. R. Walmsley | 253 | 8.0 | +8.0 | |
Majority | 642 | 20.3 | +10.2 | ||
Turnout | 3,169 | 42.9 | +2.0 | ||
Labour hold | Swing | ||||
Party | Candidate | Votes | % | ±% | |
---|---|---|---|---|---|
Conservative | B. D. Rigby | 2,193 | 49.0 | -20.6 | |
Labour | A. Guttridge | 1,303 | 29.1 | +9.4 | |
Liberal Democrats | R. M. Elliott | 975 | 21.8 | +11.1 | |
Majority | 890 | 19.9 | -30.0 | ||
Turnout | 4,471 | 47.4 | +5.4 | ||
Conservative hold | Swing | ||||
Party | Candidate | Votes | % | ±% | |
---|---|---|---|---|---|
Labour | J. R. Haydock* | 1,415 | 58.8 | +11.4 | |
Conservative | C. H. Davenport | 772 | 32.1 | -14.0 | |
Liberal Democrats | S. O. Bowater | 218 | 9.1 | +2.5 | |
Majority | 643 | 26.7 | +25.4 | ||
Turnout | 2,405 | 40.6 | +6.6 | ||
Labour hold | Swing | ||||
Party | Candidate | Votes | % | ±% | |
---|---|---|---|---|---|
Labour | B. Brotherton | 1,454 | 37.3 | +11.1 | |
Liberal Democrats | C. Smith | 1,267 | 32.5 | +2.3 | |
Conservative | R. C. Heads | 1,181 | 30.3 | -13.3 | |
Majority | 187 | 4.8 | -8.7 | ||
Turnout | 3,902 | 50.4 | +3.4 | ||
Labour hold | Swing | ||||
Party | Candidate | Votes | % | ±% | |
---|---|---|---|---|---|
Labour | P. Gratrix* | 1,697 | 46.2 | +6.8 | |
Conservative | C. J. J. Lynch | 1,403 | 38.2 | -5.9 | |
Liberal Democrats | M. E. Clarke | 572 | 15.6 | -0.9 | |
Majority | 294 | 8.0 | +3.3 | ||
Turnout | 3,672 | 48.0 | +5.8 | ||
Labour hold | Swing | ||||
Party | Candidate | Votes | % | ±% | |
---|---|---|---|---|---|
Labour | L. T. Murkin* | 2,232 | 57.5 | +11.9 | |
Conservative | J. Nicholas | 1,247 | 32.1 | -15.4 | |
Liberal Democrats | T. J. P. Corbett | 402 | 10.4 | +3.4 | |
Majority | 1,016 | 26.2 | +24.3 | ||
Turnout | 3,881 | 43.6 | +7.0 | ||
Labour hold | Swing | ||||
Party | Candidate | Votes | % | ±% | |
---|---|---|---|---|---|
Labour | S. A. Adshead* | 2,105 | 58.0 | +15.3 | |
Conservative | J. T. Kelly | 1,207 | 33.3 | -19.9 | |
Liberal Democrats | J. M. Walmsley | 316 | 8.7 | +5.5 | |
Majority | 898 | 24.8 | +14.3 | ||
Turnout | 3,628 | 46.6 | -1.8 | ||
Labour hold | Swing | ||||
Party | Candidate | Votes | % | ±% | |
---|---|---|---|---|---|
Labour | B. J. Hughes* | 1,779 | 77.6 | +14.4 | |
Conservative | C. J. Levenston | 515 | 22.4 | -10.9 | |
Majority | 1,264 | 55.1 | +25.1 | ||
Turnout | 2,294 | 35.4 | +6.3 | ||
Labour hold | Swing | ||||
Party | Candidate | Votes | % | ±% | |
---|---|---|---|---|---|
Liberal Democrats | D. C. R. Horstead | 1,684 | 40.0 | +13.2 | |
Conservative | P. A. Dixon* | 1,610 | 38.3 | -17.6 | |
Labour | A. D. McNee | 912 | 21.7 | +4.4 | |
Majority | 74 | 1.8 | -27.3 | ||
Turnout | 4,206 | 48.3 | +6.3 | ||
Liberal Democrats gain from Conservative | Swing | ||||
Party | Candidate | Votes | % | ±% | |
---|---|---|---|---|---|
Labour | D. Acton* | 2,244 | 60.6 | +20.2 | |
Conservative | A. Smith | 1,461 | 39.4 | -16.3 | |
Majority | 783 | 21.1 | +5.8 | ||
Turnout | 3,705 | 49.8 | +2.3 | ||
Labour hold | Swing | ||||
Party | Candidate | Votes | % | ±% | |
---|---|---|---|---|---|
Liberal Democrats | J. E. Brophy | 2,186 | 47.6 | -0.9 | |
Conservative | A. Bowker* | 1,505 | 32.8 | +0.6 | |
Labour | S. N. Humby | 899 | 19.6 | +0.3 | |
Majority | 681 | 14.8 | -1.5 | ||
Turnout | 4,590 | 49.5 | +1.8 | ||
Liberal Democrats gain from Conservative | Swing | ||||
Elections to Tower Hamlets London Borough Council were held on 5 May 1994. The whole council was up for election and the Labour party gained overall control of the council from the Liberal Democrats.
The 1994 Newham London Borough Council election to the Newham London Borough Council was held on 5 May 1994. The whole council was up for election. Turnout was 37.2%. Labour maintained its overwhelming majority.
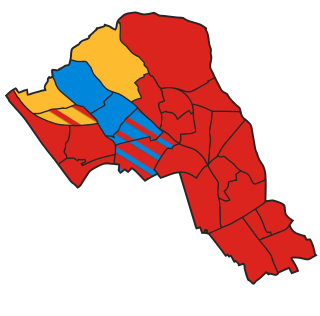
The 1994 Camden Council election took place on 5 May 1994 to elect members of Camden London Borough Council in London, England. The whole council was up for election. Labour stayed in overall control of the council, with both them and the Liberal Democrats making gains at the expense of the Conservatives in the north-west of the borough.
The 1994 Barking and Dagenham Borough Council election took place on 5 May 1994 to elect members of Barking and Dagenham London Borough Council in London, England. The whole council was up for election and the Labour Party stayed in overall control of the council.
The 1994 Croydon Council election took place on 5 May 1994 to elect members of Croydon London Borough Council in London, England. The whole council was up for election and the Labour party gained overall control of the council.
The 1994 Ealing Council election took place on 5 May 1994 to elect members of Ealing London Borough Council in London, England. The whole council was up for election and the Labour party gained overall control of the council.
The 1994 Enfield Council election took place on 5 May 1994 to elect members of Enfield London Borough Council in London, England. The whole council was up for election and the Labour party gained overall control of the council. This was the first Labour win in Enfield since 1964, ending 26 years of Conservative administration.
The 1994 Greenwich Council election took place on 5 May 1994 to elect members of Greenwich London Borough Council in London, England. The whole council was up for election and the Labour party stayed in overall control of the council.
The 1994 Hackney Council election took place on 5 May 1994 to elect members of Hackney London Borough Council in London, England. The whole council was up for election and the Labour party gained overall control of the council.
The 1994 Hammersmith and Fulham Borough Council election took place on 5 May 1994 to elect members of Hammersmith and Fulham London Borough Council in London, England. The whole council was up for election and the Labour Party regained overall control of the council, which it had lost during the previous council term.
The 1994 Havering Council election took place on 5 May 1994 to elect members of Havering London Borough Council in London, England. The whole council was up for election and the council stayed in no overall control.
The 1994 Hillingdon Council election took place on 5 May 1994 to elect members of Hillingdon London Borough Council in London, England. The whole council was up for election and the Labour Party gained overall control of the council.
The 1994 Hounslow Council election took place on 5 May 1994 to elect members of Hounslow London Borough Council in London, England. The whole council was up for election and the Labour party stayed in overall control of the council.
The 1994 Islington Council election took place on 5 May 1994 to elect members of Islington London Borough Council in London, England. The whole council was up for election and the Labour party stayed in overall control of the council.
The 1994 Kensington and Chelsea Council election took place on 5 May 1994 to elect members of Kensington and Chelsea London Borough Council in London, England. The whole council was up for election and the Conservative party stayed in overall control of the council.
The 1994 Kingston upon Thames Council election took place on 5 May 1994 to elect members of Kingston upon Thames London Borough Council in London, England. The whole council was up for election and the Liberal Democrats gained overall control of the council.
Elections for the London Borough of Merton were held on 5 May 1994 to elect members of Merton London Borough Council in London, England. This was on the same day as other local elections in England.
The 1994 Richmond upon Thames Council election took place on 5 May 1994 to elect members of Richmond upon Thames London Borough Council in London, England. The whole council was up for election and the Liberal Democrats stayed in overall control of the council.
The 1994 Waltham Forest Council election took place on 5 May 1994 to elect members of Waltham Forest London Borough Council in London, England. The whole council was up for election and the council went into no overall control.
The 1994 Westminster Council election took place on 5 May 1994 to elect members of Westminster City Council in London, England. The whole council was up for election and the Conservative party stayed in overall control of the council.