![]() | |||||||||||||||||||||||||||||||||||||||||
| |||||||||||||||||||||||||||||||||||||||||
14 out of 42 seats to Cambridge City Council 22 seats needed for a majority | |||||||||||||||||||||||||||||||||||||||||
---|---|---|---|---|---|---|---|---|---|---|---|---|---|---|---|---|---|---|---|---|---|---|---|---|---|---|---|---|---|---|---|---|---|---|---|---|---|---|---|---|---|
Turnout | 44.1% (![]() | ||||||||||||||||||||||||||||||||||||||||
| |||||||||||||||||||||||||||||||||||||||||
![]() Winner of each seat at the 1994 Cambridge City Council election | |||||||||||||||||||||||||||||||||||||||||
|
The 1994 Cambridge City Council election took place on 5 May 1994 to elect members of Cambridge City Council in Cambridge, Cambridgeshire, England. [1] This was on the same day as other local elections across England.
1994 Cambridge City Council election | ||||||||||
---|---|---|---|---|---|---|---|---|---|---|
Party | This election | Full council | This election | |||||||
Seats | Net | Seats % | Other | Total | Total % | Votes | Votes % | +/− | ||
Labour | 7 | ![]() | 50.0 | 10 | 17 | 40.5 | 14,843 | 41.0 | +4.7 | |
Liberal Democrats | 7 | ![]() | 50.0 | 8 | 15 | 35.7 | 14,159 | 39.1 | +12.1 | |
Conservative | 0 | ![]() | 0.0 | 10 | 10 | 23.8 | 7,048 | 19.5 | –15.0 | |
Green | 0 | ![]() | 0.0 | 0 | 0 | 0.0 | 118 | 0.3 | –1.8 |
Party | Candidate | Votes | % | ±% | |
---|---|---|---|---|---|
Labour | Anthony Barnes* | 965 | 66.2 | +8.6 | |
Conservative | Jeremy Froggett | 253 | 17.4 | –17.3 | |
Liberal Democrats | Joan Molyneux-Hill | 239 | 16.4 | +8.6 | |
Majority | 712 | 48.9 | +26.0 | ||
Turnout | 1,457 | 30.7 | +1.4 | ||
Registered electors | 4,756 | ||||
Labour hold | Swing | ![]() |
Party | Candidate | Votes | % | ±% | |
---|---|---|---|---|---|
Labour | Anthony Colombo | 1,200 | 53.3 | +11.6 | |
Conservative | Thomas McGuire | 583 | 25.9 | –19.5 | |
Liberal Democrats | Adrian Wrigley | 467 | 20.8 | +7.9 | |
Majority | 617 | 27.4 | N/A | ||
Turnout | 2,250 | 43.3 | +3.6 | ||
Registered electors | 5,201 | ||||
Labour hold | Swing | ![]() |
Party | Candidate | Votes | % | ±% | |
---|---|---|---|---|---|
Liberal Democrats | Alan Charlesworth* | 1,597 | 53.5 | +6.5 | |
Labour | Angela Smith | 739 | 24.8 | +7.7 | |
Conservative | Jacqueline Mitton | 647 | 21.7 | –14.3 | |
Majority | 858 | 28.8 | +17.8 | ||
Turnout | 2,983 | 46.8 | +0.9 | ||
Registered electors | 6,382 | ||||
Liberal Democrats hold | Swing | ![]() |
Party | Candidate | Votes | % | ±% | |
---|---|---|---|---|---|
Labour | Alexander MacEachern* | 1,391 | 52.5 | +13.8 | |
Conservative | Jason Webb | 888 | 33.5 | –13.9 | |
Liberal Democrats | Ashley Woodford | 370 | 14.0 | +5.3 | |
Majority | 503 | 19.0 | N/A | ||
Turnout | 2,649 | 49.3 | +2.0 | ||
Registered electors | 5,389 | ||||
Labour hold | Swing | ![]() |
Party | Candidate | Votes | % | ±% | |
---|---|---|---|---|---|
Labour | Ruth Bagnall | 1,545 | 61.0 | +14.9 | |
Conservative | Stephen George | 607 | 24.0 | –20.3 | |
Liberal Democrats | Andrew Hoddinott | 382 | 15.1 | +5.5 | |
Majority | 938 | 37.0 | +35.2 | ||
Turnout | 2,534 | 44.4 | +0.1 | ||
Registered electors | 5,731 | ||||
Labour hold | Swing | ![]() |
Party | Candidate | Votes | % | ±% | |
---|---|---|---|---|---|
Liberal Democrats | Sheila Stickley | 1,402 | 46.0 | +10.5 | |
Labour | Christopher Wilson | 1,196 | 39.2 | +8.7 | |
Conservative | Colin Havercroft | 453 | 14.8 | –19.2 | |
Majority | 206 | 6.8 | +5.3 | ||
Turnout | 3,051 | 45.6 | +2.5 | ||
Registered electors | 6,698 | ||||
Liberal Democrats gain from Labour | Swing | ![]() |
Party | Candidate | Votes | % | ±% | |
---|---|---|---|---|---|
Labour | Angela Ratcliffe | 1,000 | 64.8 | +6.6 | |
Liberal Democrats | Edna Howarth | 314 | 20.3 | +7.0 | |
Conservative | Sally Black | 229 | 14.8 | –13.7 | |
Majority | 686 | 44.5 | N/A | ||
Turnout | 1,543 | 31.3 | +4.5 | ||
Registered electors | 4,922 | ||||
Labour hold | Swing | ![]() |
Party | Candidate | Votes | % | ±% | |
---|---|---|---|---|---|
Liberal Democrats | Joye Rosenstiel* | 1,502 | 61.0 | +11.8 | |
Labour | David Blunt | 676 | 27.4 | –4.4 | |
Conservative | James Strachan | 286 | 11.6 | –3.3 | |
Majority | 826 | 33.5 | +16.2 | ||
Turnout | 2,464 | 40.5 | –3.5 | ||
Registered electors | 6,107 | ||||
Liberal Democrats hold | Swing | ![]() |
Party | Candidate | Votes | % | ±% | |
---|---|---|---|---|---|
Liberal Democrats | Christopher Larkin | 1,477 | 46.7 | +11.4 | |
Labour | Asha Patel | 1,290 | 40.8 | +8.7 | |
Conservative | Graham Stuart | 394 | 12.5 | –12.4 | |
Majority | 187 | 5.9 | +2.7 | ||
Turnout | 3,161 | 43.1 | +1.5 | ||
Registered electors | 7,370 | ||||
Liberal Democrats gain from Labour | Swing | ![]() |
Party | Candidate | Votes | % | ±% | |
---|---|---|---|---|---|
Labour | Kevin Blencowe | 1,387 | 49.6 | –2.9 | |
Liberal Democrats | Catherine Bowden | 1,122 | 40.2 | +20.6 | |
Conservative | Valerie Clayton | 285 | 10.2 | –10.6 | |
Majority | 265 | 9.5 | –22.1 | ||
Turnout | 2,794 | 44.4 | +6.0 | ||
Registered electors | 6,326 | ||||
Labour hold | Swing | ![]() |
Party | Candidate | Votes | % | ±% | |
---|---|---|---|---|---|
Liberal Democrats | Amanda Taylor | 1,703 | 51.1 | +15.1 | |
Conservative | Chris Gough-Goodman* | 913 | 27.4 | –16.8 | |
Labour | Caroline Smith | 717 | 21.5 | +1.7 | |
Majority | 790 | 23.7 | N/A | ||
Turnout | 3,333 | 58.0 | +5.4 | ||
Registered electors | 5,762 | ||||
Liberal Democrats gain from Conservative | Swing | ![]() |
Party | Candidate | Votes | % | ±% | |
---|---|---|---|---|---|
Labour | John Ratcliff | 1,344 | 50.6 | –5.2 | |
Liberal Democrats | Catherine Smart | 1,036 | 39.0 | +24.4 | |
Conservative | Stephen Wren | 160 | 6.0 | –15.2 | |
Green | Ian Miller | 118 | 4.4 | –4.0 | |
Majority | 308 | 11.6 | –23.1 | ||
Turnout | 2,658 | 46.8 | +13.4 | ||
Registered electors | 5,700 | ||||
Labour hold | Swing | ![]() |
Party | Candidate | Votes | % | ±% | |
---|---|---|---|---|---|
Liberal Democrats | Stephen Warde | 1,201 | 46.2 | +18.4 | |
Conservative | Margaret Hoskins* | 995 | 38.3 | –17.9 | |
Labour | Colin Dickins | 402 | 15.5 | –0.5 | |
Majority | 206 | 7.9 | N/A | ||
Turnout | 2,598 | 43.7 | +6.0 | ||
Registered electors | 5,953 | ||||
Liberal Democrats gain from Conservative | Swing | ![]() |
Party | Candidate | Votes | % | ±% | |
---|---|---|---|---|---|
Liberal Democrats | Ian Nimmo-Smith* | 1,347 | 50.0 | +12.3 | |
Labour | Paul Humber | 991 | 36.8 | +4.0 | |
Conservative | Dianne Walton | 355 | 13.2 | –16.2 | |
Majority | 356 | 13.2 | +8.3 | ||
Turnout | 2,693 | 47.8 | –1.7 | ||
Registered electors | 5,655 | ||||
Liberal Democrats hold | Swing | ![]() |
East Cambridgeshire is a local government district in Cambridgeshire, England. Its council is based in the city of Ely. The district also contains the towns of Littleport and Soham and surrounding rural areas, including parts of the Fens.
Andrew Nicholas Duff is a British politician who presided over the Union of European Federalists (UEF) from 2008 to 2013. A member of the Liberal Democrats, he served as a Member of the European Parliament (MEP) for the East of England from 1999 to 2014.
South Cambridgeshire is a constituency represented in the House of Commons of the UK Parliament since the 2024 general election by Pippa Heylings of the Liberal Democrats.
One third of Cambridge City Council is elected each year, followed by one year without election.
Cambridge City Council is the local authority for Cambridge, a non-metropolitan district with city status in Cambridgeshire, England. The council has been under Labour majority control since 2014. It meets at Cambridge Guildhall. The council is a member of the Cambridgeshire and Peterborough Combined Authority.
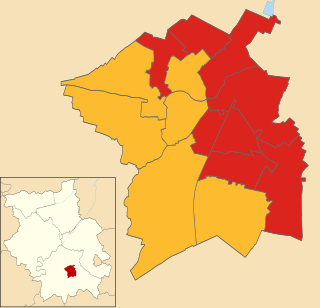
Elections for Cambridge City Council were held on Thursday 5 May 2011. As the council is elected by thirds, one seat in each of the wards was up for election, with the exception of Cherry Hinton ward where two seats were up for election due to the early retirement of Councillor Stuart Newbold. The vote took place alongside the 2011 United Kingdom Alternative Vote referendum and a Cambridgeshire County Council by-election for Arbury ward.
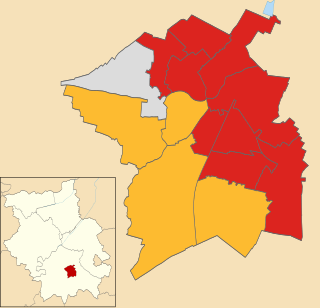
Elections for Cambridge City Council were held on Thursday 3 May 2012. One third of the council was up for election and the Liberal Democrats lost overall control of the council, to No Overall Control.
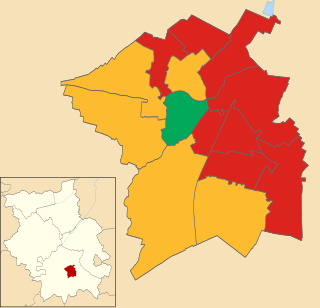
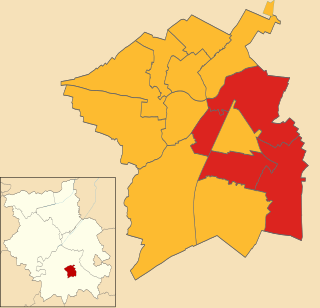
The 2014 Cambridge City Council election took place on 22 May 2014 to elect members of Cambridge City Council in England. This was on the same day as other local elections and the European Union elections.
The 1994 Westminster Council election took place on 5 May 1994 to elect members of Westminster City Council in London, England. The whole council was up for election and the Conservative party stayed in overall control of the council.
The 2015 Cambridge City Council election took place on 7 May 2015 to elect members of Cambridge City Council in England as part of the English local elections of that year coinciding with the 2015 General Election.
The 2016 Cambridge City Council election took place on 5 May 2016 to elect members of Cambridge City Council in England. This was on the same day as other nationwide local elections. The Labour Party grouping gained two seats from the Liberal Democrats, increasing their majority on the council from 6 to 10 seats.
Elections to Cambridge City Council were held on 6 May 2010 as part of the wider local elections across England.
The 2018 Cambridge City Council election took place on 3 May 2018 to elect members of Cambridge City Council in England. This was on the same day as other nationwide local elections.
The 2019 Cambridge City Council election took place on 2 May 2019 to elect members of Cambridge City Council in England. It took place on the same day as other nationwide local elections.
The 1994 Derby City Council election took place on 5 May 1994 to elect members of Derby City Council in England. Local elections were held in the United Kingdom in 1994. This was on the same day as other local elections. The Labour Party gained control of the council, which had previously been under no overall control.
The 2021 Cambridge City Council election took place on 6 May 2021 to elect members of Cambridge City Council in England. This was on the same day as other nationwide local elections.
The 2002 Cambridge City Council election took place on 2 May 2002 to elect members of Cambridge City Council in England. This was on the same day as other nationwide local elections.
The 2003 Cambridge City Council election took place on 1 May 2003 to elect members of Cambridge City Council in England. This was on the same day as other nationwide local elections.
The 2007 Cambridge City Council election took place on 3 May 2007 to elect members of Cambridge City Council in England. This was on the same day as other nationwide local elections.
The 2008 Cambridge City Council election took place on 1 May 2008 to elect members of Cambridge City Council in England. This was on the same day as other nationwide local elections.