The 2007 Cambridge City Council election took place on 3 May 2007 to elect members of Cambridge City Council in England. [1] This was on the same day as other nationwide local elections.
2007 Cambridge City Council election | ||||||||||
---|---|---|---|---|---|---|---|---|---|---|
Party | This election | Full council | This election | |||||||
Seats | Net | Seats % | Other | Total | Total % | Votes | Votes % | +/− | ||
Liberal Democrats | 10 | 66.7 | 19 | 29 | 69.0 | 10,480 | 33.1 | -5.5 | ||
Labour | 5 | 33.3 | 8 | 13 | 31.0 | 8,587 | 27.1 | +1.7 | ||
Conservative | 0 | 0.0 | 0 | 0 | 0.0 | 7,880 | 24.9 | +3.5 | ||
Green | 0 | 0.0 | 0 | 0 | 0.0 | 4,010 | 12.7 | +0.1 | ||
Respect | 0 | 0.0 | 0 | 0 | 0.0 | 358 | 1.1 | -0.6 | ||
UKIP | 0 | 0.0 | 0 | 0 | 0.0 | 352 | 1.1 | +0.7 |
Party | Candidate | Votes | % | ±% | |
---|---|---|---|---|---|
Labour | Caroline Hart | 701 | 35.5 | -1.9 | |
Green | Margaret Wright | 593 | 30.0 | +4.0 | |
Conservative | Andrew Bower | 398 | 20.1 | -0.2 | |
Liberal Democrats | Ed Sexton | 284 | 14.4 | -1.9 | |
Majority | 108 | 5.5 | -5.9 | ||
Turnout | 1,976 | 30.8 | +2.3 | ||
Labour hold | Swing | 3.0 | |||
Party | Candidate | Votes | % | ±% | |
---|---|---|---|---|---|
Liberal Democrats | Alan Levy | 887 | 35.8 | -4.5 | |
Labour | Mike Todd-Jones | 875 | 35.3 | +3.2 | |
Conservative | Shapour Meftah | 504 | 20.3 | +1.3 | |
Green | Michael Smith | 211 | 8.5 | -0.1 | |
Majority | 12 | 0.5 | -7.6 | ||
Turnout | 2,477 | 37.4 | +0.5 | ||
Liberal Democrats hold | Swing | 3.9 | |||
Party | Candidate | Votes | % | ±% | |
---|---|---|---|---|---|
Liberal Democrats | Tania Zmura | 806 | 42.5 | -5.8 | |
Conservative | Edward MacNaughten | 490 | 25.8 | +2.5 | |
Green | Margery Abbott | 309 | 16.3 | +1.7 | |
Labour | Margery Abbott | 293 | 15.4 | +1.6 | |
Majority | 316 | 16.6 | -8.3 | ||
Turnout | 1,898 | 29.8 | -1.7 | ||
Liberal Democrats hold | Swing | 4.2 | |||
Party | Candidate | Votes | % | ±% | |
---|---|---|---|---|---|
Labour | Russ McPherson | 1,126 | 46.1 | +3.2 | |
Conservative | Sarah El-Neil | 806 | 33.0 | -1.6 | |
Liberal Democrats | Keith Edkins | 257 | 10.5 | -4.2 | |
Green | Hamish Downer | 130 | 5.3 | -2.4 | |
UKIP | Marjorie Barr | 121 | 5.0 | N/A | |
Majority | 320 | 13.1 | +4.8 | ||
Turnout | 2,440 | 39.4 | -0.3 | ||
Labour hold | Swing | 2.4 | |||
Party | Candidate | Votes | % | ||
---|---|---|---|---|---|
Labour | Jeremy Benstead | 861 | 39.8 | ||
Labour | Tariq Sadiq | 739 | 34.1 | ||
Conservative | Christopher Howell | 721 | 33.3 | ||
Conservative | Richard Normington | 662 | 30.6 | ||
Liberal Democrats | Emma Lindsay | 312 | 14.4 | ||
Green | Valerie Hopkins | 253 | 11.7 | ||
Liberal Democrats | Thomas Yates | 248 | 11.5 | ||
Green | Neil Ford | 215 | 9.9 | ||
UKIP | Albert Watts | 116 | 5.4 | ||
Turnout | 2,165 | 36.3 | |||
Labour hold | |||||
Labour hold |
Party | Candidate | Votes | % | ±% | |
---|---|---|---|---|---|
Liberal Democrats | Clare Blair | 731 | 34.6 | -6.0 | |
Conservative | Kevin Francis | 583 | 27.6 | +5.5 | |
Labour | Stefan Haselwimmer | 457 | 21.6 | -5.2 | |
Green | Peter Pope | 225 | 10.7 | +0.2 | |
UKIP | Peter Burkinshaw | 115 | 5.4 | N/A | |
Majority | 148 | 7.0 | -6.8 | ||
Turnout | 2,111 | 36.3 | +0.4 | ||
Liberal Democrats hold | Swing | 5.8 | |||
Party | Candidate | Votes | % | ±% | |
---|---|---|---|---|---|
Liberal Democrats | Michael Pill | 679 | 35.9 | -4.1 | |
Labour | Gerri Bird | 661 | 35.0 | +5.3 | |
Conservative | Michelle Tempest | 368 | 19.5 | ±0.0 | |
Green | James Youd | 181 | 9.6 | -1.2 | |
Majority | 18 | 0.9 | -9.4 | ||
Turnout | 1,889 | 32.8 | +3.2 | ||
Liberal Democrats gain from Labour | Swing | 4.7 | |||
Party | Candidate | Votes | % | ±% | |
---|---|---|---|---|---|
Liberal Democrats | Mike Dixon | 679 | 42.4 | -0.3 | |
Green | Gergory Patton | 344 | 21.5 | +1.6 | |
Conservative | Timothy Haire | 341 | 21.3 | -0.4 | |
Labour | Lucy Sheerman | 237 | 14.8 | -1.0 | |
Majority | 335 | 20.9 | -0.1 | ||
Turnout | 1,601 | 25.7 | -3.0 | ||
Liberal Democrats hold | Swing | 1.0 | |||
Party | Candidate | Votes | % | ±% | |
---|---|---|---|---|---|
Liberal Democrats | Julie Smith | 842 | 44.9 | -1.3 | |
Conservative | James Strachan | 489 | 26.1 | +3.5 | |
Green | Aneaka Kaur Kellay | 300 | 16.0 | +0.8 | |
Labour | Louis Couffait | 246 | 13.1 | -2.9 | |
Majority | 353 | 18.8 | -4.9 | ||
Turnout | 1,877 | 28.8 | -2.9 | ||
Liberal Democrats hold | Swing | 2.4 | |||
Party | Candidate | Votes | % | ±% | |
---|---|---|---|---|---|
Labour | Lucy Walker | 1,063 | 45.3 | +6.3 | |
Liberal Democrats | Steven Cooper | 817 | 34.9 | -2.8 | |
Conservative | James Martin | 239 | 10.2 | -0.6 | |
Green | Shayne Mitchell | 225 | 9.6 | -2.9 | |
Majority | 246 | 10.4 | +9.0 | ||
Turnout | 2,344 | 38.7 | +2.9 | ||
Labour gain from Liberal Democrats | Swing | 4.6 | |||
Party | Candidate | Votes | % | ±% | |
---|---|---|---|---|---|
Liberal Democrats | Viki Sanders | 1,364 | 53.4 | -3.3 | |
Conservative | Donald Douglas | 760 | 29.7 | +1.7 | |
Labour | Len Freeman | 221 | 8.6 | +0.3 | |
Green | Martin Lawson | 210 | 8.2 | +1.3 | |
Majority | 604 | 23.6 | -5.1 | ||
Turnout | 2,555 | 42.2 | +1.4 | ||
Liberal Democrats hold | Swing | 2.5 | |||
Party | Candidate | Votes | % | ±% | |
---|---|---|---|---|---|
Liberal Democrats | Rah Shah | 774 | 36.2 | -5.2 | |
Labour | Jonathan Goodacre | 496 | 23.2 | -1.0 | |
Respect | Tom Woodcock | 358 | 16.8 | +5.4 | |
Green | Jesse Griffiths | 271 | 12.7 | -1.2 | |
Conservative | Angela Ozturk | 238 | 11.1 | +2.0 | |
Majority | 278 | 13.0 | — | ||
Turnout | 2,137 | 34.9 | -2.1 | ||
Liberal Democrats hold | Swing | 2.1 | |||
Party | Candidate | Votes | % | ±% | |
---|---|---|---|---|---|
Liberal Democrats | Andy Blackhurst | 913 | 45.2 | -0.3 | |
Conservative | Peter Hase | 774 | 38.3 | +2.6 | |
Green | Ceri Galloway | 172 | 8.5 | -1.2 | |
Labour | Pamela Stacey | 160 | 7.9 | -1.2 | |
Majority | 139 | 6.9 | -3.0 | ||
Turnout | 2,019 | 37.9 | -1.6 | ||
Liberal Democrats hold | Swing | 1.5 | |||
Party | Candidate | Votes | % | ±% | |
---|---|---|---|---|---|
Liberal Democrats | Diane Armstrong | 887 | 40.0 | -2.5 | |
Conservative | Steven Mastin | 507 | 22.9 | +2.1 | |
Labour | Simon Watkins | 451 | 20.4 | +1.6 | |
Green | Sarah Peake | 371 | 16.7 | -1.2 | |
Majority | 380 | 17.1 | -4.7 | ||
Turnout | 2,216 | 36.0 | -0.7 | ||
Liberal Democrats hold | Swing | 2.3 | |||
Cambridge is a city in Middlesex County, Massachusetts, and part of the Boston metropolitan area as a major suburb of Boston. As of the 2020 United States Census, the city's population was 118,403, making it the fourth most populous city in the state, behind Boston, Worcester, and Springfield. It is one of two de jure county seats of Middlesex County, although the county's government was abolished in 1997. Situated directly north of Boston, across the Charles River, it was named in honor of the University of Cambridge in England, once also an important center of the Puritan theology embraced by the town's founders.
The City of Lancaster is a local government district of Lancashire, England, with the status of a city and non-metropolitan district. It is named after its largest settlement, Lancaster, but covers a far larger area, which includes the towns of Morecambe, Heysham, and Carnforth, as well as outlying villages, farms, rural hinterland and a section of the Yorkshire Dales National Park. The district has a population of 146,038 (mid-2019 est.), and an area of 222.5 square miles (576.2 km2).
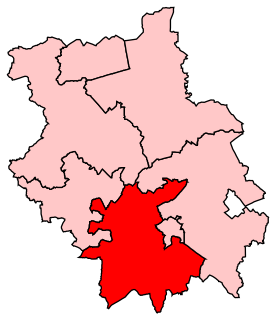
South Cambridgeshire is a constituency represented in the House of Commons of the UK Parliament since 2019 by Anthony Browne, a Conservative.
One third of Cambridge City Council is elected each year, followed by one year without election.
Cambridge City Council is a district council in the county of Cambridgeshire, which governs the City of Cambridge.
Elections for Cambridge City Council were held on Thursday 4 May 2006. As Cambridge City Council is elected by thirds, one seat in each of the city's 14 wards was up for election. The exception was Romsey, where two seats were up for election as a by-election for the other seat was held on the same day. Therefore, 15 of the 42 seats on the council were up for election. Overall turnout was 34.4%, down from 37.0% in 2004. The lowest turnout (28.4%) was in Abbey ward and the highest (40.8%) in Queen Edith's.
The United States Senate election of 1948 in Massachusetts was held on November 2, 1948, with Republican incumbent Leverett Saltonstall defeating his challengers.
Elections for Cambridge City Council were held on Thursday 5 May 2011. As the council is elected by thirds, one seat in each of the wards was up for election, with the exception of Cherry Hinton ward where two seats were up for election due to the early retirement of Councillor Stuart Newbold. The vote took place alongside the 2011 United Kingdom Alternative Vote referendum and a Cambridgeshire County Council by-election for Arbury ward.
Elections for Cambridge City Council were held on Thursday 3 May 2012. One third of the council was up for election and the Liberal Democrats lost overall control of the council, to No Overall Control.
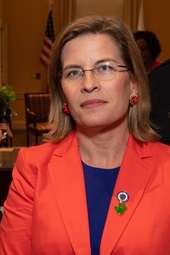
Marjorie C. Decker is an American politician serving as the State Representative for the 25th Middlesex district in the Massachusetts General Court.
The 2014 Cambridge City Council election took place on 22 May 2014 to elect members of Cambridge City Council in England. This was on the same day as other local elections and the European Union elections.
The 2015 Cambridge City Council election took place on 7 May 2015 to elect members of Cambridge City Council in England as part of the English local elections of that year coinciding with the 2015 General Election.
The 2016 Cambridge City Council election took place on 5 May 2016 to elect members of Cambridge City Council in England. This was on the same day as other nationwide local elections. The Labour Party grouping gained two seats from the Liberal Democrats, increasing their majority on the council from 6 to 10 seats.
The 2018 Cambridge City Council election took place on 3 May 2018 to elect members of Cambridge City Council in England. This was on the same day as other nationwide local elections.
The 2019 Cambridge City Council election took place on 2 May 2019 to elect members of Cambridge City Council in England. This was on the same day as other nationwide local elections. Next election 2021
The 2021 Cambridgeshire County Council election took place on 6 May 2021 as part of the 2021 local elections in the United Kingdom. All 61 councillors were elected from 59 electoral divisions, which returned either one or two county councillors each by first-past-the-post voting for a four-year term of office. The election was held alongside a full election for Cambridge City Council, the Cambridgeshire Police and Crime Commissioner, Mayor of Cambridgeshire and Peterborough and one-third of Peterborough City Council.
The 2021 Cambridge City Council election took place on 6 May 2021 to elect members of Cambridge City Council in England. This was on the same day as other nationwide local elections.
The 2002 Cambridge City Council election took place on 2 May 2002 to elect members of Cambridge City Council in England. This was on the same day as other nationwide local elections.
The 2003 Cambridge City Council election took place on 1 May 2003 to elect members of Cambridge City Council in England. This was on the same day as other nationwide local elections.
The 2008 Cambridge City Council election took place on 1 May 2008 to elect members of Cambridge City Council in England. This was on the same day as other nationwide local elections.