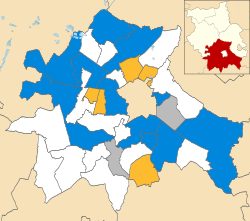
Elections to South Cambridgeshire District Council took place on Thursday 3 May 2007, as part of the 2007 United Kingdom local elections. Nineteen seats, making up one third of South Cambridgeshire District Council, were up for election. Seats up for election in 2007 were last contested at the 2004 election, when all seats were up for election due to new ward boundaries, and were next contested at the 2011 election. The Conservative Party gained an overall majority on the council for the first time.
Of the seats being contested at this election, the Conservatives were defending 9 seats, Liberal Democrats were defending 6 seats, and independents were defending 4 seats. Two seats had changed hands at by-elections prior to this election. In November 2004, Liberal Democrats gained Duxford from the Conservatives, [1] while in October 2006 Conservatives gained the Abingtons from the Liberal Democrats. [2] Both by-election gains were successfully defended at this election.
A further three seats were gained by the Conservative Party at this election. Gains from independents in Barton and in Orwell and Barrington as well as from the Liberal Democrats in the Shelfords and Stapleford meant the Conservative Party formed a majority on the council for the first time.
South Cambridgeshire District Council election, 2007 [3] | |||||||
---|---|---|---|---|---|---|---|
Party | Seats | Popular vote | |||||
Won | Not up | Total | ± | Votes | % | ||
Conservative | 12 | 17 | 29 | +3 | 12,683 | 50.2 | |
Liberal Democrats | 5 | 12 | 17 | −1 | 7,870 | 31.1 | |
Independent | 2 | 8 | 10 | −2 | 2,439 | 9.6 | |
Labour | 0 | 1 | 1 | 0 | 2,025 | 8.0 | |
UKIP | 0 | 0 | 0 | 0 | 184 | 0.7 | |
Green | 0 | 0 | 0 | 0 | 76 | 0.3 | |
Total | 19 | 38 | 57 | – | 25,277 | – | |
Turnout | 40.1 | ||||||
Party | Candidate | Votes | % | ±% | |
---|---|---|---|---|---|
Conservative | Richard Edwin Barrett | 1,142 | 59.9 | +8.9 | |
Liberal Democrats | Pauline Elizabeth Jarvis | 692 | 36.3 | −12.6 | |
Labour | Richard Amos | 72 | 3.8 | N/A | |
Majority | 450 | ||||
Turnout | 54.1 | ||||
Conservative hold | Swing | ||||
Party | Candidate | Votes | % | ±% | |
---|---|---|---|---|---|
Conservative | Roger Hall | 871 | 60.3 | +10.5 | |
Liberal Democrats | Sylvia Mary Abbott | 220 | 15.2 | −22.3 | |
UKIP | Helene Yvette Davies | 184 | 12.7 | N/A | |
Labour | John Shepherd | 169 | 11.7 | +4.7 | |
Majority | 651 | ||||
Turnout | 37.5 | ||||
Conservative hold | Swing | ||||
Party | Candidate | Votes | % | ±% | |
---|---|---|---|---|---|
Conservative | Francis William Miles Burkitt | 446 | 50.4 | +21.0 | |
Independent | Keith Robert Scott | 309 | 34.9 | N/A | |
Green | Anna Gomori-Woodcock | 76 | 8.6 | +2.0 | |
Labour | Annabel Jane Barrett | 54 | 6.1 | N/A | |
Majority | 137 | ||||
Turnout | 48.2 | ||||
Conservative gain from Independent | Swing | ||||
Party | Candidate | Votes | % | ±% | |
---|---|---|---|---|---|
Conservative | Lorraine Ann Morgan | 676 | 44.1 | −10.6 | |
Independent | Roger Keith Hume | 642 | 41.9 | N/A | |
Labour | Mark David Hurn | 215 | 14.0 | +7.1 | |
Majority | 52 | ||||
Turnout | 31.6 | ||||
Conservative hold | Swing | ||||
Party | Candidate | Votes | % | ±% | |
---|---|---|---|---|---|
Liberal Democrats | Stephen Alexander Harangozo | 438 | 48.2 | +2.5 | |
Conservative | Hywel Wyn Griffiths | 401 | 44.2 | +3.0 | |
Labour | Peter Durrant | 69 | 7.6 | −5.6 | |
Majority | 39 | ||||
Turnout | 49.3 | ||||
Liberal Democrats hold | Swing | ||||
Party | Candidate | Votes | % | ±% | |
---|---|---|---|---|---|
Conservative | Timothy John Wotherspoon | 1,163 | 56.9 | +20.8 | |
Liberal Democrats | Susan Mary Bainbridge | 678 | 33.2 | +6.9 | |
Labour | Michael Wilson | 202 | 9.9 | N/A | |
Majority | 485 | ||||
Turnout | 34.0 | ||||
Conservative hold | Swing | ||||
Party | Candidate | Votes | % | ±% | |
---|---|---|---|---|---|
Liberal Democrats | John Williams | 525 | 54.9 | +6.0 | |
Conservative | Robin Driver | 391 | 40.9 | −10.2 | |
Labour | Yvonne Nobis | 40 | 4.2 | N/A | |
Majority | 134 | ||||
Turnout | 47.2 | ||||
Liberal Democrats hold | Swing | ||||
Party | Candidate | Votes | % | ±% | |
---|---|---|---|---|---|
Independent | Deborah Patricia Roberts | 489 | 45.2 | N/A | |
Liberal Democrats | Christine Dallas Cartwright | 338 | 31.2 | N/A | |
Conservative | Robert James Poulter | 230 | 21.2 | N/A | |
Labour | Grace Everson | 26 | 2.4 | N/A | |
Majority | 151 | ||||
Turnout | 57.5 | ||||
Independent hold | Swing | ||||
Party | Candidate | Votes | % | ±% | |
---|---|---|---|---|---|
Independent | Neil John Scarr | 528 | 39.6 | +15.8 | |
Liberal Democrats | John George Williams | 391 | 29.4 | +1.2 | |
Conservative | Alison Mary Farmer | 350 | 26.3 | +5.2 | |
Labour | Owen Leonard | 63 | 4.7 | N/A | |
Majority | 137 | ||||
Turnout | 39.4 | ||||
Independent hold | Swing | ||||
Party | Candidate | Votes | % | ±% | |
---|---|---|---|---|---|
Liberal Democrats | Jim Stewart | 504 | 73.7 | +16.4 | |
Conservative | Mandy Lorraine Smith | 151 | 22.1 | −14.5 | |
Labour | Helen Haugh | 29 | 4.2 | N/A | |
Majority | 353 | ||||
Turnout | 35.5 | ||||
Liberal Democrats hold | Swing | ||||
Party | Candidate | Votes | % | ±% | |
---|---|---|---|---|---|
Liberal Democrats | Jonathan Peter Chatfield | 1,309 | 52.2 | +17.6 | |
Conservative | Philip 'Scotty' Scott | 1,008 | 40.2 | +8.6 | |
Labour | Robin Philip Stern | 191 | 7.6 | −0.5 | |
Majority | 301 | ||||
Turnout | 40.7 | ||||
Liberal Democrats hold | Swing | ||||
Party | Candidate | Votes | % | ±% | |
---|---|---|---|---|---|
Liberal Democrats | Hazel Marion Smith | 714 | 51.4 | +18.9 | |
Conservative | Gerda Covell | 584 | 42.0 | +15.2 | |
Labour | Valerie Ross | 91 | 6.6 | −1.8 | |
Majority | 130 | ||||
Turnout | 45.8 | ||||
Liberal Democrats hold | Swing | ||||
Party | Candidate | Votes | % | ±% | |
---|---|---|---|---|---|
Conservative | David Bird | 532 | 83.3 | +50.9 | |
Labour | Sara Alison Ball | 107 | 16.7 | N/A | |
Majority | 425 | ||||
Turnout | 35.8 | ||||
Conservative gain from Independent | Swing | ||||
Party | Candidate | Votes | % | ±% | |
---|---|---|---|---|---|
Conservative | Nick Wright | 885 | 74.2 | +28.6 | |
Labour | Angela Patrick | 308 | 25.8 | N/A | |
Majority | 577 | ||||
Turnout | 36.6 | ||||
Conservative hold | Swing | ||||
Party | Candidate | Votes | % | ±% | |
---|---|---|---|---|---|
Conservative | David Roy Bard | 995 | 67.5 | +17.9 | |
Liberal Democrats | Ian Douglas Wallace | 256 | 17.4 | +4.4 | |
Labour | Michael Olanrewaju Idowu | 224 | 15.2 | +0.1 | |
Majority | 739 | ||||
Turnout | 27.9 | ||||
Conservative hold | Swing | ||||
Party | Candidate | Votes | % | ±% | |
---|---|---|---|---|---|
Conservative | Caroline Anne Hunt | unopposed | |||
Conservative hold | Swing | ||||
Party | Candidate | Votes | % | ±% | |
---|---|---|---|---|---|
Conservative | Anthony Geoffrey Orgee | 680 | 81.2 | +58.5 | |
Liberal Democrats | David John Willingham | 158 | 18.9 | −44.7 | |
Majority | 522 | ||||
Turnout | 48.5 | ||||
Conservative hold | Swing | ||||
Party | Candidate | Votes | % | ±% | |
---|---|---|---|---|---|
Conservative | Jaime Ann Dipple | 1,457 | 54.2 | −10.7 | |
Liberal Democrats | Helen Freda Kember | 1,040 | 38.7 | +16.5 | |
Labour | Michael Nettleton | 189 | 7.0 | −5.8 | |
Majority | 417 | ||||
Turnout | 49.1 | ||||
Conservative gain from Liberal Democrats | Swing | ||||
Party | Candidate | Votes | % | ±% | |
---|---|---|---|---|---|
Conservative | Brian Roy Burling | 817 | 47.1 | −6.9 | |
Independent | Pat Daniels | 471 | 27.1 | N/A | |
Liberal Democrats | Leslie Harold Gelling | 365 | 21.0 | −14.7 | |
Labour | Nicola Andrews | 83 | 4.8 | N/A | |
Majority | 346 | ||||
Turnout | 35.1 | ||||
Conservative hold | Swing | ||||
South Cambridgeshire is a constituency represented in the House of Commons of the UK Parliament since 2019 by Anthony Browne, a Conservative.
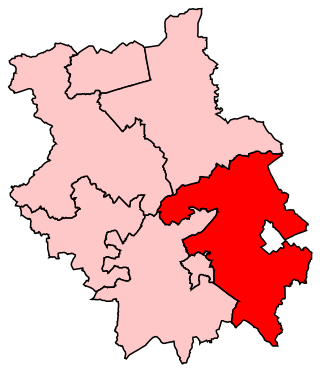
South East Cambridgeshire is a constituency represented in the House of Commons of the UK Parliament since 2015 by Lucy Frazer, a member of the Conservative Party who has served as the Culture Secretary since 2023. It was established for the 1983 general election. The constituency has always been based on the cathedral city of Ely.
South Cambridgeshire District Council was created as part of the 1972 local government reforms. The first elections to the new authority were held in the year 1973. From 1978 until 2016, one third of the council were elected each year, followed by one year without a poll. Since 2018, all members of the council are elected at once in a so-called 'all-out' election, after a decision made in 2015.
The 2008 St Albans City and District Council election took place on 1 May 2008 to elect members of St Albans District Council in Hertfordshire, England. One third of the council was up for election and the Liberal Democrats gained overall control of the council from no overall control.
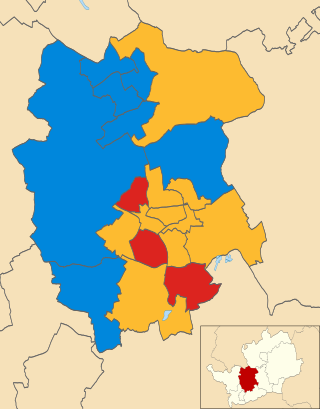
The 2007 St Albans City and District Council election took place on 3 May 2007 to elect members of St Albans District Council in Hertfordshire, England. One third of the council was up for election and the Liberal Democrats lost overall control of the council to no overall control.
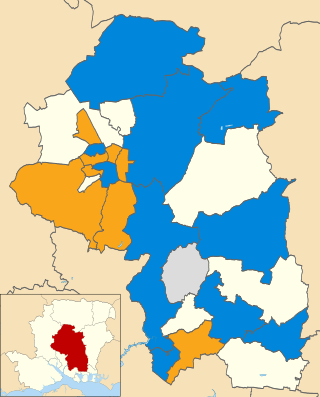
The 2007 Winchester Council election took place on 3 May 2007 to elect members of Winchester District Council in Hampshire, England. One third of the council was up for election and the Conservative Party stayed in overall control of the council.
The 2004 Stratford-on-Avon District Council election took place on 10 June 2004 to elect members of Stratford-on-Avon District Council in Warwickshire, England. One third of the council was up for election and the Conservative Party stayed in overall control of the council.
Elections to South Cambridgeshire District Council took place on Thursday 5 May 2011, as part of the 2011 United Kingdom local elections. Nineteen seats, making up one third of South Cambridgeshire District Council, were up for election. Seats up for election in 2011 were last contested at the 2007 election. The Conservative Party retained their majority on the council.
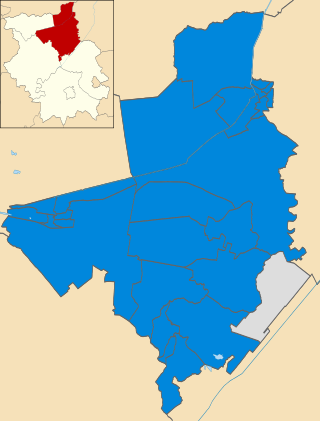
The 2007 Fenland District Council election took place on 4 May 2007 to elect members of Fenland District Council in Cambridgeshire, England. The whole council was up for election and the Conservative Party stayed in overall control of the council.
Elections to South Cambridgeshire District Council took place on Thursday 3 May 2012, as part of the 2012 United Kingdom local elections. Nineteen seats, making up one third of South Cambridgeshire District Council, were up for election. Seats up for election in 2012 were last contested at the 2008 election. The Conservative Party retained their majority on the council.
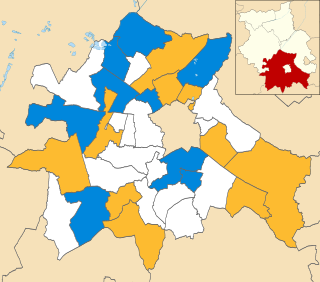
Elections to South Cambridgeshire District Council took place on Thursday 6 May 2010, as part of the 2010 United Kingdom local elections. The elections also took place at the same time as the 2010 United Kingdom general election. Nineteen seats, constituting one third of the South Cambridgeshire District Council, were up for election. Seats up for election in 2010 were last contested at the 2006 election. The Conservative Party retained their majority on the council, despite losing seats.
Elections to South Cambridgeshire District Council took place on Thursday 1 May 2008, as part of the 2008 United Kingdom local elections. Twenty seats, making up just over one third of South Cambridgeshire District Council, were up for election. Both seats in Gamlingay were contested at this election after one of the councillors retired earlier in the year. Seats up for election in 2008 were last contested at the 2004 election, and were next contested at the 2012 election. The Conservative Party retained their majority on the council.
Elections to South Cambridgeshire District Council took place on Thursday 4 May 2006, as part of the 2006 United Kingdom local elections. Twenty seats, making up just over one third of South Cambridgeshire District Council, were up for election, with a by-election being held in one ward. Seats up for election in 2006 were last contested at the 2004 election, when all seats were up for election due to new ward boundaries, and were next contested at the 2010 election. The Conservative Party remained the largest party with an increased number of seats, but the council remained under no overall control.
Elections to South Cambridgeshire District Council took place on Thursday 10 June 2004, as part of the 2004 United Kingdom local elections and at the same time as the European Parliament election, 2004. Due to new ward boundaries, all 57 seats on the council were up for election, increasing the number of councillors by two. Seats up for election in 2004 were subsequently contested by thirds at the 2006, 2007 and 2008 elections.
The 2007 Huntingdonshire District Council election took place on 3 May 2007 to elect members of Huntingdonshire District Council in Cambridgeshire, England. One third of the council was up for election and the Conservative Party stayed in overall control of the council.
The 2008 Huntingdonshire District Council election took place on 1 May 2008 to elect members of Huntingdonshire District Council in Cambridgeshire, England. One third of the council was up for election and the Conservative Party stayed in overall control of the council.
The 2012 Huntingdonshire District Council election took place on 3 May 2012 to elect members of Huntingdonshire District Council in Cambridgeshire, England. One third of the council was up for election and the Conservative Party stayed in overall control of the council.
Elections to South Cambridgeshire District Council were held on Thursday 3 May 2018 as part of the 2018 United Kingdom local elections. Forty five seats, making up the whole of South Cambridgeshire District Council, were up for election in twenty six wards. The council previously had 57 members, last elected by thirds in 2016, 2015 and 2014. Following a boundary review, there has been a reduction of twelve seats to 45 and the electoral pattern has changed from election by thirds to all out elections, meaning that all seats were up for election on this occasion.
The 2011 South Oxfordshire District Council election was held on 5 May 2011 to elect members of South Oxfordshire District Council in England. This was on the same day as other local elections.
Elections to South Cambridgeshire District Council were held on Thursday 5 May 2022 as part of the 2022 United Kingdom local elections. All forty five seats were up for election in twenty six wards. The Liberal Democrats were defending the council, having won control in 2018.