![]() | |||||||||||||||||||||||||||||||||||||||||
| |||||||||||||||||||||||||||||||||||||||||
14 out of 42 seats to Cambridge City Council 22 seats needed for a majority | |||||||||||||||||||||||||||||||||||||||||
---|---|---|---|---|---|---|---|---|---|---|---|---|---|---|---|---|---|---|---|---|---|---|---|---|---|---|---|---|---|---|---|---|---|---|---|---|---|---|---|---|---|
Turnout | 29.6% (![]() | ||||||||||||||||||||||||||||||||||||||||
| |||||||||||||||||||||||||||||||||||||||||
![]() Winner of each seat at the 2000 Cambridge City Council election | |||||||||||||||||||||||||||||||||||||||||
|
The 2000 Cambridge City Council election took place on 4 May 2000 to elect members of Cambridge City Council in Cambridge, Cambridgeshire, England. [1] This was on the same day as other local elections across England.
2000 Cambridge City Council election | ||||||||||
---|---|---|---|---|---|---|---|---|---|---|
Party | This election | Full council | This election | |||||||
Seats | Net | Seats % | Other | Total | Total % | Votes | Votes % | +/− | ||
Liberal Democrats | 9 | ![]() | 64.3 | 13 | 22 | 52.4 | 9,994 | 38.9 | +1.2 | |
Labour | 4 | ![]() | 28.6 | 10 | 14 | 33.3 | 8,602 | 33.4 | –4.7 | |
Conservative | 1 | ![]() | 7.1 | 5 | 6 | 14.3 | 6,142 | 23.9 | +2.9 | |
Green | 0 | ![]() | 0.0 | 0 | 0 | 0.0 | 985 | 3.8 | +0.5 |
Party | Candidate | Votes | % | ±% | |
---|---|---|---|---|---|
Labour | Richard Smith* | 567 | 62.4 | –8.9 | |
Conservative | Simon Mitton | 224 | 24.7 | +8.7 | |
Liberal Democrats | Julian Huppert | 117 | 12.9 | +5.2 | |
Majority | 343 | 37.8 | –17.5 | ||
Turnout | 908 | 19.2 | –1.9 | ||
Registered electors | 4,764 | ||||
Labour hold | Swing | ![]() |
Party | Candidate | Votes | % | ±% | |
---|---|---|---|---|---|
Liberal Democrats | Timothy Ward | 691 | 35.5 | +20.9 | |
Labour | Patricia Wright* | 655 | 33.6 | –23.6 | |
Conservative | Robert Boorman | 544 | 27.9 | –0.2 | |
Green | Stephen Lawrence | 57 | 2.9 | N/A | |
Majority | 36 | 1.8 | N/A | ||
Turnout | 1,947 | 38.7 | +12.0 | ||
Registered electors | 5,045 | ||||
Liberal Democrats gain from Labour | Swing | ![]() |
Party | Candidate | Votes | % | ±% | |
---|---|---|---|---|---|
Liberal Democrats | John Hipkin* | 1,195 | 62.3 | –9.9 | |
Conservative | Mark Taylor | 324 | 16.9 | +4.9 | |
Labour | Denstone Kemp | 261 | 13.6 | –1.7 | |
Green | Margaret Wright | 137 | 7.1 | N/A | |
Majority | 871 | 45.4 | –10.9 | ||
Turnout | 1,917 | 27.4 | –1.5 | ||
Registered electors | 7,015 | ||||
Liberal Democrats hold | Swing | ![]() |
Party | Candidate | Votes | % | ±% | |
---|---|---|---|---|---|
Conservative | Christopher Howell | 1,138 | 49.8 | +8.4 | |
Labour | George Rowling | 994 | 43.5 | –9.5 | |
Liberal Democrats | Frances Amrani | 152 | 6.7 | +1.1 | |
Majority | 144 | 6.3 | N/A | ||
Turnout | 2,284 | 41.9 | –1.2 | ||
Registered electors | 5,465 | ||||
Conservative gain from Labour | Swing | ![]() |
Party | Candidate | Votes | % | ±% | |
---|---|---|---|---|---|
Labour | Jeremy Benstead* | 789 | 52.6 | –7.5 | |
Conservative | James Strachan | 433 | 28.8 | +4.7 | |
Liberal Democrats | Judith Pinnington | 279 | 18.6 | +2.8 | |
Majority | 356 | 23.7 | –12.3 | ||
Turnout | 1,501 | 25.3 | –0.4 | ||
Registered electors | 5,939 | ||||
Labour hold | Swing | ![]() |
Party | Candidate | Votes | % | ±% | |
---|---|---|---|---|---|
Liberal Democrats | Jennifer Liddle | 1,104 | 45.9 | +3.9 | |
Labour | Sarah Woodall | 940 | 39.1 | –5.8 | |
Conservative | Colin Havercroft | 361 | 15.0 | +2.0 | |
Majority | 164 | 6.8 | N/A | ||
Turnout | 2,405 | 34.6 | –1.6 | ||
Registered electors | 6,974 | ||||
Liberal Democrats hold | Swing | ![]() |
Party | Candidate | Votes | % | ±% | |
---|---|---|---|---|---|
Labour | Peter Cowell* | 644 | 64.3 | –1.6 | |
Conservative | Jason Webb | 204 | 20.4 | +2.8 | |
Liberal Democrats | Philip Rodgers | 153 | 15.3 | –1.2 | |
Majority | 440 | 44.0 | –4.3 | ||
Turnout | 1,001 | 21.0 | +0.8 | ||
Registered electors | 4,774 | ||||
Labour hold | Swing | ![]() |
Party | Candidate | Votes | % | ±% | |
---|---|---|---|---|---|
Liberal Democrats | Colin Rosenstiel* | 835 | 54.6 | +0.6 | |
Labour | Andrew Jones | 298 | 19.5 | –2.8 | |
Conservative | John Phillips | 234 | 15.3 | +2.2 | |
Green | Adam Swallow | 162 | 10.6 | –0.1 | |
Majority | 537 | 35.1 | +3.4 | ||
Turnout | 1,529 | 22.4 | –0.2 | ||
Registered electors | 6,854 | ||||
Liberal Democrats hold | Swing | ![]() |
Party | Candidate | Votes | % | ±% | |
---|---|---|---|---|---|
Liberal Democrats | Malcolm Schofield | 1,016 | 53.1 | –1.8 | |
Labour | Gillian Richardson* | 540 | 28.2 | –3.2 | |
Conservative | Ann Watkins | 358 | 18.7 | +4.9 | |
Majority | 476 | 24.9 | +1.4 | ||
Turnout | 1,914 | 24.7 | –2.1 | ||
Registered electors | 7,863 | ||||
Liberal Democrats gain from Labour | Swing | ![]() |
Party | Candidate | Votes | % | ±% | |
---|---|---|---|---|---|
Labour | Benjamin Bradnack* | 896 | 49.7 | –4.7 | |
Green | Shayne Mitchell | 391 | 21.7 | +2.9 | |
Liberal Democrats | Kevin Wilkins | 267 | 14.8 | +0.5 | |
Conservative | Charles Harcourt | 249 | 13.8 | +1.3 | |
Majority | 505 | 28.0 | –7.6 | ||
Turnout | 1,803 | 23.5 | –1.6 | ||
Registered electors | 7,710 | ||||
Labour hold | Swing | ![]() |
Party | Candidate | Votes | % | ±% | |
---|---|---|---|---|---|
Liberal Democrats | Richard Stebbings | 1,282 | 54.9 | +6.2 | |
Conservative | Hilary Pennington | 711 | 30.5 | –0.2 | |
Labour | Louise Downham | 341 | 14.6 | –0.8 | |
Majority | 571 | 24.5 | +6.5 | ||
Turnout | 2,334 | 38.6 | –1.3 | ||
Registered electors | 6,064 | ||||
Liberal Democrats gain from Conservative | Swing | ![]() |
Party | Candidate | Votes | % | ±% | |
---|---|---|---|---|---|
Liberal Democrats | Sarah Ellis-Miller | 951 | 45.0 | +1.1 | |
Labour | Adrian Lucas* | 900 | 42.6 | –7.6 | |
Conservative | Vivian Ellis | 134 | 6.3 | +0.4 | |
Green | Robert Milsom | 126 | 5.4 | N/A | |
Majority | 51 | 2.4 | N/A | ||
Turnout | 2,111 | 34.6 | |||
Registered electors | 6,133 | ||||
Liberal Democrats gain from Labour | Swing | ![]() |
Party | Candidate | Votes | % | ±% | |
---|---|---|---|---|---|
Liberal Democrats | Jean Currie | 1,096 | 49.0 | –3.2 | |
Conservative | Fiona McNish | 925 | 41.4 | +0.8 | |
Labour | Maria Bell | 216 | 9.7 | +2.4 | |
Majority | 171 | 7.6 | –4.0 | ||
Turnout | 2,111 | 37.9 | –0.7 | ||
Registered electors | 5,908 | ||||
Liberal Democrats hold | Swing | ![]() |
Party | Candidate | Votes | % | ±% | |
---|---|---|---|---|---|
Liberal Democrats | Gaynor Griffiths* | 856 | 46.7 | –2.6 | |
Labour | David Gosling | 561 | 30.6 | +2.2 | |
Conservative | Richard Hoile | 303 | 16.5 | +3.1 | |
Green | Gerhard Goldbeck-Wood | 112 | 6.1 | –2.8 | |
Majority | 295 | 16.1 | –4.7 | ||
Turnout | 1,832 | 30.2 | +0.7 | ||
Registered electors | 6,065 | ||||
Liberal Democrats hold | Swing | ![]() |
North West Cambridgeshire is a county constituency represented in the House of Commons of the Parliament of the United Kingdom since 2024 by Sam Carling of the Labour Party. It elects one Member of Parliament (MP) by the first past the post system of election.
South Cambridgeshire is a constituency represented in the House of Commons of the UK Parliament since the 2024 general election by Pippa Heylings of the Liberal Democrats.
One third of Cambridge City Council is elected each year, followed by one year without election.
In England, directly elected mayors are directly elected executive political leaders of some local government bodies, usually either local authorities (councils) or combined authorities. Mayors of the latter may be informally referred to as “metro mayors”.
Cambridge City Council is the local authority for Cambridge, a non-metropolitan district with city status in Cambridgeshire, England. The council has been under Labour majority control since 2014. It meets at Cambridge Guildhall. The council is a member of the Cambridgeshire and Peterborough Combined Authority.
The 2000 Derby City Council election took place on 4 May 2000 to elect members of Derby City Council in England. One third of the council was up for election and the Labour party kept overall control of the council.
Elections for Cambridge City Council were held on Thursday 5 May 2011. As the council is elected by thirds, one seat in each of the wards was up for election, with the exception of Cherry Hinton ward where two seats were up for election due to the early retirement of Councillor Stuart Newbold. The vote took place alongside the 2011 United Kingdom Alternative Vote referendum and a Cambridgeshire County Council by-election for Arbury ward.
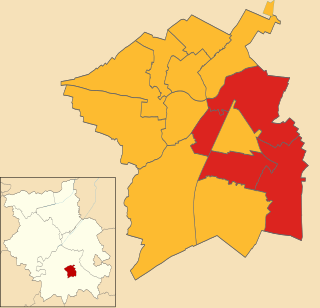
Elections for Cambridge City Council were held on Thursday 3 May 2012. One third of the council was up for election and the Liberal Democrats lost overall control of the council, to No Overall Control.
The 2014 Cambridge City Council election took place on 22 May 2014 to elect members of Cambridge City Council in England. This was on the same day as other local elections and the European Union elections.
The 2015 Cambridge City Council election took place on 7 May 2015 to elect members of Cambridge City Council in England as part of the English local elections of that year coinciding with the 2015 General Election.
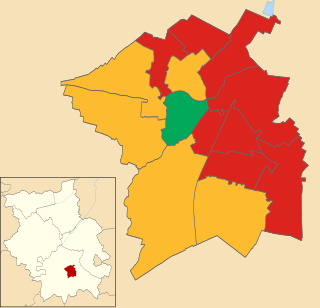
The 2016 Cambridge City Council election took place on 5 May 2016 to elect members of Cambridge City Council in England. This was on the same day as other nationwide local elections. The Labour Party grouping gained two seats from the Liberal Democrats, increasing their majority on the council from 6 to 10 seats.
Elections to Cambridge City Council were held on 6 May 2010 as part of the wider local elections across England.
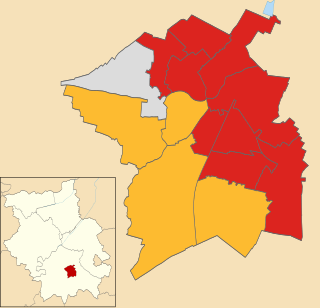
The 2018 Cambridge City Council election took place on 3 May 2018 to elect members of Cambridge City Council in England. This was on the same day as other nationwide local elections.
The 2000 Exeter City Council election took place on 4 May 2000, to elect members of Exeter City Council in England. The entire council was up for election following boundary changes, which increase the number of seats from 36 to 40. The election was held concurrently with other local elections in England. The Labour Party retained control of the council, which it had held since 1995.
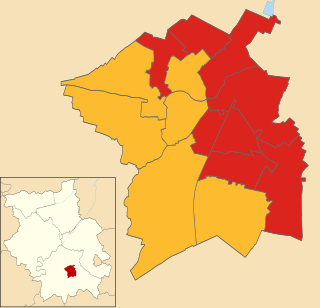
The 2019 Cambridge City Council election took place on 2 May 2019 to elect members of Cambridge City Council in England. It took place on the same day as other nationwide local elections.
The 2021 Cambridge City Council election took place on 6 May 2021 to elect members of Cambridge City Council in England. This was on the same day as other nationwide local elections.
The 2002 Cambridge City Council election took place on 2 May 2002 to elect members of Cambridge City Council in England. This was on the same day as other nationwide local elections.
The 2003 Cambridge City Council election took place on 1 May 2003 to elect members of Cambridge City Council in England. This was on the same day as other nationwide local elections.
The 2007 Cambridge City Council election took place on 3 May 2007 to elect members of Cambridge City Council in England. This was on the same day as other nationwide local elections.
The 2008 Cambridge City Council election took place on 1 May 2008 to elect members of Cambridge City Council in England. This was on the same day as other nationwide local elections.