The 2000 North Tyneside Metropolitan Borough Council election to the North Tyneside Metropolitan Borough Council were held in 2000 alongside other local elections. Labour held control of the council after the election. [1]
2000 North Tyneside Metropolitan Borough Council election [2] [3] | ||||||||||
---|---|---|---|---|---|---|---|---|---|---|
Party | This election | Full council | This election | |||||||
Seats | Net | Seats % | Other | Total | Total % | Votes | Votes % | +/− | ||
Labour | 10 | 4 | 47.6 | 24 | 34 | 56.7 | 22373 | 41.3 | ||
Conservative | 8 | 4 | 38.1 | 9 | 17 | 28.3 | 22420 | 41.4 | ||
Liberal Democrats | 3 | 1 | 14.3 | 6 | 9 | 15 | 8834 | 16.3 | ||
Independent | 0 | 0 | 0 | 0 | 0 | 498 | 0.92 | |||
Party | Candidate | Votes | % | ±% | |
---|---|---|---|---|---|
Liberal Democrats | E. Buckton | 1,533 | 54.0 | +1.4 | |
Labour | M. Jones | 1114 | 39.2 | -8.2 | |
Conservative | E. Smith | 193 | 6.8 | New | |
Majority | 419 | 14.8 | +9.5 | ||
Turnout | 32.8 | ||||
Registered electors | 8,683 | ||||
Liberal Democrats hold | Swing | 4.8 | |||
Party | Candidate | Votes | % | ±% | |
---|---|---|---|---|---|
Labour | M. Madden* | 1,088 | 48.0 | -27.6 | |
Conservative | P. McIntyre | 680 | 30.0 | +8.6 | |
Independent | T. Harding | 498 | 22.0 | New | |
Majority | 408 | 18.0 | -33.3 | ||
Turnout | 34.6 | ||||
Registered electors | 6,572 | ||||
Labour hold | Swing | 18.1 | |||
Party | Candidate | Votes | % | ±% | |
---|---|---|---|---|---|
Labour | J. Conway* | 1,101 | 64.8 | -13.4 | |
Liberal Democrats | P. Gilmore | 331 | 19.5 | +4.7 | |
Conservative | F. Austin | 268 | 15.8 | +8.8 | |
Majority | 770 | 45.3 | -18.1 | ||
Turnout | 24.2 | ||||
Registered electors | 7,045 | ||||
Labour hold | Swing | 9.1 | |||
Party | Candidate | Votes | % | ±% | |
---|---|---|---|---|---|
Labour | J. Ross | 1,043 | 66.8 | -10.7 | |
Conservative | T. Morgan | 518 | 33.2 | +21.9 | |
Majority | 525 | 33.6 | -32.7 | ||
Turnout | 28.5 | ||||
Registered electors | 5,525 | ||||
Labour hold | Swing | 16.3 | |||
Party | Candidate | Votes | % | ±% | |
---|---|---|---|---|---|
Labour | I. Grayson | 1,284 | 63.4 | -19.6 | |
Conservative | M. Carr | 741 | 36.6 | +19.6 | |
Majority | 543 | 26.8 | -39.2 | ||
Turnout | 30.3 | ||||
Registered electors | 6,719 | ||||
Labour hold | Swing | 19.6 | |||
Party | Candidate | Votes | % | ±% | |
---|---|---|---|---|---|
Conservative | B. Stevens | 2,185 | 54.4 | +5.2 | |
Labour | K. Smiles | 1544 | 38.4 | -12.4 | |
Liberal Democrats | G. Moore | 289 | 7.2 | New | |
Majority | 641 | 16.0 | |||
Turnout | 52.8 | ||||
Registered electors | 7,622 | ||||
Conservative gain from Labour | Swing | 8.8 | |||
Party | Candidate | Votes | % | ±% | |
---|---|---|---|---|---|
Labour | R. Lackenby* | 1,654 | 69.7 | -14.5 | |
Conservative | R. Phillifent | 718 | 30.3 | +14.5 | |
Majority | 936 | 39.5 | -28.9 | ||
Turnout | 24.8 | ||||
Registered electors | 9,648 | ||||
Labour hold | Swing | 14.5 | |||
Party | Candidate | Votes | % | ±% | |
---|---|---|---|---|---|
Labour | T. Cruikshanks* | 1,132 | 61.4 | -14.7 | |
Liberal Democrats | S. Farrell | 713 | 38.6 | +25.7 | |
Majority | 419 | 22.7 | -40.5 | ||
Turnout | 32.9 | ||||
Registered electors | 5,618 | ||||
Labour hold | Swing | 20.2 | |||
Party | Candidate | Votes | % | ±% | |
---|---|---|---|---|---|
Labour | R. Fletcher* | 946 | 64.7 | +33.3 | |
Liberal Democrats | K. McGarrigle | 360 | 24.6 | +13.7 | |
Conservative | W. Perera | 157 | 10.7 | +7.3 | |
Majority | 586 | 40.1 | |||
Turnout | 32.7 | ||||
Registered electors | 4,475 | ||||
Labour gain from Independent | Swing | ||||
Party | Candidate | Votes | % | ±% | |
---|---|---|---|---|---|
Conservative | W. Jackson | 2,135 | 59.2 | +13.9 | |
Labour | G. Stillaway | 1045 | 29.0 | -20.1 | |
Liberal Democrats | J. Smith | 429 | 11.9 | New | |
Majority | 1090 | 30.2 | |||
Turnout | 44.6 | ||||
Registered electors | 8,094 | ||||
Conservative gain from Labour | Swing | 17.0 | |||
Party | Candidate | Votes | % | ±% | |
---|---|---|---|---|---|
Conservative | M. Van der Merwe | 1,919 | 59.2 | +23.0 | |
Labour | H.Bruce* | 1324 | 40.8 | -14.0 | |
Majority | 595 | 18.3 | |||
Turnout | 39.2 | ||||
Registered electors | 8,332 | ||||
Conservative gain from Labour | Swing | 18.5 | |||
Party | Candidate | Votes | % | ±% | |
---|---|---|---|---|---|
Liberal Democrats | M. Williamson | 2,011 | 65.3 | +25.4 | |
Labour | S. McKean | 932 | 30.3 | -29.8 | |
Conservative | P. Gill | 135 | 4.4 | New | |
Majority | 1079 | 35.1 | |||
Turnout | 35.3 | ||||
Registered electors | 8,740 | ||||
Liberal Democrats gain from Labour | Swing | 27.6 | |||
Party | Candidate | Votes | % | ±% | |
---|---|---|---|---|---|
Labour | R. Stringfellow* | 968 | 61.7 | -17.7 | |
Liberal Democrats | D. Wood | 376 | 23.9 | New | |
Conservative | A. Austin | 226 | 14.4 | +5.1 | |
Majority | 592 | 37.7 | |||
Turnout | 25.4 | ||||
Registered electors | 6,207 | ||||
Labour hold | Swing | 20.8 | |||
Party | Candidate | Votes | % | ±% | |
---|---|---|---|---|---|
Conservative | L. Hall | 1,658 | 52.1 | +22.7 | |
Labour | P. Davison | 783 | 24.6 | -14.9 | |
Liberal Democrats | E. Jellett | 739 | 23.2 | -7.9 | |
Majority | 875 | 27.5 | |||
Turnout | 43.7 | ||||
Registered electors | 7,286 | ||||
Conservative gain from Labour | Swing | 18.8 | |||
Party | Candidate | Votes | % | ±% | |
---|---|---|---|---|---|
Conservative | E. Hodson | 2,712 | |||
Conservative | C. Morgan* | 2,673 | |||
Labour | M. Cross | 713 | |||
Labour | M. Ormston | 615 | |||
Turnout | 48.2 | ||||
Registered electors | 7,315 | ||||
Conservative hold | Swing | ||||
Party | Candidate | Votes | % | ±% | |
---|---|---|---|---|---|
Conservative | L. Arkley* | 2,032 | 65.4 | +13.8 | |
Labour | A. Walker | 798 | 25.7 | -16.0 | |
Liberal Democrats | J. Smith | 277 | 8.9 | +2.3 | |
Majority | 1234 | 39.7 | |||
Turnout | 45.1 | ||||
Registered electors | 6,908 | ||||
Conservative hold | Swing | 14.9 | |||
Party | Candidate | Votes | % | ±% | |
---|---|---|---|---|---|
Labour | A. Potter* | 1,368 | 68.1 | ||
Conservative | S. Summers | 642 | 31.9 | ||
Majority | 726 | 36.1 | |||
Turnout | 29.1 | ||||
Registered electors | 6,944 | ||||
Labour hold | Swing | ||||
Party | Candidate | Votes | % | ±% | |
---|---|---|---|---|---|
Liberal Democrats | M. Huscroft* | 1,500 | 64.0 | -3.6 | |
Labour | A. Keith | 764 | 32.6 | +0.2 | |
Conservative | M. Smith | 79 | 3.4 | New | |
Majority | 736 | 31.4 | |||
Turnout | 37.7 | ||||
Registered electors | 6,229 | ||||
Liberal Democrats hold | Swing | 1.9 | |||
Party | Candidate | Votes | % | ±% | |
---|---|---|---|---|---|
Labour | J. Harrison* | 1,402 | 54.9 | -21.3 | |
Conservative | A. Appleton | 1150 | 45.1 | +21.3 | |
Majority | 252 | 9.9 | -42.4 | ||
Turnout | 32.8 | ||||
Registered electors | 7,808 | ||||
Labour hold | Swing | 21.3 | |||
Party | Candidate | Votes | % | ±% | |
---|---|---|---|---|---|
Conservative | M. McIntyre | 1,599 | 60.8 | +12.8 | |
Labour | L. Darke | 755 | 28.7 | -17.6 | |
Liberal Democrats | M. Rudling | 276 | 10.5 | +4.7 | |
Majority | 844 | 32.1 | |||
Turnout | 38.8 | ||||
Registered electors | 6,811 | ||||
Conservative hold | Swing | 15.2 | |||
Dorset County Council was a non-metropolitan county in England. Elections were first held on 23 January 1889, thereafter elections were held every three years, with all members being elected by the first past the post system of election on the same day. Later, the cycle was changed to one election in every four years, and the last such election was in 2017. There were also occasional by-elections, the last of which took place in December 2016.
Elections to South Tyneside Metropolitan Borough Council were held on 1 May 2008.
Local elections were held in the United Kingdom in 1978. Elections took place in the London boroughs and metropolitan districts.
Local elections were held in the United Kingdom on 3 May 1979. The results provided some source of comfort to the Labour Party, who recovered some lost ground from local election reversals in previous years, despite losing the general election to the Conservative Party on the same day. The Liberals also gained councillors and a council.
The 1986 United Kingdom local elections were held on Thursday 8 May 1986. There was a 3% reduction in the number of councillors, owing to the abolition of the Greater London Council and the Metropolitan County Councils.
The 1988 United Kingdom local elections were held on Thursday 5 May 1988. The Conservative government held its ground and remained ahead in the projected popular vote.
Elections to North Warwickshire District Council were held on Thursday 5 May 2011.
The 1996 North Tyneside Metropolitan Borough Council election to the North Tyneside Metropolitan Borough Council was held on 2 May 1996 alongside other local elections. Labour held control of the council after the elections, gaining seats from the Conservatives, matching the national trend.
The 1999 North Tyneside Metropolitan Borough Council election to the North Tyneside Metropolitan Borough Council were held in 1999 alongside other local elections. Labour held control of the council after the election.
The 2006 Stockport Metropolitan Borough Council election took place on 4 May 2006 to elect members of Stockport Metropolitan Borough Council in England. This was on the same day as other local elections. One third of the council was up for election, with each successful candidate serving a four-year term of office, expiring in 2010. The Liberal Democrats held overall control of the council.
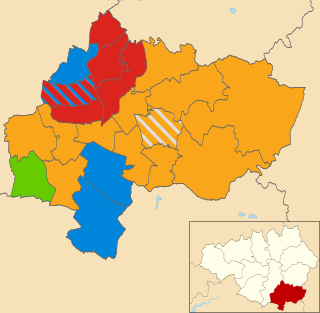
The 2004 Stockport Metropolitan Borough Council election took place on 10 June 2004 to elect members of Stockport Metropolitan Borough Council in England. This was on the same day as other local elections. Due to demographic changes in the Borough since its formation in 1973, and in common with most other English Councils in 2004, boundary changes were implemented in time for these elections. Due to these changes, it was necessary for the whole Council to be re-elected for the first time since 1973. The Liberal Democrats held overall control of the council.
Oxton is a Wirral Metropolitan Borough Council ward in the Birkenhead Parliamentary constituency.
The 1973 Tyne and Wear County Council election was held on 12 April 1973 as part of the first elections to the new local authorities established by the Local Government Act 1972 in England and Wales. 104 councillors were elected from 95 electoral divisions across the region's five boroughs. Each division returned either one or two county councillors each by First-past-the-post voting for a four-year term of office. The election took place ahead of the elections to the area's metropolitan borough councils, which followed on 10 May 1973.
Bebington is a Wirral Metropolitan Borough Council ward in the Wirral South Parliamentary constituency.
The 1973 Derby Borough Council election took place on 7 June 1973 to elect members of Derby Borough Council in England. This was on the same day as other local elections. Voting took place across 18 wards, each electing 3 Councillors. Following the Local Government Act 1972, this was the first election to the new non-metropolitan district council for Derby, which came into being on 1 April the following year. The Labour Party took control of the Council after winning a majority of seats.
On 3 May 2007, an election was held to elect councillors to the North Warwickshire Borough Council on the same day as other local elections in the UK. It resulted in the Conservative Party gaining control of the council. The previous election resulted in no overall control with the Labour Party having the highest number of seats at 16.
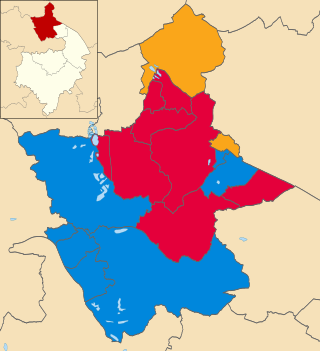
On 1 May 2003, an election was held to elect councillors to the North Warwickshire Borough Council on the same day as other local elections in the UK. It was the first election to take place under the new ward boundaries, with one extra seat from the previous 34 seats added. All 35 seats were up for election and the result was no overall control with the Labour Party having the most seats at 16. The previous election had resulted in the council being controlled by Labour.

On 6 May 1999, an election was held to elect councillors to the North Warwickshire Borough Council on the same day as other local elections in the UK. It resulted in the Labour Party keeping control of the council. All 34 seats were up for election in all wards.
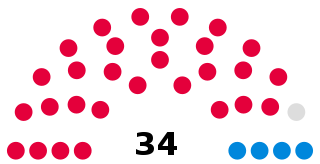
An election was held on 4 May 1995 to elect all 34 members of the North Warwickshire Borough Council in England. It resulted in the Labour Party retaining control of the council.
The 1973 Ipswich Borough Council election was the first election to the new Ipswich Borough Council which had been established by the Local Government Act 1972 in England and Wales. It took place as part of the 1973 United Kingdom local elections.