Council composition
Whilst under Labour control solidly since 1973, the political composition of Sunderland City Council has fluctuated over the years as the Conservatives, SDP-Liberal Alliance, and Independents gained seats from the Labour Party. Until 2019, only Labour, Conservatives, Liberal Democrats and Independents (including Independent Labour) had ever won seats on Sunderland City Council. [2] When UKIP and Green Party councillors were elected in 2019, Sunderland became one of the few British councils with all five parties represented. The table below gives an impression of the council's composition based on local election results. [3]
| Election | Conservative | Labour | Liberal Democrat [4] | Independent | UKIP | Green | Reform UK | Total |
|---|
| | | | | | |
| 1973 | 21 | 56 | 0 | 1 | 0 | 0 | 0 | 78 |
| 1975 | 23 | 52 | 1 | 2 | 0 | 0 | 0 | 78 |
| 1976 | 26 | 49 | 1 | 2 | 0 | 0 | 0 | 78 |
| 1978 | 27 | 49 | 1 | 1 | 0 | 0 | 0 | 78 |
| 1979 | 24 | 53 | 0 | 1 | 0 | 0 | 0 | 78 |
| 1980 | 18 | 58 | 1 | 1 | 0 | 0 | 0 | 78 |
| 1982 | 15 | 49 | 8 | 3 | 0 | 0 | 0 | 75 |
| 1983 | 14 | 52 | 7 | 2 | 0 | 0 | 0 | 75 |
| 1984 | 13 | 53 | 7 | 2 | 0 | 0 | 0 | 75 |
| 1986 | 11 | 59 | 5 | 0 | 0 | 0 | 0 | 75 |
| 1987 | 10 | 61 | 4 | 0 | 0 | 0 | 0 | 75 |
| 1988 | 9 | 63 | 3 | 0 | 0 | 0 | 0 | 75 |
| 1990 | 8 | 64 | 3 | 0 | 0 | 0 | 0 | 75 |
| 1991 | 8 | 64 | 3 | 0 | 0 | 0 | 0 | 75 |
| 1992 | 8 | 64 | 3 | 0 | 0 | 0 | 0 | 75 |
| 1994 | 8 | 64 | 3 | 0 | 0 | 0 | 0 | 75 |
| 1995 | 5 | 67 | 3 | 0 | 0 | 0 | 0 | 75 |
| 1996 | 4 | 68 | 3 | 0 | 0 | 0 | 0 | 75 |
| 1998 | 4 | 68 | 3 | 0 | 0 | 0 | 0 | 75 |
| 1999 | 8 | 64 | 3 | 0 | 0 | 0 | 0 | 75 |
| 2000 | 10 | 62 | 3 | 0 | 0 | 0 | 0 | 75 |
| 2002 | 11 | 62 | 2 | 0 | 0 | 0 | 0 | 75 |
| 2003 | 9 | 63 | 1 | 2 | 0 | 0 | 0 | 75 |
| 2004 | 12 | 61 | 2 | 0 | 0 | 0 | 0 | 75 |
| 2006 | 13 | 59 | 2 | 1 | 0 | 0 | 0 | 75 |
| 2007 | 17 | 53 | 1 | 4 | 0 | 0 | 0 | 75 |
| 2008 | 22 | 48 | 1 | 4 | 0 | 0 | 0 | 75 |
| 2010 | 18 | 52 | 1 | 4 | 0 | 0 | 0 | 75 |
| 2011 | 14 | 56 | 1 | 4 | 0 | 0 | 0 | 75 |
| 2012 | 8 | 64 | 0 | 3 | 0 | 0 | 0 | 75 |
| 2014 | 8 | 63 | 0 | 4 | 0 | 0 | 0 | 75 |
| 2015 | 6 | 66 | 0 | 3 | 0 | 0 | 0 | 75 |
| 2016 | 6 | 67 | 1 | 1 | 0 | 0 | 0 | 75 |
| 2018 | 8 | 61 | 6 | 0 | 0 | 0 | 0 | 75 |
| 2019 | 12 | 51 | 8 | 0 | 3 | 1 | 0 | 75 |
| 2021 | 18 | 42 | 12 | 0 | 3 | 0 | 0 | 75 |
| 2022 | 18 | 41 | 14 | 1 | 0 | 0 | 0 | 75 |
| 2023 | 13 | 45 | 15 | 0 | 0 | 0 | 1 | 75 |
| 2024 | 10 | 53 | 12 | 0 | 0 | 0 | 0 | 75 |
| 2025 | 9 | 51 | 12 | 2 | 0 | 0 | 1 | 75 |
| 2026 | | | | | | | | |
| | | | | | | | |
This page is based on this
Wikipedia article Text is available under the
CC BY-SA 4.0 license; additional terms may apply.
Images, videos and audio are available under their respective licenses.
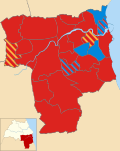 2004 results map
 2006 results map
 2007 results map
 2008 results map
 2010 results map
 2011 results map
 2012 results map
 2014 results map
 2015 results map
 2016 results map
 2018 results map
 2019 results map
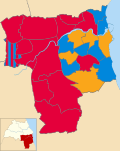 2021 results map
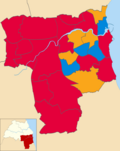 2022 results map
 2023 results map
 2024 results map


