This article needs additional citations for verification .(June 2014) |
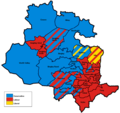
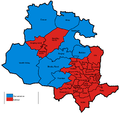
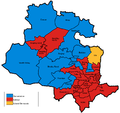
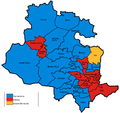
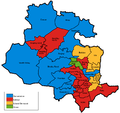
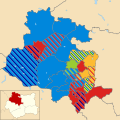
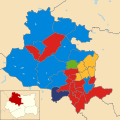
City of Bradford Metropolitan District Council elections are held three years out of every four to elect members to City of Bradford Metropolitan District Council in West Yorkshire, England. Since the last boundary changes in 2004 the council has comprised 90 councillors representing 30 wards, with each ward electing three councillors. [1]
Year | Labour | Conservative | Liberal Democrats | Green | UKIP | Respect | Queensbury Independents | Independent |
---|---|---|---|---|---|---|---|---|
2023 | 56 | 16 | 5 | 8 | 0 | 0 | 0 | 5 |
2022 | 52 | 21 | 6 | 6 | 0 | 0 | 0 | 5 |
2021 | 51 | 25 | 7 | 3 | 0 | 0 | 0 | 4 |
2019 | 53 | 22 | 7 | 2 | 0 | 0 | 1 | 5 |
2018 | 52 | 22 | 8 | 2 | 0 | 0 | 1 | 5 |
2016 | 49 | 21 | 10 | 3 | 0 | 0 | 2 | 6 |
2015 | 46 | 23 | 9 | 3 | 1 | 0 | 2 | 6 |
2014 | 46 | 21 | 8 | 3 | 1 | 0 | 2 | 9 |
2012 | 45 | 24 | 8 | 3 | 0 | 5 | 2 | 3 |
Party | Candidate | Votes | % | ±% | |
---|---|---|---|---|---|
Conservative | 2,041 | 50.4 | |||
Labour | 1,808 | 44.6 | |||
Liberal Democrats | 202 | 5.0 | |||
Majority | 233 | 5.8 | |||
Turnout | 4,051 | 34.8 | |||
Conservative gain from Labour | Swing | ||||
Party | Candidate | Votes | % | ±% | |
---|---|---|---|---|---|
Labour | 1,263 | 36.8 | -6.7 | ||
Conservative | 1,222 | 35.6 | -0.6 | ||
Green | 667 | 19.4 | +8.0 | ||
Liberal Democrats | 284 | 8.3 | -0.6 | ||
Majority | 41 | 1.2 | |||
Turnout | 3,436 | ||||
Labour hold | Swing | ||||
Party | Candidate | Votes | % | ±% | |
---|---|---|---|---|---|
Liberal Democrats | 1,614 | 52.3 | -1.0 | ||
Conservative | 1,077 | 34.9 | -0.7 | ||
Labour | 372 | 12.1 | +1.0 | ||
Independent | 22 | 0.7 | +0.7 | ||
Majority | 537 | 17.4 | |||
Turnout | 3,085 | 24.6 | |||
Liberal Democrats hold | Swing | ||||
Party | Candidate | Votes | % | ±% | |
---|---|---|---|---|---|
Labour | 1,227 | 60.2 | +18.5 | ||
Conservative | 538 | 26.4 | -14.2 | ||
Liberal Democrats | 272 | 13.4 | +4.3 | ||
Majority | 689 | 33.8 | |||
Turnout | 2,037 | 17.0 | |||
Labour hold | Swing | ||||
Party | Candidate | Votes | % | ±% | |
---|---|---|---|---|---|
Labour | Tony Niland | 1,014 | 44.0 | -8.4 | |
Conservative | Zameer Shah | 777 | 33.7 | +5.4 | |
Liberal Democrats | Rupert Oliver | 473 | 20.5 | +8.6 | |
Majority | 237 | 10.3 | |||
Turnout | 2,264 | 18.6 | |||
Labour hold | Swing | ||||
Party | Candidate | Votes | % | ±% | |
---|---|---|---|---|---|
Labour | 3,217 | 45.5 | +16.0 | ||
Conservative | 2,744 | 38.8 | -15.8 | ||
Liberal Democrats | 892 | 12.6 | -4.6 | ||
Independent | 203 | 2.9 | -2.0 | ||
Asian | 13 | 0.2 | +0.2 | ||
Majority | 473 | 6.7 | |||
Turnout | 7,069 | 53.3 | |||
Labour hold | Swing | ||||
Party | Candidate | Votes | % | ±% | |
---|---|---|---|---|---|
Conservative | Juliette Kinsey | 1,576 | 65.2 | -0.7 | |
Labour | James Newton | 642 | 26.6 | +4.7 | |
Liberal Democrats | James Stewart | 150 | 6.2 | -2.4 | |
Green | John Love | 50 | 2.1 | -1.9 | |
Majority | 934 | 38.6 | |||
Turnout | 2,418 | 20.0 | |||
Conservative hold | Swing | ||||
Party | Candidate | Votes | % | ±% | |
---|---|---|---|---|---|
Labour | Liz Devlin | 926 | 36.9 | -0.9 | |
Conservative | Richard Milczanowski | 764 | 30.4 | +8.3 | |
Liberal Democrats | Paul Michell | 692 | 27.6 | +10.5 | |
Green | Derek Curtis | 129 | 5.1 | -1.5 | |
Majority | 162 | 6.5 | |||
Turnout | 2,511 | 23.4 | |||
Labour gain from Conservative | Swing | ||||
Party | Candidate | Votes | % | ±% | |
---|---|---|---|---|---|
Conservative | Andrew Naylor | 1,304 | 57.0 | +13.4 | |
Labour | Steven Carter | 669 | 29.2 | +10.7 | |
Liberal Democrats | Frances McAulay | 315 | 13.8 | -3.7 | |
Majority | 635 | 27.8 | |||
Turnout | 2,288 | 18.7 | |||
Conservative hold | Swing | ||||
Party | Candidate | Votes | % | ±% | |
---|---|---|---|---|---|
Labour | Angela Sinfield | 1,819 | 47.0 | +22.2 | |
BNP | Ian Dawson | 1,216 | 31.4 | +2.3 | |
Conservative | Lionel Lockley | 627 | 16.2 | -3.8 | |
Liberal Democrats | Victoria Salmons | 208 | 5.4 | -4.8 | |
Majority | 603 | 15.6 | |||
Turnout | 3,870 | 35.1 | |||
Labour gain from BNP | Swing | ||||
Party | Candidate | Votes | % | ±% | |
---|---|---|---|---|---|
Conservative | John Allan Pennington | 1,949 | |||
Labour | Andrew David Mawson | 689 | |||
Liberal Democrats | Jean Taylor | 332 | |||
Green | Arthur Albert John Arnold | 175 | |||
Democratic Nationalists | Jim Lewthwaite | 61 | |||
UKIP | Jason Paul Smith | 49 | |||
Majority | 1,260 | ||||
Turnout | 3,262 | 24.99 |
Party | Candidate | Votes | % | ±% | |
---|---|---|---|---|---|
Conservative | Russell Brown | 1,020 | |||
Labour | Mark Bernard Curtis | 697 | |||
Green | Robert Edward Swindells | 235 | |||
Liberal Democrats | Sharon Catherine Purvis | 180 | |||
Majority | 323 | ||||
Turnout | 2,139 | 19.46 |
Party | Candidate | Votes | % | ±% | |
---|---|---|---|---|---|
Labour | Abdul Jabar | 1,993 | 58.6 | -1.1 | |
Conservative | Mehrban Hussain | 705 | 20.7 | -5.0 | |
Liberal Democrats | Mary Slingsby | 337 | 9.9 | -3.3 | |
UKIP | Jason Paul Smith | 294 | 8.6 | (+8.6) | |
Green | Celia Ruth Hickson | 73 | 2.1 | (+2.1) | |
Majority | 1,288 | 37.9 | +3.9 | ||
Turnout | 3,402 | 27.1 | -8.5 | ||
Labour hold | Swing | 3.9 | |||
Party | Candidate | Votes | % | ±% | |
---|---|---|---|---|---|
Conservative | Jackie Whiteley | 1,353 | 54.03 | −6.77 | |
Labour | David Green | 485 | 19.37 | +0.63 | |
Green | Janet Souyave | 320 | 12.78 | −2.47 | |
Liberal Democrats | Paul Treadwell | 222 | 8.87 | +3.66 | |
UKIP | Samuel Fletcher | 124 | 4.95 | N/A | |
Majority | 868 | 34.66 | |||
Turnout | 2,516 | 27.51 | −13.02 | ||
Conservative hold | Swing | ||||
Party | Candidate | Votes | % | ±% | |
---|---|---|---|---|---|
Labour | Joanne Lisa Sharp | 1,207 | 51 | ||
UKIP | Jason Paul Smith | 655 | 27 | ||
Conservative | Richard Ian Sheard | 451 | 19 | ||
Liberal Democrats | Angharad Elizabeth Griffiths | 70 | 3 | ||
Majority | 552 | 23 | |||
Turnout | 2,383 | 23 | |||
Labour hold | Swing | ||||
Party | Candidate | Votes | % | ±% | |
---|---|---|---|---|---|
Conservative | Andrew John Senior | 2,175 | 56 | ||
Independent | Jason Paul Smith | 732 | 19 | ||
Labour | Mobeen Hussain | 697 | 18 | ||
Green | Eithne Mary Dodwell | 143 | 4 | ||
Liberal Democrats | Mary Whitrick | 135 | 3 | ||
Majority | 1,443 | 37 | |||
Turnout | 3,882 | 32 | |||
Conservative hold | Swing | ||||
Party | Candidate | Votes | % | ±% | |
---|---|---|---|---|---|
Liberal Democrats | Rachel Sunderland | 1,733 | 51.3 | ||
Labour | Amriz Hussain | 1,153 | 34.1 | ||
Conservative | Ranbir Singh | 418 | 12.4 | ||
Green | Phil Worsnop | 73 | 2.2 | ||
Majority | 580 | 17.2 | |||
Turnout | 3,377 | ||||
Liberal Democrats gain from Labour | Swing | ||||
Bowling and Barkerend is an electoral ward within the City of Bradford Metropolitan District Council. The population at the 2011 Census was 20,618.
Sunderland City Council elections are generally held three years out of every four, with a third of the council being elected each time. Sunderland City Council is the local authority for the metropolitan borough of the City of Sunderland in Tyne and Wear, England. Since the last boundary changes in 2004, 75 councillors have been elected from 25 wards.
Amber Valley Borough Council elections are held every four years to elect councillors to Amber Valley Borough Council, the local authority for the non-metropolitan district of Amber Valley in Derbyshire, England. Since the last boundary changes in 2023, 42 councillors have been elected to represent 18 wards. Prior to 2023 a third of the council was elected three years out of every four.
One third of Leeds City Council in the City of Leeds, West Yorkshire, England is elected each year, followed by no election in one year out of every four years. A total of 99 councillors have been elected from 33 electoral wards across Leeds since 1980.
Preston City Council elections are generally held three years out of every four, with a third of the council elected each time. Preston City Council is the local authority for the non-metropolitan district of Preston in Lancashire, England. Since the last boundary changes in 2019, 48 councillors have been elected from 16 wards.
Southampton City Council elections are held three out of every four years to elect members of Southampton City Council, the local authority for the city of Southampton in Hampshire, England. Since 1 April 1997 Southampton has been a unitary authority responsible for all local government functions; prior to this it was a non-metropolitan district beneath Hampshire County Council.
Barnsley Metropolitan Borough Council is the local authority for the Metropolitan Borough of Barnsley in South Yorkshire, England. One third of the council is elected each year, except for every fourth year when there is no election. Since the last boundary changes in 2004, councillors are elected from 21 wards.
Kirklees Council is the local authority for the metropolitan borough of Kirklees in West Yorkshire, England. Since the last boundary changes in 2004, the council has comprised 69 councillors representing 23 wards. Elections are held three years out of four, with one third of the councillors elected each time for a four-year term.
Stockport Metropolitan Borough Council elections are generally held three years out of every four, with a third of the council being elected each time. Stockport Metropolitan Borough Council is the local authority for the metropolitan borough of Metropolitan Borough of Stockport in Greater Manchester, England. Since the last boundary changes in 2004, 63 councillors have been elected from 21 wards. New ward boundaries are being prepared to take effect from the 2023 election.
Solihull Metropolitan Borough Council elections are generally held three years out of every four, with a third of the council being elected each time. Solihull Metropolitan Borough Council is the local authority for the metropolitan borough of Solihull in the West Midlands, England. Since the last boundary changes in 2004, 51 councillors have been elected from 17 wards.
Blaby District Council elections are held every four years. Blaby District Council is the local authority for the non-metropolitan district of Blaby in Leicestershire, England. Since the last boundary changes in 2023 the council has comprised 36 councillors representing 17 wards, with each ward electing one, two or three councillors.
One third of Crawley Borough Council in West Sussex, England is elected each year, followed by one year without election. Since the last boundary changes in 2019, 36 councillors have been elected from 13 wards.
Derby City Council elections are held every four years to elect members of Derby City Council, the local authority for the unitary authority of Derby in Derbyshire, England. Since the last boundary changes in 2023, 51 councillors have been elected from 18 wards. Prior to 2023 elections were held three years out of every four, with a third of the council elected each time.
City of Wolverhampton Council elections are held three years out of every four, with a third of the council elected each time. City of Wolverhampton Council is the local authority for the metropolitan borough of Wolverhampton in the West Midlands, England. Since the last boundary changes in 2004, 60 councillors have been elected from 20 wards.
One third of the City of Lincoln Council in Lincolnshire, England is elected each year, followed by one year when there is an election to Lincolnshire County Council instead. Since the last boundary changes in 2016 the council has comprised 33 councillors representing 11 wards, with each ward electing three councillors.
Rossendale Borough Council elections are generally held three years out of every four, with a third of the council elected each time. Rossendale Borough Council is the local authority for the non-metropolitan district of Rossendale in Lancashire, England. Since the last boundary changes in 2002, 36 councillors have been elected from 14 wards. At the 2024 election, new ward boundaries will be in effect and the number of councillors will decrease to 30.
Worcester City Council elections are held three years out of every four, with a third of the council elected each time. Worcester City Council is the local authority for the non-metropolitan district of Worcester in Worcestershire, England. Since the last boundary changes in 2004, 35 councillors have been elected from 15 wards.
Elections to Maidstone Borough Council in Kent, United Kingdom are held each year to elect one-third of its members, followed by one year without election. Since the last boundary changes in 2002, 55 councillors have been elected from 26 wards. From 2023 onwards, the format of elections will change, with all 55 councillors being elected once every 4 years.
City of Bradford Metropolitan District Council is the local authority of the City of Bradford in West Yorkshire, England. It is a metropolitan district council, one of five in West Yorkshire and one of 36 in the metropolitan counties of England, and provides the majority of local government services in Bradford. Since 2014 it has been a constituent member of the West Yorkshire Combined Authority.
The Butetown electoral ward of Cardiff covers the Cardiff Bay area of the city, electing a councillor to Cardiff Council.
{{cite web}}
: CS1 maint: archived copy as title (link){{cite web}}
: CS1 maint: archived copy as title (link)