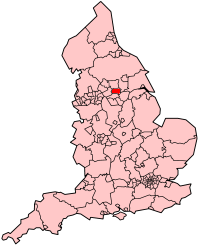
The 2018 Wakefield Metropolitan Borough Council election took place on 3 May 2018 to elect members of Wakefield Metropolitan District Council in England. [1] The election was held on the same day as other local elections. The Labour Party and the Conservative Party fielded a full slate of 21 candidates, as well as 12 Liberal Democrats, 6 Yorkshire Party candidates, 4 Green Party candidates, 3 UK Independence Party candidates, 1 Trade Unionist and Socialist Coalition candidate and 1 Democrats and Veteran's Party candidate. [2]
The make up of the Council following the election was:
Party | Seats | Current Council (2018) | ||||||||||||||||||||||||||||||||||||||||||||||||||||||||||||||||||
---|---|---|---|---|---|---|---|---|---|---|---|---|---|---|---|---|---|---|---|---|---|---|---|---|---|---|---|---|---|---|---|---|---|---|---|---|---|---|---|---|---|---|---|---|---|---|---|---|---|---|---|---|---|---|---|---|---|---|---|---|---|---|---|---|---|---|---|---|
2014 [3] | 2015 [4] | 2016 [5] | 2018 [6] | |||||||||||||||||||||||||||||||||||||||||||||||||||||||||||||||||
Labour | 54 | 53 | 53 | 52 | ||||||||||||||||||||||||||||||||||||||||||||||||||||||||||||||||
Conservative | 6 | 6 | 7 | 11 | ||||||||||||||||||||||||||||||||||||||||||||||||||||||||||||||||
UKIP | 2 | 2 | 2 | 0 | ||||||||||||||||||||||||||||||||||||||||||||||||||||||||||||||||
Independent | 1 | 2 | 1 | 0 | ||||||||||||||||||||||||||||||||||||||||||||||||||||||||||||||||
Party | Seats | Gains | Losses | Net gain/loss | Seats % | Votes % | Votes | +/− | |
---|---|---|---|---|---|---|---|---|---|
Labour | 16 | 1 | 2 | -1 | 76 | 51.7 | 35,344 | -1.7 | |
Conservative | 5 | 4 | 0 | +4 | 24 | 34.0 | 23,236 | +10.7 | |
Liberal Democrats | 0 | 0 | 0 | 0 | 0 | 4.9 | 3347 | +1.4 | |
Independent | 0 | 0 | 1 | -1 | 0 | 3.9 | 2633 | +0.0 | |
Yorkshire | 0 | 0 | 0 | 0 | 0 | 3.0 | 2023 | +1.3 | |
UKIP | 0 | 0 | 2 | -2 | 0 | 1.1 | 766 | -10.4 | |
Green | 0 | 0 | 0 | 0 | 0 | 1.1 | 749 | +0.0 | |
Democrats and Veterans | 0 | 0 | 0 | 0 | 0 | 0.2 | 140 | +0.2 | |
TUSC | 0 | 0 | 0 | 0 | 0 | 0.2 | 135 | -1.2 |
Party | Candidate | Votes | % | ±% | |
---|---|---|---|---|---|
Labour | Allan Garbutt | 1,383 | 42.3 | 0.9 | |
Conservative | Philip Davies | 817 | 25.0 | 2.8 | |
Independent | Gwen Marshall | 461 | 14.1 | New | |
Yorkshire | Martin Roberts | 286 | 8.8 | New | |
Green | George Scogings | 202 | 6.2 | New | |
Liberal Democrats | Mary MacQueen | 119 | 3.6 | New | |
Majority | 566 | 17.3 | 8.7 | ||
Turnout | 3,268 | 25.3 | 4.9 | ||
Rejected ballots | 5 | ||||
Labour hold | Swing | 1.9 | |||
Party | Candidate | Votes | % | ±% | |
---|---|---|---|---|---|
Labour | Kathryn Scott | 1,662 | 76.2 | 21.8 | |
Conservative | Eamonn Mullins | 520 | 23.8 | 14.7 | |
Majority | 1,142 | 52.4 | 34.5 | ||
Turnout | 2,182 | 18.9 | 6.1 | ||
Rejected ballots | 10 | ||||
Labour hold | Swing | 4.0 | |||
Party | Candidate | Votes | % | ±% | |
---|---|---|---|---|---|
Labour | Jacquie Speight | 1,823 | 57.5 | 8.1 | |
Conservative | Anthony Hill | 888 | 28.0 | 13.9 | |
Yorkshire | Steven Crookes | 320 | 10.1 | New | |
Democrats and Veterans | John Thomas | 140 | 4.4 | New | |
Majority | 935 | 29.5 | 16.7 | ||
Turnout | 3,171 | 23.9 | 3.8 | ||
Rejected ballots | 9 | ||||
Labour hold | Swing | 2.9 | |||
Party | Candidate | Votes | % | ±% | |
---|---|---|---|---|---|
Labour | Denise Jeffrey | 1,652 | 60.9 | 6.0 | |
Yorkshire | Paul Phelps | 684 | 25.2 | New | |
Conservative | Joanne Smart | 377 | 13.9 | 6.2 | |
Majority | 968 | 35.7 | 18.2 | ||
Turnout | 2,713 | 22.4 | 4.4 | ||
Rejected ballots | 8 | ||||
Labour hold | Swing | 9.6 | |||
Party | Candidate | Votes | % | ±% | |
---|---|---|---|---|---|
Labour | Albert Manifield | 1,958 | 54.1 | 14.7 | |
Conservative | Susan Lodge | 1,268 | 35.0 | 15.2 | |
Liberal Democrats | Adam Belcher | 396 | 10.9 | 5.5 | |
Majority | 690 | 19.1 | 15.1 | ||
Turnout | 3,622 | 29.7 | 4.4 | ||
Rejected ballots | 11 | ||||
Labour hold | Swing | 0.3 | |||
Party | Candidate | Votes | % | ±% | |
---|---|---|---|---|---|
Labour | Richard Taylor | 2,238 | 75.8 | 4.8 | |
Conservative | Diane Dolby | 716 | 24.2 | 4.8 | |
Majority | 1,522 | 51.6 | 9.6 | ||
Turnout | 2,954 | 22.7 | 3.3 | ||
Rejected ballots | 38 | ||||
Labour hold | Swing | 4.8 | |||
Party | Candidate | Votes | % | ±% | |
---|---|---|---|---|---|
Labour | Sandra Pickin | 1,512 | 54.7 | 0.8 | |
Independent | Ian Womersley | 1,012 | 36.6 | New | |
Conservative | Terry Brown | 241 | 8.7 | 0.8 | |
Majority | 500 | 18.1 | 0.8 | ||
Turnout | 2,765 | 23.3 | 2.8 | ||
Rejected ballots | 3 | ||||
Labour hold | Swing | 17.9 | |||
Party | Candidate | Votes | % | ±% | |
---|---|---|---|---|---|
Conservative | Gillian Cruise | 1,790 | 44.7 | 23.6 | |
Labour | Melanie Jones | 1,583 | 39.5 | 1.8 | |
Liberal Democrats | Mark Goodair | 432 | 10.8 | 5.4 | |
Green | Richard Norris | 202 | 5.0 | New | |
Majority | 207 | 5.2 | New | ||
Turnout | 4,007 | 33.6 | 0.9 | ||
Rejected ballots | 11 | ||||
Conservative gain from Labour | Swing | 12.7 | |||
Party | Candidate | Votes | % | ±% | |
---|---|---|---|---|---|
Labour | Harry Ellis | 1,419 | 66.6 | 11.3 | |
Conservative | Joshua Spencer | 713 | 33.4 | 11.3 | |
Majority | 706 | 33.2 | 22.6 | ||
Turnout | 2,132 | 20.7 | 3.5 | ||
Rejected ballots | 29 | ||||
Labour hold | Swing | 11.3 | |||
Party | Candidate | Votes | % | ±% | |
---|---|---|---|---|---|
Labour | Susan Blezard | 1,777 | 70.8 | 3.8 | |
Conservative | Hilary Plumbley | 733 | 29.2 | 3.8 | |
Majority | 1,044 | 41.6 | 7.6 | ||
Turnout | 2,510 | 20.3 | 3.3 | ||
Rejected ballots | 21 | ||||
Labour hold | Swing | 3.8 | |||
Party | Candidate | Votes | % | ±% | |
---|---|---|---|---|---|
Conservative | Nick Farmer | 2,124 | 51.0 | 23.4 | |
Labour Co-op | Kerron Cross | 1,543 | 37.0 | 6.3 | |
Liberal Democrats | Tony Sargeant | 499 | 12.0 | 5.1 | |
Majority | 581 | 14.0 | New | ||
Turnout | 4,166 | 33.2 | 0.5 | ||
Rejected ballots | 12 | ||||
Conservative gain from UKIP | Swing | 8.6 | |||
Farmer was first elected as a UKIP Councillor for Ossett in 2014, but resigned his membership in 2017 and later joined the Conservatives.
Party | Candidate | Votes | % | ±% | |
---|---|---|---|---|---|
Labour | Clive Tennant | 1,724 | 60.2 | 11.6 | |
Conservative | Chris Hyomes | 714 | 24.9 | 11.2 | |
Yorkshire | Arnie Craven | 266 | 9.3 | New | |
Green | Rennie Smith | 162 | 5.7 | New | |
Majority | 1,010 | 35.3 | 22.3 | ||
Turnout | 2,866 | 22.5 | 5.8 | ||
Rejected ballots | 3 | ||||
Labour hold | Swing | 0.2 | |||
Party | Candidate | Votes | % | ±% | |
---|---|---|---|---|---|
Labour | George Ayre | 2,000 | 52.2 | 10.4 | |
Conservative | Amy Swift | 1,646 | 42.9 | 9.0 | |
Liberal Democrats | Daniel Woodlock | 188 | 4.9 | New | |
Majority | 354 | 9.3 | 1.4 | ||
Turnout | 3,834 | 31.9 | 3.6 | ||
Rejected ballots | 23 | ||||
Labour hold | Swing | 0.7 | |||
Party | Candidate | Votes | % | ±% | |
---|---|---|---|---|---|
Labour | Lynne Whitehouse | 1,755 | 55.1 | 13.5 | |
Independent | Wilf Benson | 844 | 26.5 | 24.5 | |
Conservative | Dianne Presha | 269 | 8.4 | 1.0 | |
Independent | Laurie Harrison | 233 | 7.3 | New | |
Independent | Jim Kenyon | 83 | 2.6 | New | |
Majority | 911 | 28.6 | New | ||
Turnout | 3,184 | 23.4 | 3.4 | ||
Rejected ballots | 7 | ||||
Labour gain from Independent Politician | Swing | 19.0 | |||
Harrison stood as Labour candidate for South Elmsall and South Kirby in 2014.
Party | Candidate | Votes | % | ±% | |
---|---|---|---|---|---|
Labour | Jacqui Williams | 1,700 | 48.7 | 3.6 | |
Conservative | Nathaniel Harvey | 1,230 | 35.2 | 3.7 | |
Liberal Democrats | Nicola Sinclair | 352 | 10.1 | 2.3 | |
UKIP | James Johnston | 209 | 6.0 | New | |
Majority | 470 | 13.5 | 7.3 | ||
Turnout | 3,491 | 27.8 | 3.2 | ||
Rejected ballots | 8 | ||||
Labour hold | Swing | 3.7 | |||
Party | Candidate | Votes | % | ±% | |
---|---|---|---|---|---|
Labour | Olivia Rowley | 1,918 | 64.9 | 12.7 | |
Conservative | Richard Wakefield | 594 | 20.1 | 4.4 | |
Green | Jody Gabriel | 183 | 6.2 | New | |
TUSC | Michael Griffiths | 135 | 4.6 | 1.0 | |
Liberal Democrats | Margaret Dodd | 124 | 4.2 | New | |
Majority | 1,324 | 44.8 | 21.1 | ||
Turnout | 2,954 | 26.0 | 4.4 | ||
Rejected ballots | 15 | ||||
Labour hold | Swing | 4.2 | |||
Party | Candidate | Votes | % | ±% | |
---|---|---|---|---|---|
Labour | Tracey Austin | 1,660 | 54.2 | 10.2 | |
Conservative | Antony Calvert | 890 | 29.1 | 12.5 | |
Yorkshire | Lucy Brown | 223 | 7.3 | New | |
UKIP | Keith Wells | 166 | 5.4 | 24.6 | |
Liberal Democrats | Natasha de Vere | 121 | 4.0 | 1.4 | |
Majority | 770 | 25.1 | 11.1 | ||
Turnout | 3,060 | 26.3 | 4.2 | ||
Rejected ballots | 13 | ||||
Labour hold | Swing | 1.2 | |||
Party | Candidate | Votes | % | ±% | |
---|---|---|---|---|---|
Conservative | Samantha Harvey | 2,625 | 54.3 | 16.9 | |
Labour | Kevin Barker | 1,781 | 36.8 | 2.3 | |
Liberal Democrats | Finbarr Cronin | 431 | 8.9 | 2.5 | |
Majority | 844 | 17.5 | New | ||
Turnout | 4,837 | 35.1 | 2.6 | ||
Rejected ballots | 14 | ||||
Conservative gain from Labour | Swing | 9.6 | |||
Party | Candidate | Votes | % | ±% | |
---|---|---|---|---|---|
Conservative | Nadeem Ahmed | 2,209 | 56.7 | 17.0 | |
Labour | Gwen Page | 1,250 | 32.1 | 2.2 | |
Yorkshire | Daniel Cochran | 234 | 6.0 | New | |
Liberal Democrats | David Currie | 205 | 5.3 | 0.4 | |
Majority | 959 | 24.6 | 14.8 | ||
Turnout | 3,898 | 37.0 | 2.2 | ||
Rejected ballots | 6 | ||||
Conservative hold | Swing | 7.4 | |||
Party | Candidate | Votes | % | ±% | |
---|---|---|---|---|---|
Labour | Kevin Swift | 1,478 | 51.6 | 5.3 | |
Conservative | Nathan Garbutt Moore | 1,183 | 41.3 | 14.1 | |
Liberal Democrats | John Clayton | 203 | 7.1 | 1.8 | |
Majority | 295 | 10.3 | 8.8 | ||
Turnout | 2,864 | 26.1 | 3.0 | ||
Rejected ballots | 8 | ||||
Labour hold | Swing | 4.4 | |||
Party | Candidate | Votes | % | ±% | |
---|---|---|---|---|---|
Conservative | Nic Stansby | 1,689 | 44.0 | 20.7 | |
Labour | Christine Sharman | 1,528 | 39.8 | 6.7 | |
UKIP | David Dews | 391 | 10.2 | 28.4 | |
Liberal Democrats | Esther Amis-Hughes | 227 | 5.9 | 1.0 | |
Majority | 161 | 4.2 | New | ||
Turnout | 3,835 | 31.4 | 2.7 | ||
Rejected ballots | 6 | ||||
Conservative gain from UKIP | Swing | 7.0 | |||
The City of Wakefield is a local government district with the status of a city and metropolitan borough in West Yorkshire, England. Wakefield, the largest settlement, is the administrative centre of the district. The population of the City of Wakefield at the 2011 Census was 325,837. The district includes the Five Towns of Castleford, Featherstone, Knottingley, Normanton and Pontefract. Other towns include Hemsworth, Horbury, Ossett, South Elmsall and South Kirkby. The city and district are governed by Wakefield Metropolitan District Council from the County Hall.
Bowling and Barkerend is an electoral ward within the City of Bradford Metropolitan District Council. The population at the 2011 Census was 20,618.
The 2002 Wakefield Metropolitan District Council election took place on 2 May 2002 to elect members of Wakefield Metropolitan District Council in West Yorkshire, England. One third of the council was up for election and the Labour party kept overall control of the council.
The 2006 Wakefield Metropolitan District Council election took place on 4 May 2006 to elect members of Wakefield Metropolitan District Council in West Yorkshire, England. One third of the council was up for election and the Labour party kept overall control of the council.
The 2007 Wakefield Metropolitan District Council election took place on 3 May 2007 to elect members of Wakefield Metropolitan District Council in West Yorkshire, England. One third of the council was up for election and the Labour party kept overall control of the council.
The 2012 police and crime commissioner elections were polls held in most police areas in England and Wales on Thursday 15 November. The direct election of police and crime commissioners (PCCs) was originally scheduled for May 2012 but was postponed in order to secure the passage of the Police Reform and Social Responsibility Act 2011 through the House of Lords. The government considers the elected commissioners to have a stronger mandate than the "unelected and invisible police authorities that they replace". The elections took place alongside by-elections for the House of Commons in Cardiff South and Penarth, Corby and Manchester Central, and a mayoral election in Bristol.
Wakefield Metropolitan District Council, also known as Wakefield Council, is the local authority of the City of Wakefield in West Yorkshire, England. It is a metropolitan district council and provides a full range of local government services including Council Tax billing, libraries, social services, processing planning applications, waste collection and disposal, and it is a local education authority. Wakefield is divided into 21 wards, electing 63 councillors. A third of the council is elected for three of every four years. The council was created by the Local Government Act 1972 and replaced the Wakefield City Council of the County Borough of Wakefield and several other authorities. Since 1974 Wakefield has held borough and city status and from this time would use the full title of the authority on all publications, signage, council vehicle fleet and documents, however from around 2005, like many other local authorities doing so at the time, the authority dropped the full title for the shorter Wakefield Council.
The 2014 St Helens Metropolitan Borough Council election took place on 22 May 2014 to elect members of St Helens Metropolitan Borough Council in Merseyside, England. One third of the council was up for election and the Labour Party stayed in overall control of the council.
The 2015 Wakefield Metropolitan District Council election took place on 7 May 2015 to elect members of Wakefield Metropolitan District Council in England. This was on the same day as other local elections. The Labour Party and Conservatives fielded a full slate of 21 candidates, with UKIP putting forward 17 candidates. There were 9 Green candidates, 9 TUSC candidates and 6 Liberal Democrat candidates. Also standing were 2 Yorkshire First representatives, and one Independent.
The 2016 Calderdale Metropolitan Borough Council election took place on 5 May 2016 to elect members of Calderdale Metropolitan Borough Council in England. This was on the same day as other local elections. One councillor was elected in each ward for a four-year term so the councillors elected in 2016 last stood for election in 2012. Each ward is represented by three councillors, the election of which is staggered, so only one third of the councillors was elected in this election. Before the election there was no overall control with a minority Labour administration. After the election there was still no overall control so the minority Labour administration continued.
The 2016 Wakefield Metropolitan Borough Council election took place on 5 May 2016 to elect members of Wakefield Metropolitan District Council in England. This was on the same day as other local elections. The Labour Party and the Conservative Party fielded a full slate of 21 candidates, with UK Independence Party putting forward 11 candidates, 9 Liberal Democrat candidates, 6 Trade Union and Socialist Coalition candidates, 5 Yorkshire First candidates, 3 Green Party candidates and 4 Independent candidates.
The 2018 United Kingdom local elections were held on Thursday 3 May 2018, with local council elections taking place in all 32 London boroughs, 34 metropolitan boroughs, 67 district and borough councils and 17 unitary authorities. There were also direct elections for the mayoralties of Hackney, Lewisham, Newham, Tower Hamlets and Watford.
The 2018 Plymouth City Council election took place on 3 May 2018 to elect members of Plymouth City Council in England. The election was won by the Labour Party, who gained enough seats to achieve an overall majority and took control of the council.
The 2019 United Kingdom local elections took place on Thursday 2 May 2019, with 248 English local councils, six directly elected mayors in England, and all 11 local councils in Northern Ireland being contested.
The 2019 Wakefield Metropolitan Borough Council election took place on 2 May 2019 to elect members of Wakefield Metropolitan District Council in England. The election was held on the same day as other local elections. The Labour Party and the Conservative Party fielded a full slate of 21 candidates, as well as 14 Liberal Democrats, 8 Yorkshire Party candidates, 7 UK Independence Party candidates, 6 Green Party candidates, 6 Independent candidates, 1 Socialist Alternative candidate and 1 Democrats and Veteran's Party candidate.
The 2022 Birmingham City Council election took place on 5 May 2022, with all 101 council seats up for election across 37 single-member and 32 two-member wards. The election was held alongside other local elections across Great Britain and town council elections in Sutton Coldfield.
The 2022 Manchester City Council election took place on 5 May 2022. One third of councillors on Manchester City Council were elected. This election was a part of the other local elections across the United Kingdom.
The 2022 Calderdale Metropolitan Borough Council election took place on 5 May 2022 to elect members of Calderdale Metropolitan Borough Council in England. One third of councillors — 17 out of 51, plus one vacancy in Ovenden ward were up for election. The election took place alongside other local elections across the United Kingdom.
The 2022 Wakefield Metropolitan District Council election took place on 5 May 2022 to elect members of Wakefield Council. This was on the same day as other local elections. 21 of the 63 seats were up for election.