| |||||||||||||||||||||||||||||||||||||||||||||||||||||||||||||||||||||
All 44 seats to Newcastle-under-Lyme Borough Council 23 seats needed for a majority | |||||||||||||||||||||||||||||||||||||||||||||||||||||||||||||||||||||
---|---|---|---|---|---|---|---|---|---|---|---|---|---|---|---|---|---|---|---|---|---|---|---|---|---|---|---|---|---|---|---|---|---|---|---|---|---|---|---|---|---|---|---|---|---|---|---|---|---|---|---|---|---|---|---|---|---|---|---|---|---|---|---|---|---|---|---|---|---|
| |||||||||||||||||||||||||||||||||||||||||||||||||||||||||||||||||||||
|
The 2018 Newcastle-under-Lyme Borough Council election took place on 3 May 2018 to elect members of Newcastle-under-Lyme Borough Council in England. [1] It was held on the same day as other local elections.
Newcastle-under-Lyme Borough Council decided in November 2015 to move to whole council elections, starting from this election. [2]
Party | Leader | Candidates | Seats | Votes | ||
---|---|---|---|---|---|---|
Labour | Tony Kearon | 44 | 20 | 25,469 | 39.7 | |
Conservative | Simon Tagg | 44 | 18 | 27,371 | 42.7 | |
Liberal Democrat | Marion Reddish | 15 | 3 | 3,516 | 5.5 | |
UKIP | 7 | 0 | 991 | 1.5 | ||
Green | 6 | 0 | 917 | 1.4 | ||
Independent | 13 | 3 | 5,859 | 9.1 |
Party | Candidate | Votes | % | ±% | |
---|---|---|---|---|---|
Independent | Bert Proctor | 986 | 44.0 | ||
Labour | Sue Moffatt | 818 | 36.5 | ||
Liberal Democrats | Ian Wilkes | 773 | 34.5 | ||
Labour | Tom Heavey | 714 | 31.8 | ||
Labour | Ian Ashbolt | 574 | 25.6 | ||
Conservative | Linda Hailstones | 529 | 23.6 | ||
Conservative | Peter Hailstones | 501 | 22.3 | ||
Conservative | Lawrence Whitworth | 357 | 15.9 | ||
Liberal Democrats | Ben Ireland | 208 | 9.3 | ||
Liberal Democrats | Kay Mitchell | 183 | 8.2 | ||
Party | Candidate | Votes | % | ±% | |
---|---|---|---|---|---|
Labour | Annabel Driver | 974 | 50.3 | ||
Labour | Andrew Fox-Hewitt | 882 | 45.6 | ||
Conservative | Jennifer Cooper | 879 | 45.4 | ||
Conservative | Dorinda Bailey | 854 | 44.1 | ||
Conservative | Chloe Mancey | 810 | 41.9 | ||
Labour | Robert Moss | 810 | 41.9 | ||
Green | Anthony Morris | 146 | 7.5 | ||
Liberal Democrats | Richard Virr | 92 | 4.8 | ||
Party | Candidate | Votes | % | ±% | |
---|---|---|---|---|---|
Conservative | Stephen Sweeney | 441 | 48.0 | ||
Labour | Michael Shenton | 394 | 42.9 | ||
UKIP | Gary Fedtschyschak | 52 | 5.7 | ||
Liberal Democrats | Morgan-Ross Inwood | 32 | 3.5 | ||
Party | Candidate | Votes | % | ±% | |
---|---|---|---|---|---|
Labour | Allison Gardner | 566 | 49.3 | ||
Labour | Sarah Pickup | 491 | 42.8 | ||
Conservative | Gail Benbow | 476 | 41.5 | ||
Conservative | David Cooper | 448 | 39.1 | ||
UKIP | Mark Barlow | 140 | 12.2 | ||
Party | Candidate | Votes | % | ±% | |
---|---|---|---|---|---|
Labour | Gillian Williams | 693 | 61.2 | ||
Labour | John Williams | 685 | 60.5 | ||
Conservative | Rita Gilmore | 301 | 26.6 | ||
Conservative | John Heesom | 243 | 21.4 | ||
UKIP | Lynn Dean | 150 | 13.2 | ||
Party | Candidate | Votes | % | ±% | |
---|---|---|---|---|---|
Labour Co-op | Emily Horsfall | 566 | 57.0 | ||
Labour Co-op | Christopher Spence | 528 | 53.2 | ||
Independent | Kenneth Owen | 186 | 18.7 | ||
Conservative | David Cooper | 166 | 16.7 | ||
Conservative | Thomas Cooper | 144 | 14.5 | ||
UKIP | Paul Daniels | 105 | 10.6 | ||
UKIP | Gordon Davies | 75 | 7.6 | ||
Liberal Democrats | Chris Moore | 61 | 6.1 | ||
Liberal Democrats | Arthur Richards | 47 | 4.7 | ||
Party | Candidate | Votes | % | ±% | |
---|---|---|---|---|---|
Labour Co-op | Tony Kearon | 291 | 58.9 | ||
Liberal Democrats | James Borg | 98 | 19.8 | ||
Conservative | Dan Grice | 78 | 15.8 | ||
Green | Paul Usher | 27 | 5.5 | ||
Party | Candidate | Votes | % | ±% | |
---|---|---|---|---|---|
Conservative | Gill Burnett | 817 | 39.0 | ||
Labour | Silvia Burgess | 717 | 34.2 | ||
Conservative | Helena Maxfield | 700 | 33.4 | ||
Labour | Laura Dillon | 694 | 33.1 | ||
Conservative | Kevin Johnson | 688 | 32.8 | ||
Labour | David Allport | 675 | 32.2 | ||
Independent | Simon Jones | 423 | 20.2 | ||
Independent | Darren Dawson | 405 | 19.3 | ||
UKIP | Geoffrey Locke | 402 | 19.2 | ||
Independent | Reg Bailey | 327 | 15.6 | ||
Party | Candidate | Votes | % | ±% | |
---|---|---|---|---|---|
Labour Co-op | Brian Johnson | 355 | 74.7 | ||
Conservative | Joseph Swift | 120 | 25.3 | ||
Party | Candidate | Votes | % | ±% | |
---|---|---|---|---|---|
Conservative | Paul Northcott | 962 | 77.6 | ||
Conservative | Barry Panter | 740 | 59.7 | ||
Labour | Deborah Faulks | 226 | 18.2 | ||
Labour | Deborah Fuller | 186 | 15.0 | ||
Liberal Democrats | David Beckett | 131 | 10.6 | ||
Party | Candidate | Votes | % | ±% | |
---|---|---|---|---|---|
Independent | Simon White | 936 | 57.0 | ||
Independent | Gary White | 842 | 51.3 | ||
Conservative | Graham Hutton | 500 | 30.5 | ||
Conservative | Nathan White | 323 | 19.7 | ||
Labour | Liam Searle | 252 | 15.3 | ||
Labour | Thomas Wilson | 201 | 12.2 | ||
Liberal Democrats | Andrew Wemyss | 100 | 6.1 | ||
Party | Candidate | Votes | % | ±% | |
---|---|---|---|---|---|
Conservative | David Harrison | 654 | 89.7 | ||
Labour | David Lee | 75 | 10.3 | ||
Party | Candidate | Votes | % | ±% | |
---|---|---|---|---|---|
Conservative | John Tagg | 1,244 | 56.8 | ||
Conservative | Trevor Johnson | 1,232 | 56.2 | ||
Conservative | John Cooper | 1,218 | 55.6 | ||
Labour | Colin Eastwood | 729 | 33.3 | ||
Labour | Jacqueline Olszewski | 718 | 32.8 | ||
Labour | Lesley Richards | 656 | 29.9 | ||
Green | Sean Adam | 253 | 11.5 | ||
Party | Candidate | Votes | % | ±% | |
---|---|---|---|---|---|
Conservative | Jill Waring | 573 | 43.0 | ||
Conservative | Paul Waring | 521 | 39.1 | ||
Labour | Angela Cooper | 430 | 32.3 | ||
Labour | Lynn Jackson | 423 | 31.7 | ||
Independent | Vic Jukes | 355 | 26.6 | ||
Independent | Nigel Morgan | 304 | 22.8 | ||
Party | Candidate | Votes | % | ±% | |
---|---|---|---|---|---|
Labour Co-op | Amelia Rout | 569 | 49.1 | ||
Labour Co-op | David Jones | 549 | 47.4 | ||
Conservative | Derrick Huckfield | 504 | 43.5 | ||
Conservative | James Vernon | 351 | 30.3 | ||
UKIP | Thomas Spokes | 67 | 5.8 | ||
Party | Candidate | Votes | % | ±% | |
---|---|---|---|---|---|
Labour Co-op | Kyle Robinson | 1,226 | 59.6 | ||
Labour Co-op | Sylvia Dymond | 1,154 | 56.1 | ||
Labour Co-op | Michael Stubbs | 1,001 | 48.7 | ||
Conservative | Nicholas Jellyman | 432 | 21.0 | ||
Conservative | Ben Lack | 421 | 20.5 | ||
Conservative | Graham Lovell | 417 | 20.3 | ||
Independent | Ray Williams | 410 | 19.9 | ||
Independent | Alexander Wright | 407 | 19.8 | ||
Party | Candidate | Votes | % | ±% | |
---|---|---|---|---|---|
Liberal Democrats | Marion Reddish | 713 | 48.6 | ||
Liberal Democrats | June Walklate | 616 | 42.0 | ||
Conservative | Pamela Jellyman | 455 | 31.0 | ||
Conservative | Rachel Mundy | 388 | 26.4 | ||
Labour | Susan Forrester-O'Neill | 341 | 23.2 | ||
Labour | Roger Wilkes | 271 | 18.5 | ||
Green | Gordon Pearson | 68 | 4.6 | ||
Party | Candidate | Votes | % | ±% | |
---|---|---|---|---|---|
Labour | Ruth Wright | 659 | 55.6 | ||
Labour | Elizabeth Shenton | 654 | 55.2 | ||
Conservative | Martin Johnson | 248 | 20.9 | ||
Conservative | Luke Mason | 219 | 18.5 | ||
Independent | Christopher Malkin | 181 | 5.3 | ||
Liberal Democrats | Hilary Jones | 128 | 10.8 | ||
Independent | Wenslie Naylon | 97 | 8.2 | ||
Liberal Democrats | Salwa El-Raheb-Booth | 95 | 8.0 | ||
Party | Candidate | Votes | % | ±% | |
---|---|---|---|---|---|
Conservative | Andrew Parker | 892 | 65.1 | ||
Conservative | Andrew Fear | 857 | 62.6 | ||
Labour | David Beardmore | 459 | 33.5 | ||
Labour | Wendy Brockie | 416 | 30.4 | ||
Party | Candidate | Votes | % | ±% | |
---|---|---|---|---|---|
Conservative | Simon Tagg | 1,534 | 65.0 | ||
Conservative | Gillian Heesom | 1,460 | 61.9 | ||
Conservative | Mark Holland | 1,448 | 61.4 | ||
Labour | Thomas Brayford | 582 | 24.7 | ||
Labour | Imogen Wilkes | 558 | 23.7 | ||
Labour | Solomon Gibson | 494 | 20.9 | ||
Green | Jade Taylor | 270 | 11.4 | ||
Liberal Democrats | Richard Whelan | 239 | 10.1 | ||
Party | Candidate | Votes | % | ±% | |
---|---|---|---|---|---|
Conservative | Julie Cooper | 644 | 45.1 | ||
Labour | Mark Olszewski | 639 | 44.7 | ||
Conservative | David Woolley | 622 | 43.6 | ||
Labour | Joan Winfield | 574 | 40.2 | ||
Green | Ann Beirne | 153 | 10.7 | ||
Party | Candidate | Votes | % | ±% | |
---|---|---|---|---|---|
Independent | Kenneth Owen | 282 | 40.3 | +21.6 | |
Labour | Peter Radford | 268 | 38.3 | -14.9 | |
UKIP | Mark Barlow | 86 | 12.3 | +1.7 | |
Conservative | Lawrence Whitworth | 49 | 7.0 | -9.7 | |
SDP | Lawrence Whitworth | 14 | 2.0 | N/A | |
Majority | |||||
Turnout | 699 | 17.1 | |||
Independent gain from Labour | Swing | ||||
Party | Candidate | Votes | % | ±% | |
---|---|---|---|---|---|
Conservative | Graham Hutton | 629 | 86.6 | -3.1 | |
Liberal Democrats | Salwa El-Raheb Booth | 97 | 13.4 | N/A | |
Majority | |||||
Turnout | 726 | 37.0 | |||
Conservative hold | Swing | ||||
Party | Candidate | Votes | % | ±% | |
---|---|---|---|---|---|
Labour | David Grocott | 902 | 42.7 | -14.3 | |
Conservative | Peter Hailstones | 762 | 36.1 | +19.4 | |
Independent | Lilian Barker | 376 | 17.8 | N/A | |
Liberal Democrats | Aidan Jenkins | 72 | 3.4 | -2.7 | |
Majority | |||||
Turnout | 2,112 | 50.1 | |||
Labour hold | Swing | ||||
Party | Candidate | Votes | % | ±% | |
---|---|---|---|---|---|
Conservative | Derrick Huckfield | 188 | 51.1 | +25.8 | |
Labour | Stephanie Talbot | 180 | 48.9 | -25.8 | |
Majority | |||||
Turnout | 368 | 18.3 | |||
Conservative gain from Labour | Swing | ||||
Ian Wilkes, elected as a Liberal Democrat, joined the Conservatives in February 2020. [3]
Four councillors elected as independents (Ken Owen, Bert Proctor, Gary White and Simon White) joined the Conservatives in November 2021, giving the party an overall majority on the council. [4]
John Cooper, elected as a Conservative, left the party in January 2022 to sit as an independent. [5]
The Borough of Newcastle-under-Lyme is a local government district with borough status in Staffordshire, England.
Havering London Borough Council, also known as Havering Council, is the local authority for the London Borough of Havering in Greater London, England. It is a London borough council, one of 32 in London. The council has been under no overall control since 2014; since 2022 it has been run by a coalition of the Havering Residents Association and Labour. The council is based at Havering Town Hall in Romford.
Torbay Council is the local authority for Torbay, a unitary authority with borough status in the ceremonial county of Devon, England. The council is based in Torquay.
The 2019 Gravesham Borough Council election took place on 2 May 2019 to elect members of the Gravesham Borough Council in Kent, England. It was held on the same day as other local elections. The Labour Party gained control of the council from the Conservative Party.
Aaron Stuart Bell is a British Conservative Party politician who was elected as the Member of Parliament (MP) for Newcastle-under-Lyme in the 2019 general election.
The 2019 Redcar and Cleveland Borough Council election took place on 2 May 2019 to elect members of Redcar and Cleveland Borough Council in England. This was on the same day as other local elections.
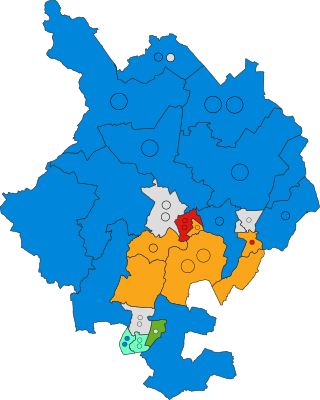
The 2019 Stratford-on-Avon District Council election took place on 2 May 2019 to elect members of the Stratford-on-Avon District Council in England. It was held on the same day as other local elections.
The 2019 Staffordshire Moorlands District Council election took place on 2 May 2019 to elect members of Staffordshire Moorlands District Council in England. This was on the same day as other local elections.
Elections to elect all members of the North West Leicestershire District Council took place on 2 May 2019, held as one of the English local elections of that year.
Elections to Lincolnshire County Council were held on 6 May 2021, alongside other local elections.
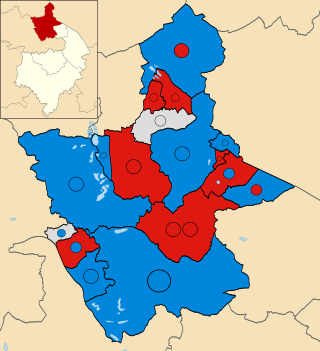
The 2022 North Yorkshire Council election took place on 5 May 2022, alongside the other local elections. These were the last elections to North Yorkshire County Council, and the elected councillors would also serve as the first councillors on the North Yorkshire Council, which replaced the existing county council in April 2023.
The 2019 East Lindsey District Council election took place on 2 May 2019 to elect all members of East Lindsey District Council in England. The Conservatives retained overall control of the council.
The 2022 Newcastle-under-Lyme Borough Council election took place on 5 May 2022 to elect members of Newcastle-under-Lyme Borough Council in England. It was held on the same day as other local elections.
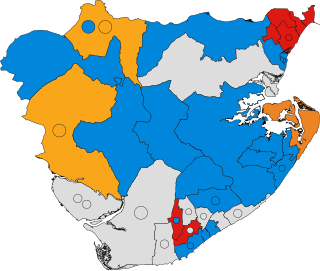
The 2023 Tendring District Council election took place on 4 May 2023 to elect all 48 members of Tendring District Council in Essex, England. This would be on the same day as other local elections across England and parish council elections in the district.
The 2023 Boston Borough Council election took place on 4 May, 2023, to elect all 30 members of Boston Borough Council in Lincolnshire, England.
The 2023 East Devon District Council election took place on 4 May 2023 to elect all 60 members of East Devon District Council in Devon, England. This was on the same day as other local elections across England.
The 2023 East Lindsey District Council election took place on 4 May 2023, to elect all 55 members of East Lindsey District Council in Lincolnshire, England. This was on the same day as other local elections across England.
The 2023 Melton Borough Council election took place on 4 May 2023, to elect all 28 members of Melton Borough Council in Leicestershire, England.
The 2023 North East Derbyshire District Council election took place on 4 May 2023 to elect all 53 members of North East Derbyshire District Council in Derbyshire, England. This was on the same day as other local elections across England.
The 2023 North Warwickshire Borough Council election took place on 4 May 2023, to elect all 35 members of North Warwickshire Borough Council in Warwickshire, England.