2018 St Albans City and District Council election

Last updated

2018 St Albans City and District Council election
FlagOfStAlbans-PS01.svg
  2016 3 May 2018 2019  

20 of the 58 seats to St Albans City and District Council
30 seats needed for a majority
 First partySecond partyThird party
 
Party Conservative Liberal Democrats Labour
Seats before32177
Seats won130
Seats after31196
Seat changeDecrease2.svg 1Increase2.svg 2Decrease2.svg 1
Popular vote17,02815,5288,592
Percentage38.2%34.9%19.3%

 Fourth partyFifth partySixth party
 
Party Independent Green UKIP
Seats before110
Seats won000
Seats after110
Seat changeSteady2.svgSteady2.svgSteady2.svg
Popular vote2313,008134
Percentage0.5%6.8%0.3%

St. Alban's 2018 ward results.svg

Council control before election

Conservative

Council control after election

Conservative

The 2018 St Albans City and District Council election took place on 3 May 2018 to elect members of St Albans City and District Council in England. [1] This was on the same day as other local elections. [2] [3]

Contents

Summary Results

St Albans City and District Council election, 2018
PartySeatsGainsLossesNet gain/lossSeats %Votes %Votes+/−
  Conservative 3112Decrease2.svg 138.217,028Increase2.svg2.4
  Liberal Democrats 1931Increase2.svg 234.915,528Increase2.svg9.6
  Labour 601Decrease2.svg 119.38,592Decrease2.svg1.8
  Independent 100Steady2.svg0.5231Decrease2.svg3.9
  Green 100Steady2.svg6.83,008Increase2.svg0.4
  UKIP 000Steady2.svg0.3134Decrease2.svg6.6

Ward results

Ashley

Ashley
PartyCandidateVotes%±%
Liberal Democrats Anthony Francis Rowlands 1,407 57.8 +20.4
Labour Jagat Mohan Chatrath55722.9-10.4
Conservative John Stephen Whale32613.4-3.3
Green Stephane Antoine Farenga1456.0-1.2
Majority85034.9+30.8
Liberal Democrats hold Swing

Batchwood

Batchwood
PartyCandidateVotes%±%
Labour Roma Mills 1,238 50.2 +4.5
Liberal Democrats Liz Needham57623.3+14.1
Conservative Nadine Louise Standish50820.6-9.9
Green Lucy Caroline Swift1465.9-0.8
Majority66226.9+11.7
Labour hold Swing

Clarence

Clarence
PartyCandidateVotes%±%
Liberal Democrats Caroline Mary Brooke 1,370 57.8 +6.9
Conservative Patti Seabright53322.5+1.3
Labour Alexander Charles Veitch30813.0-4.2
Green Mary Clare Henry1596.7-3.1
Majority83735.3+5.6
Liberal Democrats hold Swing

Colney Heath

Colney Heath
PartyCandidateVotes%±%
Liberal Democrats Jamie Day 853 53.1 +9.3
Conservative David Michael Johns43427.0-3.6
Labour Eileen Francis24215.1+2.3
Green Thomas William Langton784.9±0.0
Majority41926.1+12.9
Liberal Democrats hold Swing

Cunningham

Cunningham
PartyCandidateVotes%±%
Liberal Democrats Robert Graham Prowse 805 37.8 -2.0
Labour Muhammad Abdur Rahim59628.0+6.6
Conservative Sarah Georgina Tallon54425.6-1.1
Green Phil Fletcher1054.9-0.4
UKIP Alan Robert Malin783.7-6.1
Majority2099.8-3.3
Liberal Democrats hold Swing

Harpenden East

Harpenden East
PartyCandidateVotes%±%
Conservative Mary Maynard 1,048 52.1 +5.0
Liberal Democrats Guy Christian Cozon60430.0+17.6
Labour James Nathanie Gill36117.9+3.1
Majority44422.1-4.2
Conservative hold Swing

Harpenden North

Harpenden North
PartyCandidateVotes%±%
Conservative Paul Cousin 982 51.0 +3.7
Liberal Democrats Melanie Woutera Lucy Priggen58630.4+18.5
Labour Linda Ann Spiri24112.5-2.9
Green Ian Troughton1166.0N/A
Majority39620.6-6.4
Conservative hold Swing

Harpenden South

Harpenden South
PartyCandidateVotes%±%
Conservative Teresa Catherine Heritage 1,322 64.3 -0.6
Liberal Democrats Zoe Frances Galvin35017.0+5.2
Labour George Murray Fraser27413.3+1.1
Green Sally Leonard1115.4+0.6
Majority97247.3-5.4
Conservative hold Swing

Harpenden West

Harpenden West
PartyCandidateVotes%±%
Conservative Julian Francis Daly 1,377 58.2 +2.2
Liberal Democrats Alison Clare Woodley55323.4+7.5
Labour Michael Philip Gray-Higgins31313.2-1.3
Green Candy Whittome1255.3-1.9
Majority82434.8-5.3
Conservative hold Swing

London Colney

London Colney
PartyCandidateVotes%±%
Labour Katherine Lucy Gardner 963 38.9 -13.6
Conservative Robert Anthony Dunster78431.6+2.2
Liberal Democrats Tony Lillico39415.9+11.4
Independent John Midgley1716.9N/A
Green Matt Maddock1104.4+0.7
UKIP Charles Michael Mason562.3-7.6
Majority1797.3-15.8
Labour hold Swing

Marshalswick North

Marshalswick North
PartyCandidateVotes%±%
Liberal Democrats Tom Clegg 1,014 45.5 +1.6
Conservative Guillermo Claudio Duran77935.0+4.5
Labour Mary Winfred McIntyre30713.8+1.2
Green Dee Thomas1275.7-0.9
Majority23510.5-2.9
Liberal Democrats hold Swing

Marshalswick South

Marshalswick South
PartyCandidateVotes%±%
Liberal Democrats Helen Rosemary Campbell 1,113 41.2 +23.4
Conservative Craig Steven Fothergill92734.3-9.0
Labour Jonathan Brian Pearce45316.8-6.7
Green Jill Mills1465.4-5.2
Independent Susan Devi602.2N/A
Majority1866.9-12.9
Liberal Democrats gain from Conservative Swing

Park Street

Park Street
PartyCandidateVotes%±%
Conservative Stella Maria Nita Nash 1,008 44.0 +14.4
Liberal Democrats Syed Nafees Husain Abidi91840.1-3.1
Labour Janet Elizabeth Blackwell28212.3+1.0
Green Rosalind Mary Paul843.7+0.8
Majority903.9-9.7
Conservative gain from Liberal Democrats Swing

Redbourn

Redbourn
PartyCandidateVotes%±%
Conservative Victoria Caroline Mead 1,096 61.4 +28.0
Labour Anthony Eric Neville33018.5+7.1
Liberal Democrats Christopher James Millward Brattle22312.5N/A
Green Ruth Eleanor Farenga1357.6N/A
Majority76642.9+26.7
Conservative hold Swing

Sandridge

Sandridge
PartyCandidateVotes%±%
Conservative Beric Jonathan Read 786 51.2 -7.0
Liberal Democrats Stefania Estacchini33221.6+4.5
Labour Jonathan Bereton Hegerty24516.0+1.8
Green James Richard Lomas17211.2+0.8
Majority45429.6-11.5
Conservative hold Swing

Sopwell

Sopwell
PartyCandidateVotes%±%
Liberal Democrats Shakir Rahman 1,234 49.3 +12.1
Labour Iain Charles Grant83433.3-4.0
Conservative Heather Christine Rench33113.2-0.1
Green Frankie Drummond Charig1034.1-1.4
Majority40016.0+15.9
Liberal Democrats gain from Labour Swing

St Peters

St Peters
PartyCandidateVotes%±%
Liberal Democrats Jacqui Taylor 849 31.5 +4.0
Green Keith Michael Cotton78629.1+1.3
Conservative Alun Davies72126.7+1.5
Labour Mark Antony Ewington34112.6-3.7
Majority632.4+2.1
Liberal Democrats gain from Conservative Swing

St Stephen

St Stephen
PartyCandidateVotes%±%
Conservative Sue Featherstone 1,367 63.5 +8.4
Liberal Democrats Alison Ross47322.0+0.4
Labour Heather Jane Troy2129.9+0.2
Green Mark Stephen Charles Park-Crowne1004.6+1.5
Majority89441.5+8.0
Conservative hold Swing

Verulam

Verulam
PartyCandidateVotes%±%
Liberal Democrats Edgar Hill 1,593 56.5 +12.9
Conservative Nicholas Paul Verity85830.4-6.2
Labour Gordon Baisley2579.1-1.0
Green Josie McNally1134.0-0.4
Majority73526.1+19.1
Liberal Democrats hold Swing

Wheathampstead

Wheathampstead
PartyCandidateVotes%±%
Conservative Annie Brewster 1,297 66.1 +5.4
Liberal Democrats Andrew Peter Crofts28114.3-0.7
Labour Neill Sankey23812.1-1.4
Green Oliver James Hitch1477.5+2.4
Majority1,01651.8+8.1
Conservative hold Swing

Related Research Articles

<span class="mw-page-title-main">St Albans City and District</span> Local authority district in England

St Albans, also known as the City and District of St Albans, is a local government district with city status in Hertfordshire, England. Its council is based in St Albans, the largest settlement in the district. The district also includes the town of Harpenden and several villages. The district borders North Hertfordshire, Welwyn Hatfield, Hertsmere, Watford, Three Rivers, Dacorum, and Central Bedfordshire.

<span class="mw-page-title-main">St Albans (UK Parliament constituency)</span> Parliamentary constituency in the United Kingdom, 1801-1852 & 1885 onwards

St Albans is a constituency represented in the House of Commons of the UK Parliament since 2019 by Daisy Cooper, a Liberal Democrat.

Hertfordshire County Council in England is elected every four years. Since the last boundary changes took effect in 2017 there have been 78 electoral divisions electing one councillor each.

St Albans City and District Council elections are held three years out of every four to elect members of St Albans City and District Council in Hertfordshire, England. Since the last boundary changes in 2022 the council has comprised 56 councillors, with the district being divided into 20 wards. Elections to Hertfordshire County Council are held in the fourth year of the cycle when there are no district council elections.

<span class="mw-page-title-main">Natalie Suleyman</span> Australian politician

Natalie Suleyman is an Australian politician. She is a member of the Australian Labor Party, and is an elected member of the Victorian Legislative Assembly.

The 1998 St Albans City and District Council election took place on 7 May 1998 to elect members of St Albans City and District Council in Hertfordshire, England. One third of the council was up for election and the Liberal Democrats stayed in overall control of the council.

<span class="mw-page-title-main">1999 St Albans City and District Council election</span>

The 1999 St Albans City and District Council election took place on 6 May 1999 to elect members of St Albans City and District Council in Hertfordshire, England. The whole council was up for election with boundary changes since the last election in 1998 increasing the number of seats by 1. The Liberal Democrats lost overall control of the council to no overall control.

<span class="mw-page-title-main">2000 St Albans City and District Council election</span>

The 2000 St Albans City and District Council election took place on 4 May 2000 to elect members of St Albans District Council in Hertfordshire, England. One third of the council was up for election and the council stayed under no overall control.

<span class="mw-page-title-main">2002 St Albans City and District Council election</span>

The 2002 St Albans City and District Council election took place on 2 May 2002 to elect members of St Albans District Council in Hertfordshire, England. One third of the council was up for election and the council stayed under no overall control.
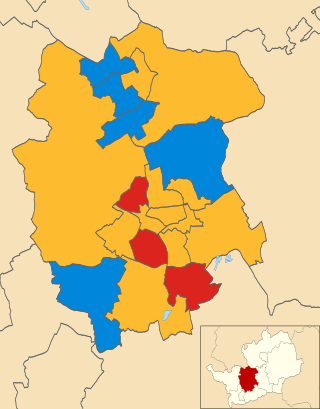
<span class="mw-page-title-main">2003 St Albans City and District Council election</span>

The 2003 St Albans City and District Council election took place on 1 May 2003 to elect members of St Albans District Council in Hertfordshire, England. One third of the council was up for election and the council stayed under no overall control.

<span class="mw-page-title-main">2004 St Albans City and District Council election</span>

The 2004 St Albans City and District Council election took place on 10 June 2004 to elect members of St Albans District Council in Hertfordshire, England. One third of the council was up for election and the council stayed under no overall control.

<span class="mw-page-title-main">2010 St Albans City and District Council election</span>

The 2010 St Albans City and District Council election took place on 6 May 2010 to elect members of St Albans District Council in Hertfordshire, England. One third of the council was up for election and the Liberal Democrats stayed in overall control of the council.

<span class="mw-page-title-main">2012 St Albans City and District Council election</span> 2012 UK local government election

The 2012 St Albans City and District Council election took place on 3 May 2012 to elect members of St Albans District Council in Hertfordshire, England. One third of the council was up for election and the council stayed under no overall control.

<span class="mw-page-title-main">2011 St Albans City and District Council election</span>

The 2011 St Albans City and District Council election took place on 5 May 2011 to elect members of St Albans District Council in Hertfordshire, England. One third of the council was up for election and the Liberal Democrats lost overall control of the council to no overall control.

<span class="mw-page-title-main">2014 St Albans City and District Council election</span> English local election

The 2014 St Albans City and District Council election took place on 22 May 2014 to elect members of St Albans District Council in Hertfordshire, England. One third of the council was up for election and the council stayed under no overall control.

<span class="mw-page-title-main">2015 St Albans City and District Council election</span> 2015 UK local government election

The 2015 St Albans City and District Council election took place on 7 May 2015 to elect members of St Albans City and District Council in England. This was on the same day as other local elections.

<span class="mw-page-title-main">2019 St Albans City and District Council election</span> Election

The 2019 St Albans City and District Council election took place on 2 May 2019 to elect members of St Albans City and District Council in England. This was on the same day as other local elections. At the elections, the Conservatives lost control of the council

<span class="mw-page-title-main">Daisy Cooper</span> Deputy Leader of the Liberal Democrats

Daisy Cooper is a British Liberal Democrat politician who has served as the Member of Parliament (MP) for St Albans since 2019. She has served as the Deputy Leader of the Liberal Democrats since 2020, and as the Liberal Democrat spokesperson for Health, Wellbeing and Social Care since 2021.
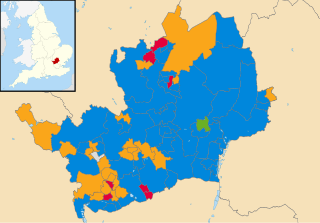
<span class="mw-page-title-main">2021 Hertfordshire County Council election</span>

Elections to Hertfordshire County Council took place on 6 May 2021 alongside other local elections in the United Kingdom. All 78 seats to the council were elected.

<span class="mw-page-title-main">2021 St Albans City and District Council election</span> Election

The 2021 St Albans City and District Council election took place on 6 May 2021, delayed by one year due to the COVID-19 pandemic, to elect members of St Albans City and District Council in England. This was on the same day as other local elections. At the elections, the Liberal Democrats achieved a majority for the first time since 2011 and took the council back from no overall control.

References

  1. "May 2018 Elections". St Albans City and District Council. Retrieved 8 December 2018.
  2. "Local council elections 2018 — results in full". The Guardian . Archived from the original on 16 May 2021. Retrieved 16 May 2021.
  3. "Local election results 2018: The results in maps and charts". BBC News . 5 May 2018. Archived from the original on 16 May 2021. Retrieved 16 May 2021.