Results maps
 1979 results map
 1983 results map
 1987 results map
 1991 results map
 1995 results map
 1999 results map
 2003 results map
 2007 results map
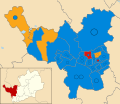 2011 results map
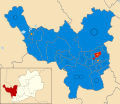 2015 results map
 2019 results map
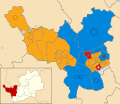 2023 results map
Dacorum Borough Council in Hertfordshire, England is elected every four years. Since the last boundary changes in 2007, 51 councillors have been elected from 25 wards. [1]
| Year | Conservative | Labour | Liberal Democrats [a] | Independents & Others | Council control after election | |||
|---|---|---|---|---|---|---|---|---|
| Local government reorganisation; council established (62 seats) | ||||||||
| 1973 | 25 | 33 | 0 | 4 | Labour | |||
| 1976 | 38 | 21 | 0 | 3 | Conservative | |||
| New ward boundaries (58 seats) | ||||||||
| 1979 | 32 | 23 | 0 | 3 | Conservative | |||
| 1983 | 36 | 17 | 3 | 2 | Conservative | |||
| 1987 | 40 | 8 | 10 | 0 | Conservative | |||
| 1991 | 38 | 16 | 4 | 0 | Conservative | |||
| 1995 | 19 | 33 | 4 | 2 | Labour | |||
| New ward boundaries (52 seats) | ||||||||
| 1999 | 26 | 17 | 6 | 0 | Conservative | |||
| 2003 | 32 | 14 | 6 | 0 | Conservative | |||
| New ward boundaries (51 seats) | ||||||||
| 2007 | 44 | 2 | 5 | 0 | Conservative | |||
| 2011 | 43 | 2 | 6 | 0 | Conservative | |||
| 2015 | 46 | 2 | 3 | 0 | Conservative | |||
| 2019 | 31 | 0 | 19 | 1 | Conservative | |||
| 2023 | 18 | 3 | 28 | 2 | Liberal Democrats | |||


| Party | Candidate | Votes | % | ±% | |
|---|---|---|---|---|---|
| Conservative | 1,338 | 69.4 | +26.6 | ||
| Labour | 496 | 25.7 | −19.0 | ||
| Liberal Democrats | 93 | 4.8 | −7.7 | ||
| Majority | 842 | 43.7 | |||
| Turnout | 1,927 | 36.0 | |||
| Conservative gain from Labour | Swing | ||||
| Party | Candidate | Votes | % | ±% | |
|---|---|---|---|---|---|
| Labour | 845 | ||||
| Labour | 802 | ||||
| Labour | 743 | ||||
| Liberal Democrats | 415 | ||||
| Liberal Democrats | 372 | ||||
| Liberal Democrats | 322 | ||||
| Conservative | 302 | ||||
| Conservative | 289 | ||||
| Conservative | 277 | ||||
| Turnout | 4,367 | 29.0 | |||
| Labour hold | Swing | ||||
| Labour hold | Swing | ||||
| Party | Candidate | Votes | % | ±% | |
|---|---|---|---|---|---|
| Conservative | Carol Green | 699 | |||
| Conservative | Ian Reay | 695 | |||
| Liberal Democrats | Garrick Stevens | 559 | |||
| Liberal Democrats | Peter Such | 521 | |||
| Labour | Bertram Bannister | 89 | |||
| Labour | Beryl Milne | 88 | |||
| Turnout | 2,651 | 32.6 | |||
| Conservative gain from Liberal Democrats | Swing | ||||
| Conservative gain from Liberal Democrats | Swing | ||||
| Party | Candidate | Votes | % | ±% | |
|---|---|---|---|---|---|
| Conservative | Susan Bradnock & Richard Roberts | 2,264 & 1,931 | 56.8 | −5.7 | |
| Liberal Democrats | David Griffiths & Carol Richardson | 896 & 755 | 22.5 | +2.5 | |
| Labour | Beryl Milnes & Alan Oliver | 827 & 769 | 20.7 | +3.3 | |
| Majority | 1,368 | 34.3 | |||
| Turnout | 3,987 | ||||
| Conservative hold | Swing | ||||
| Party | Candidate | Votes | % | ±% | |
|---|---|---|---|---|---|
| Labour | Alan Olive | 424 | 40.8 | −6.8 | |
| Conservative | Stephen Mark Holmes | 398 | 38.3 | −14.1 | |
| Liberal Democrats | Michael John Bethune | 204 | 19.6 | +19.6 | |
| UKIP | Barry Newton | 13 | 1.3 | +1.3 | |
| Majority | 26 | 2.5 | |||
| Turnout | 1,039 | 23.0 | |||
| Labour gain from Conservative | Swing | ||||
| Party | Candidate | Votes | % | ±% | |
|---|---|---|---|---|---|
| Labour | Paul Gronert | 770 | 52.7 | −5.7 | |
| Conservative | Kevin Minier | 516 | 35.3 | +9.6 | |
| Liberal Democrats | Janet Dashwood | 176 | 12.0 | −4.0 | |
| Majority | 254 | 17.4 | |||
| Turnout | 1,462 | 34.0 | |||
| Labour hold | Swing | ||||
| Party | Candidate | Votes | % | ±% | |
|---|---|---|---|---|---|
| Labour | Jane Hogg | 624 | 43.2 | +6.5 | |
| Conservative | Frances Ryan | 618 | 42.8 | −3.8 | |
| Liberal Democrats | Doreen Coburn | 201 | 13.9 | +0.0 | |
| Majority | 6 | 0.4 | |||
| Turnout | 1,443 | 33.4 | |||
| Labour gain from Conservative | Swing | ||||
| Party | Candidate | Votes | % | ±% | |
|---|---|---|---|---|---|
| Conservative | Fiona Guest | 552 | 46.8 | +10.2 | |
| Labour | Susan White | 514 | 43.6 | −1.0 | |
| Liberal Democrats | Stuart Watkin | 113 | 9.6 | −9.2 | |
| Majority | 38 | 3.2 | |||
| Turnout | 1,179 | 30.5 | |||
| Conservative gain from Labour | Swing | ||||
| Party | Candidate | Votes | % | ±% | |
|---|---|---|---|---|---|
| Conservative | Lucy Foster | 382 | 54.3 | +9.0 | |
| Labour | Mark Quinn | 276 | 39.2 | −4.0 | |
| Liberal Democrats | Gerald Coulter | 45 | 6.4 | −5.1 | |
| Majority | 106 | 15.1 | |||
| Turnout | 703 | 33.5 | |||
| Conservative hold | Swing | ||||
| Party | Candidate | Votes | % | ±% | |
|---|---|---|---|---|---|
| Liberal Democrats | Brenda Link | 835 | 52.8 | +19.0 | |
| Labour | Stephen Fisher | 498 | 31.5 | −15.0 | |
| Conservative | Kevin Minier | 249 | 15.7 | −3.9 | |
| Majority | 337 | 21.3 | |||
| Turnout | 1,582 | 30.1 | |||
| Liberal Democrats gain from Labour | Swing | ||||
| Party | Candidate | Votes | % | ±% | |
|---|---|---|---|---|---|
| Labour | Margaret Coxage | 570 | 39.3 | −3.9 | |
| Conservative | John Whitman | 457 | 31.5 | −12.2 | |
| Liberal Democrats | Stephen Wilson | 250 | 17.2 | +4.1 | |
| National Front | Simon Deacon | 106 | 7.3 | +7.3 | |
| Green | Paul Harris | 42 | 2.9 | +2.9 | |
| UKIP | Barry Newton | 26 | 1.8 | +1.8 | |
| Majority | 113 | 7.8 | |||
| Turnout | 1,451 | 40.2 | |||
| Labour gain from Conservative | Swing | ||||
| Party | Candidate | Votes | % | ±% | |
|---|---|---|---|---|---|
| Conservative | Dan Wood | 486 | 32.8 | −8.6 | |
| Labour | Sue White | 429 | 29.0 | −13.3 | |
| Liberal Democrats | Steve Wilson | 362 | 24.5 | +8.1 | |
| BNP | Janet Price | 203 | 13.7 | +13.7 | |
| Majority | 57 | 3.8 | |||
| Turnout | 1,480 | 35.8 | |||
| Conservative hold | Swing | ||||
| Party | Candidate | Votes | % | ±% | |
|---|---|---|---|---|---|
| Liberal Democrats | Rosemarie Hollinghurst | 593 | 64.7 | +29 | |
| Conservative | Paul Richardson | 305 | 33.1 | −24 | |
| Labour | Thomas Arden Wright | 18 | 1.9 | −4 | |
| Majority | 288 | 31 | |||
| Turnout | 916 | 47 | |||
| Liberal Democrats hold | Swing | 26% [17] | |||
| Party | Candidate | Votes | % | ±% | |
|---|---|---|---|---|---|
| Conservative | Rosie Sutton | 566 | 49.0 | ||
| Labour | Paul Eastwood | 406 | 35.1 | ||
| Liberal Democrats | Nitesh Dave | 70 | 6.1 | ||
| English Democrat | Simon Deacon | 47 | 4.1 | ||
| UKIP | Howard Koch | 43 | 3.7 | ||
| Green | Paul De Hoest | 24 | 2.1 | ||
| Majority | 160 | 13.8 | |||
| Turnout | 1159 | 27.24 | |||
| Conservative hold | Swing | ||||
Vacancy caused by resignation of Conservative incumbent Stephen Holmes. [19]
| Party | Candidate | Votes | % | ±% | |
|---|---|---|---|---|---|
| Liberal Democrats | Ron TINDALL | 363 | 32.6 | +18.1 | |
| Labour | Mike MOORE | 278 | 25.0 | −17.5 | |
| Conservative | Barry NEWTON | 229 | 20.6 | −22.5 | |
| UKIP | Noel SWINFORD | 193 | 17.3 | +17.3 | |
| English Democrat | Simon DEACON | 51 | 4.6 | +4.6 | |
| Majority | 85 | ||||
| Turnout | 4174 | 26.68 | |||
| Liberal Democrats gain from Labour | Swing | ||||
Vacancy caused by resignation of Labour incumbent. Percentage changes are since May 2011
| Party | Candidate | Votes | % | ±% | |
|---|---|---|---|---|---|
| Liberal Democrats | Adrian England | 520 | |||
| Conservative | Tony Gallagher | 233 | |||
| Labour | Gary Michael Cook | 166 | |||
| UKIP | Rachel Catherine Biggs | 115 | |||
| Green | Angela May Lynch | 17 | |||
| Majority | 287 | ||||
| Turnout | 1051 | 24.6 | |||
| Liberal Democrats gain from Conservative | Swing | ||||
| Party | Candidate | Votes | % | ±% | |
|---|---|---|---|---|---|
| Liberal Democrats | Lara Pringle | 545 | |||
| Conservative | Rob McCarthy | 260 | |||
| Labour | Harry Hawden | 97 | |||
| Green | Joe Pitts | 19 | |||
| Majority | 285 | ||||
| Turnout | 921 | 40.5 | |||
| Liberal Democrats gain from Conservative | Swing | ||||
| Party | Candidate | Votes | % | ±% | |
|---|---|---|---|---|---|
| Conservative | Neil Harden | 1,459 | 60.5 | +12.8 | |
| Labour | Ijlal Malik | 470 | 19.5 | −0.8 | |
| Liberal Democrats | Anna Wellings Purvis | 298 | 12.4 | −3.5 | |
| Green | Sherief Hassan | 185 | 7.7 | −8.4 | |
| Majority | 989 | 41.0 | |||
| Turnout | 2,412 | ||||
| Conservative hold | Swing | ||||
| Party | Candidate | Votes | % | ±% | |
|---|---|---|---|---|---|
| Liberal Democrats | Sheron Wilkie | 925 | 55.3 | +14.5 | |
| Conservative | Joseph Vardon-Hynard | 438 | 26.2 | +0.4 | |
| Green | Joe Stopps | 172 | 10.3 | −7.5 | |
| Labour | Jim Lawler | 137 | 8.2 | +0.7 | |
| Majority | 487 | 29.1 | |||
| Turnout | 1,672 | ||||
| Liberal Democrats hold | Swing | ||||
| Party | Candidate | Votes | % | ±% | |
|---|---|---|---|---|---|
| Liberal Democrats | Anne Foster | 924 | 64.1 | +13.9 | |
| Conservative | Gary Moore | 318 | 22.1 | −5.6 | |
| Green | Kevin Fielding | 130 | 9.0 | −5.9 | |
| Labour | Peter Scott | 69 | 4.8 | −2.5 | |
| Majority | 606 | 42.1 | |||
| Turnout | 1,441 | ||||
| Liberal Democrats hold | Swing | ||||
| Party | Candidate | Votes | % | ±% | |
|---|---|---|---|---|---|
| Liberal Democrats | Simy Dhyani | 1,319 | 60.5 | +18.3 | |
| Conservative | Brandon Geary | 599 | 27.5 | −4.3 | |
| Labour | Cameron Brady-Turner | 171 | 7.8 | −6.2 | |
| Green | Sherief Hassan | 92 | 4.2 | −7.8 | |
| Majority | 720 | 33.0 | |||
| Turnout | 2,181 | ||||
| Liberal Democrats hold | Swing | ||||
| Party | Candidate | Votes | % | ±% | |
|---|---|---|---|---|---|
| Liberal Democrats | Caroline Smith-Wright | 899 | 62.7 | ||
| Conservative | Mike Hicks | 303 | 21.1 | ||
| Green | Joe Stopps | 122 | 8.5 | ||
| Labour | James Lawler | 109 | 7.6 | ||
| Majority | 596 | 41.6 | |||
| Turnout | 1,433 | ||||
| Liberal Democrats hold | Swing | ||||
| Party | Candidate | Votes | % | ±% | |
|---|---|---|---|---|---|
| Labour | Lin Greenfield | 318 | 37.1 | ||
| Conservative | Mike Hicks | 313 | 36.5 | ||
| Green | Andrew Lambert | 102 | 11.9 | ||
| Reform | Christopher Morris | 92 | 10.7 | ||
| Liberal Democrats | Lloyd Harris | 32 | 3.7 | ||
| Majority | 5 | 0.6 | |||
| Turnout | 857 | ||||
| Labour gain from Independent | Swing | ||||
| Party | Candidate | Votes | % | ±% | |
|---|---|---|---|---|---|
| Conservative | Neil Harden | 347 | 43.7 | ||
| Liberal Democrats | Aatish Pattni | 174 | 21.9 | ||
| Labour | Mohamed Fawzi | 147 | 18.5 | ||
| Reform | Silvi Sutherland | 79 | 9.9 | ||
| Green | Christine Talbot | 47 | 5.9 | ||
| Majority | 173 | 21.8 | |||
| Turnout | 794 | ||||
| Conservative gain from Liberal Democrats | Swing | ||||
| Party | Candidate | Votes | % | ±% | |
|---|---|---|---|---|---|
| Liberal Democrats | Will Jankowski | 643 | 56.4 | ||
| Conservative | Ben Rolfe | 357 | 31.3 | ||
| Green | Rose Sheridan | 99 | 8.7 | ||
| Labour | Jim Lawler | 41 | 3.6 | ||
| Majority | 286 | 25.1 | |||
| Turnout | 1,140 | ||||
| Liberal Democrats hold | Swing | ||||