2016 St Albans City and District Council election

Last updated

2016 St Albans City and District Council election
FlagOfStAlbans-PS01.svg
  2015 5 May 2016 2018  

18 of the 58 seats to St Albans City and District Council
30 seats needed for a majority
 First partySecond partyThird party
 
Party Conservative Liberal Democrats Labour
Seats before31168
Seats won00
Seats after31177
Seat changeSteady2.svgIncrease2.svg 1Decrease2.svg 1
Popular vote14,0859,9538,313
Percentage35.9%25.4%21.2%

 Fourth partyFifth partySixth party
 
Party Independent Green UKIP
Seats before210
Seats won000
Seats after210
Seat changeSteady2.svgSteady2.svgSteady2.svg
Popular vote1,7272,4982,606
Percentage4.4%6.4%6.6%

 Seventh party
 
Party TUSC
Seats before0
Seats won0
Seats after0
Seat changeSteady2.svg
Popular vote23
Percentage0.1%

St Albans wards 2016.svg

Council control before election

Conservative

Council control after election

Conservative

2016 local election results in St Albans St Albans wards 2016.svg
2016 local election results in St Albans

The 2016 St Albans City and District Council election took place on 5 May 2016 to elect members of St Albans City and District Council in England. [1] This was on the same day as other local elections.

Contents

Summary Results

St Albans City and District Council election, 2016
PartySeatsGainsLossesNet gain/lossSeats %Votes %Votes+/−
  Conservative 3100Steady2.svg35.914,085-7.7
  Liberal Democrats 1710Increase2.svg 125.49,953+2.4
  Labour 701Decrease2.svg 121.28,313+2.7
  Independent 200Steady2.svg4.41,727+1.7
  Green 100Steady2.svg6.42,498+0.1
  UKIP 000Steady2.svg6.62,606+0.7
  TUSC 000Steady2.svg0.123+0.1

Ward results

Ashley

Ashley
PartyCandidateVotes%±%
Liberal Democrats Matthew Farrell 939 37.4 +7.8
Labour Momotaz Rahim83633.3+5.1
Conservative Robert Anthony Dunster42016.7-10.3
Green Lydia El-Khouri1817.2-0.9
UKIP Charles Michael Mason1355.4-1.7
Majority1034.1
Liberal Democrats gain from Labour Swing

Batchwood

Batchwood
PartyCandidateVotes%±%
Labour Mal Pakenham 1,027 45.7 +12.4
Conservative Scott Clyne68630.5-3.3
Liberal Democrats Ellie Hudspith2069.2-7.0
UKIP Matthew Dovey1777.9-1.4
Green Lesley Baker1516.7-0.7
Majority34115.2
Labour hold Swing

Clarence

Clarence
PartyCandidateVotes%±%
Liberal Democrats Chris White 1,178 50.9 +11.6
Conservative Barry Sumpter49021.2-12.4
Labour Liz Mills39717.2+0.5
Green Tim Robinson2269.80.0
TUSC Keith Hussey231.0+0.3
Majority68829.7
Liberal Democrats hold Swing

Cunningham

Cunningham
PartyCandidateVotes%±%
Liberal Democrats Geoff Harrison 760 39.8 +4.6
Conservative Nadine Standish45126.7-3.1
Labour John Paton40821.4+0.2
UKIP Alan Malin1889.8-0.8
Green Gregory Riener1025.3-0.9
Majority30913.1
Liberal Democrats hold Swing

Harpenden East

Harpenden East
PartyCandidateVotes%±%
Conservative Rosemary Farmer 967 46.1 -3.8
Independent Anne James41519.8N/A
Labour Rosemary Ross31114.8-0.8
Liberal Democrats Paul De Kort26012.4-1.7
UKIP Lester MacKenzie1446.9N/A
Majority55226.3
Conservative hold Swing

Harpenden North

Harpenden North
PartyCandidateVotes%±%
Conservative Stephen Hodgson 890 47.3 -6.4
Independent John Hansen38220.3N/A
Labour Linda Spiri28915.4+2.5
Liberal Democrats Aileen King22311.9+0.4
UKIP Stephen Hughes965.1N/A
Majority50827.0
Conservative hold Swing

Harpenden South

Harpenden South
PartyCandidateVotes%±%
Conservative David Heritage 1,201 64.9 -1.5
Labour George Fraser22512.2-2.3
Liberal Democrats Maria Moyses21911.8-0.3
UKIP Mick Hawkes1186.4N/A
Green Suheil Shahryar884.8N/A
Majority97652.7
Conservative hold Swing

Harpenden West

Harpenden West
PartyCandidateVotes%±%
Conservative Matthew Stephens 1,232 56.0 -4.9
Liberal Democrats Jeffrey Phillips34915.9+2.6
Labour Michael Gray-Higgins32014.5+0.1
Green Anna Kinnersley1587.2N/A
UKIP Jennifer Corsbie1416.4N/A
Majority88340.1
Conservative hold Swing

London Colney

London Colney
PartyCandidateVotes%±%
Labour Dreda Gordon 1,268 52.5 +16.6
Conservative Patrick Alderman71029.4-9.5
UKIP John Midgley2389.9-2.2
Liberal Democrats Jessica Holiday1094.5-4.5
Green James Lornas893.7-0.4
Majority55823.1
Labour hold Swing

Marshalswick North

Marshalswick North
PartyCandidateVotes%±%
Liberal Democrats Janet Churchard 937 43.9 +9.4
Conservative Claudio Duran65030.5-7.0
Labour Paul Walker26912.60.0
Green Claire Gilbert1406.6-0.1
UKIP Michael Hollins1386.5-1.3
Majority28713.4
Liberal Democrats hold Swing

Marshalswick South

Marshalswick South
PartyCandidateVotes%±%
Conservative Richard Curthoys 959 43.3 -1.2
Labour Richard Harris52023.5+6.7
Liberal Democrats John Hale39517.8-6.7
Green Jill Mills23510.6+1.5
UKIP David Dickson1054.7-0.3
Majority43919.8
Conservative hold Swing

Park Street

Park Street
PartyCandidateVotes%±%
Liberal Democrats David Yates 952 43.2 +13.8
Conservative Michael Roth65229.6-7.8
UKIP Peter Whitehead28713.0-1.5
Labour Martin McGrath24811.3-3.1
Green Lesley Baker1852.9-1.6
Majority30013.6
Liberal Democrats hold Swing

Redbourn

Redbourn
PartyCandidateVotes%±%
Independent Tony Swendell 930 49.6 -9.9
Conservative Maria Maynard62633.4-24.8
Labour Anthony Neville21411.4+3.8
UKIP Daragh Cahalane1065.7+5.5
Majority30416.2
Independent hold Swing

Sopwell

Sopwell
PartyCandidateVotes%±%
Labour Janet Smith 865 37.3 +2.6
Liberal Democrats Shakir Rahman86337.2+10.0
Conservative Heather Rench30913.3-9.4
UKIP Valerie Hargrave1546.6-1.5
Green Gail Jackson1275.5-1.8
Majority20.1
Labour hold Swing

St Peters

St Peters
PartyCandidateVotes%±%
Green Simon Grover 656 27.8 +11.7
Liberal Democrats Matt Jones65027.5+0.3
Conservative Nick Bishop59625.2-10.4
Labour Alex Veitch38516.3-0.6
UKIP Michael Douglas743.1-1.1
Majority60.3
Green hold Swing

St Stephen

St Stephen
PartyCandidateVotes%±%
Conservative Brian Gibbard 1,108 55.1 +4.8
Liberal Democrats Alison Ross43521.6-0.7
UKIP Tina Lomax21110.5-2.3
Labour Janet Blackwell1949.7-1.0
Green Jack Easton623.1-0.9
Majority67333.5
Conservative hold Swing

Verulam

Verulam
PartyCandidateVotes%±%
Liberal Democrats Chris Davies 1,186 43.6 +15.2
Conservative Stella Nash99736.6-11.2
Labour Michael Bartlet27510.1-2.0
UKIP Colin Donald1435.3±0.0
Green Mark Ewington1204.4-1.8
Majority1897.0
Liberal Democrats hold Swing

Wheathampstead

Wheathampstead
PartyCandidateVotes%±%
Conservative Greg Clark 1,141 58.7 -1.5
Liberal Democrats Harriet Sherlock29215.0-5.0
Labour Neill Sankey26213.5+1.3
UKIP Beverley Rands1517.8N/A
Green Ian Troughton995.1-2.5
Majority84943.7
Conservative hold Swing

By-elections between 2016 and 2018

A by-election was held in Clarence on 20th October 2016, after the resignation of Liberal Democrat councillor Sam Rowlands. The seat was held by the new Liberal Democrat candidate, Ellie Hudspith.

Clarence by-election, 20th October 2016
PartyCandidateVotes%±%
Liberal Democrats Ellie Hudspith 916 57.0 +6.1
Conservative Michael Roth38824.1+2.9
Labour Liz Mills19312.0-5.2
Green Keith Cotton986.1-3.7
UKIP David Dickson160.8N/A
Majority52832.9
Liberal Democrats hold Swing

Related Research Articles

Hertfordshire County Council in England is elected every four years. Since the last boundary changes took effect in 2017 there have been 78 electoral divisions electing one councillor each.

St Albans City and District Council elections are held three years out of every four to elect members of St Albans City and District Council in Hertfordshire, England. Since the last boundary changes in 2022 the council has comprised 56 councillors, with the district being divided into 20 wards. Elections to Hertfordshire County Council are held in the fourth year of the cycle when there are no district council elections.

<span class="mw-page-title-main">2008 St Albans City and District Council election</span>

The 2008 St Albans City and District Council election took place on 1 May 2008 to elect members of St Albans District Council in Hertfordshire, England. One third of the council was up for election and the Liberal Democrats gained overall control of the council from no overall control.

The 1998 St Albans City and District Council election took place on 7 May 1998 to elect members of St Albans City and District Council in Hertfordshire, England. One third of the council was up for election and the Liberal Democrats stayed in overall control of the council.

<span class="mw-page-title-main">1999 St Albans City and District Council election</span>

The 1999 St Albans City and District Council election took place on 6 May 1999 to elect members of St Albans City and District Council in Hertfordshire, England. The whole council was up for election with boundary changes since the last election in 1998 increasing the number of seats by 1. The Liberal Democrats lost overall control of the council to no overall control.

<span class="mw-page-title-main">2000 St Albans City and District Council election</span>

The 2000 St Albans City and District Council election took place on 4 May 2000 to elect members of St Albans District Council in Hertfordshire, England. One third of the council was up for election and the council stayed under no overall control.

<span class="mw-page-title-main">2002 St Albans City and District Council election</span>

The 2002 St Albans City and District Council election took place on 2 May 2002 to elect members of St Albans District Council in Hertfordshire, England. One third of the council was up for election and the council stayed under no overall control.

<span class="mw-page-title-main">2003 St Albans City and District Council election</span>

The 2003 St Albans City and District Council election took place on 1 May 2003 to elect members of St Albans District Council in Hertfordshire, England. One third of the council was up for election and the council stayed under no overall control.

<span class="mw-page-title-main">2004 St Albans City and District Council election</span>

The 2004 St Albans City and District Council election took place on 10 June 2004 to elect members of St Albans District Council in Hertfordshire, England. One third of the council was up for election and the council stayed under no overall control.

<span class="mw-page-title-main">2006 St Albans City and District Council election</span>

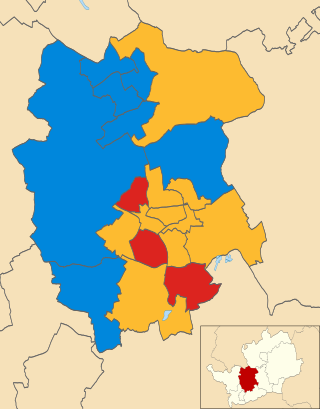
The 2006 St Albans City and District Council election took place on 4 May 2006 to elect members of St Albans District Council in Hertfordshire, England. One third of the council was up for election and the Liberal Democrats gained overall control of the council from no overall control.

<span class="mw-page-title-main">2007 St Albans City and District Council election</span>

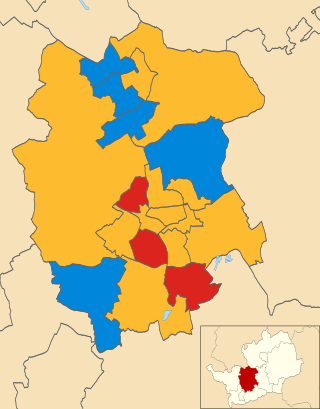
The 2007 St Albans City and District Council election took place on 3 May 2007 to elect members of St Albans District Council in Hertfordshire, England. One third of the council was up for election and the Liberal Democrats lost overall control of the council to no overall control.

<span class="mw-page-title-main">2010 St Albans City and District Council election</span>

The 2010 St Albans City and District Council election took place on 6 May 2010 to elect members of St Albans District Council in Hertfordshire, England. One third of the council was up for election and the Liberal Democrats stayed in overall control of the council.

<span class="mw-page-title-main">2012 St Albans City and District Council election</span>

The 2012 St Albans City and District Council election took place on 3 May 2012 to elect members of St Albans District Council in Hertfordshire, England. One third of the council was up for election and the council stayed under no overall control.

<span class="mw-page-title-main">2011 St Albans City and District Council election</span>

The 2011 St Albans City and District Council election took place on 5 May 2011 to elect members of St Albans District Council in Hertfordshire, England. One third of the council was up for election and the Liberal Democrats lost overall control of the council to no overall control.

<span class="mw-page-title-main">2014 St Albans City and District Council election</span>

The 2014 St Albans City and District Council election took place on 22 May 2014 to elect members of St Albans District Council in Hertfordshire, England. One third of the council was up for election and the council stayed under no overall control.

<span class="mw-page-title-main">2019 St Albans City and District Council election</span> Election

The 2019 St Albans City and District Council election took place on 2 May 2019 to elect members of St Albans City and District Council in England. This was on the same day as other local elections. At the elections, the Conservatives lost control of the council

<span class="mw-page-title-main">Daisy Cooper</span> Deputy leader of the Liberal Democrats

Daisy Cooper is a British Liberal Democrat politician who has served as the Member of Parliament (MP) for St Albans since 2019. She has served as the Deputy Leader of the Liberal Democrats since 2020, and as the Liberal Democrat spokesperson for Health, Wellbeing and Social Care since 2021.

<span class="mw-page-title-main">2021 St Albans City and District Council election</span> Election

The 2021 St Albans City and District Council election took place on 6 May 2021, delayed by one year due to the COVID-19 pandemic, to elect members of St Albans City and District Council in England. This was on the same day as other local elections. At the elections, the Liberal Democrats achieved a majority for the first time since 2011 and took the council back from no overall control.

<span class="mw-page-title-main">2022 St Albans City and District Council election</span>

The 2022 St Albans City and District Council election took place on 5 May 2022, to elect members of St Albans City and District Council in England. It was on the same day as other local elections.

<span class="mw-page-title-main">2023 St Albans City and District Council election</span>

The 2023 St Albans City and District Council election took place on 4 May 2023 to elect members of St Albans City and District Council in Hertfordshire, England. This was on the same day as other local elections across England.

References

  1. "Local Elections 5 May 2016". St Albans City and District Council. Retrieved 20 April 2016.