| |||||||||||||||||||||||||||||||||||||||||||||||||||||
20 out of 40 seats to Cheltenham Borough Council 20 seats needed for a majority | |||||||||||||||||||||||||||||||||||||||||||||||||||||
---|---|---|---|---|---|---|---|---|---|---|---|---|---|---|---|---|---|---|---|---|---|---|---|---|---|---|---|---|---|---|---|---|---|---|---|---|---|---|---|---|---|---|---|---|---|---|---|---|---|---|---|---|---|
| |||||||||||||||||||||||||||||||||||||||||||||||||||||
![]() Map showing the results of the 2016 Cheltenham Borough Council elections by ward. | |||||||||||||||||||||||||||||||||||||||||||||||||||||
|
The 2016 Cheltenham Borough Council election was held on 5 May 2016 to elect members of Cheltenham Borough Council in England. [1] [2] This was on the same day as other local elections. The result was a victory for the incumbent Liberal Democrat administration, which increased its overall majority.
Party | Previous council | New council | +/- | |
---|---|---|---|---|
Liberal Democrats | 25* | 29 | ![]() | |
Conservatives | 11 | 7 | ![]() | |
People Against Bureaucracy | 4 | 3 | ![]() | |
Independent | 0* | 1 | ![]() | |
Total | 40 | 40 |
Party | Seats | Gains | Losses | Net gain/loss | Seats % | Votes % | Votes | +/− | |
---|---|---|---|---|---|---|---|---|---|
Liberal Democrats | 15 | 4 | 0 | +4 | 75.0 | 45.5 | 14,579 | +3.0 | |
Conservative | 3 | 0 | 4 | -4 | 15.0 | 29.3 | 9,387 | -0.3 | |
PAB | 1 | 0 | 1 | -1 | 5.0 | 6.8 | 2,188 | +0.1 | |
Labour | 0 | 0 | 0 | 0 | 0 | 6.3 | 2,007 | +1.4 | |
Green | 0 | 0 | 0 | 0 | 0 | 6.2 | 1,999 | +2.7 | |
Independent | 1 | 1 | 0 | +1 | 5.0 | 3.3 | 1,052 | +1.4 | |
UKIP | 0 | 0 | 0 | 0 | 0 | 2.5 | 805 | -7.5 | |
TUSC | 0 | 0 | 0 | 0 | 0 | 0.1 | 21 | -0.3 |
Party | Candidate | Votes | % | ±% | |
---|---|---|---|---|---|
Liberal Democrats | Stephen Andrew Jordan* | 744 | 52.5 | +11.2 | |
Conservative | Martin Andrew Tracey | 406 | 28.6 | +0.1 | |
Labour | Diana Helen Hale | 164 | 11.6 | +2.9 | |
Green | Aina Catherine Wylie | 103 | 7.3 | -3.4 | |
Majority | 338 | 23.9 | +11.1 | ||
Turnout | 1,423 | 35 | ±0 | ||
Liberal Democrats hold | Swing | ||||
Party | Candidate | Votes | % | ±% | |
---|---|---|---|---|---|
Conservative | Louis Arthur Ives Savage* | 850 | 55.6 | +9.6 | |
Liberal Democrats | Michael Robert Hart | 444 | 29.0 | -12.9 | |
Labour | Helen Clare Pemberton | 137 | 9.0 | N/A | |
Green | Jon Paul Stubbings | 98 | 6.4 | N/A | |
Majority | 406 | 26.6 | +22.5 | ||
Turnout | 1,536 | 37 | -5 | ||
Conservative hold | Swing | ||||
Party | Candidate | Votes | % | ±% | |
---|---|---|---|---|---|
Liberal Democrats | Mike Collins | 906 | 49.6 | -17.1 | |
Conservative | Jacky Fletcher* | 764 | 41.8 | +8.5 | |
Green | Geoffrey Leslie Foster | 86 | 4.7 | N/A | |
Labour | Robin Frederick Carey | 72 | 3.9 | N/A | |
Majority | 142 | 7.8 | -25.6 | ||
Turnout | 1,837 | 46 | +1 | ||
Liberal Democrats gain from Conservative | Swing | ||||
Party | Candidate | Votes | % | ±% | |
---|---|---|---|---|---|
Liberal Democrats | Paul Gerard McCloskey | 945 | 49.2 | +3.9 | |
Conservative | Jenny Elizabeth Kirkwood | 721 | 37.6 | +6.4 | |
Green | Lorraine Elizabeth Mason | 133 | 7.0 | N/A | |
Labour | Lisa Michelle Belshaw | 120 | 6.2 | +0.4 | |
Majority | 224 | 11.6 | +2.5 | ||
Turnout | 1,925 | 45 | -2 | ||
Liberal Democrats hold | Swing | ||||
Party | Candidate | Votes | % | ±% | |
---|---|---|---|---|---|
Liberal Democrats | Steve Harvey | 1,010 | 51.4 | +5.5 | |
Conservative | Scott Robert Morris | 788 | 40.1 | -0.8 | |
Labour | Malcolm Bride | 106 | 5.4 | +2.9 | |
Green | Lennard Vincent Attard | 61 | 3.1 | +0.6 | |
Majority | 222 | 11.3 | +6.3 | ||
Turnout | 1,974 | 50 | +3 | ||
Liberal Democrats gain from Conservative | Swing | ||||
Party | Candidate | Votes | % | ±% | |
---|---|---|---|---|---|
Liberal Democrats | Klara Victoria Sudbury* | 1,063 | 63.0 | +10.5 | |
Conservative | Peter James Pritchard | 370 | 21.9 | -2.8 | |
Green | Sarah Jane Field | 101 | 6.0 | -7.2 | |
Labour | Joanna Susan Hughes | 85 | 5.0 | N/A | |
UKIP | Sue Jones | 69 | 4.1 | -5.5 | |
Majority | 693 | 41.1 | +13.3 | ||
Turnout | 1,689 | 40 | -1 | ||
Liberal Democrats hold | Swing | ||||
Party | Candidate | Votes | % | ±% | |
---|---|---|---|---|---|
Liberal Democrats | Wendy Louise Flynn* | 624 | 52.7 | +1.1 | |
Conservative | Shaun Stephen Bailey | 371 | 31.4 | +6.8 | |
Labour | Rod Gay | 107 | 9.0 | -5.6 | |
Green | Malcolm Albert John Allison | 60 | 5.1 | N/A | |
TUSC | Sam Coxson | 21 | 1.8 | -7.4 | |
Majority | 253 | 21.3 | -5.7 | ||
Turnout | 1,187 | 25 | ±0 | ||
Liberal Democrats hold | Swing | ||||
Party | Candidate | Votes | % | ±% | |
---|---|---|---|---|---|
Conservative | Diggory Charles Seacome* | 646 | 52.9 | +4.2 | |
Liberal Democrats | Mike Newby | 303 | 24.8 | -16.2 | |
Labour | Keith White | 141 | 11.5 | +1.2 | |
Green | Sophie Dominique Franklin | 131 | 10.7 | N/A | |
Majority | 343 | 28.1 | +20.4 | ||
Turnout | 1,230 | 30 | -3 | ||
Conservative hold | Swing | ||||
Party | Candidate | Votes | % | ±% | |
---|---|---|---|---|---|
Independent | Ian Bickerton | 821 | 40.1 | +17.0 | |
Conservative | Andrew William Chard* | 583 | 28.5 | -7.9 | |
Liberal Democrats | Iain Andrew Paterson Dobie | 409 | 20.0 | -2.6 | |
Green | Morgan Woodland | 99 | 4.8 | -3.4 | |
UKIP | Ian Charles Anthony Statham | 75 | 3.7 | -6.0 | |
Labour | Ian Hugh White | 62 | 3.0 | N/A | |
Majority | 238 | 11.6 | -1.7 | ||
Turnout | 2,053 | 48 | -5 | ||
Independent gain from Conservative | Swing | ||||
Party | Candidate | Votes | % | ±% | |
---|---|---|---|---|---|
Liberal Democrats | Rowena Mary Hay* | 576 | 47.3 | +1.8 | |
Conservative | Emma Nelson | 320 | 26.3 | +12.7 | |
Labour | Alec Gamble | 235 | 19.3 | +4.3 | |
Green | Roberta Lee Smart | 87 | 7.1 | N/A | |
Majority | 256 | 21.0 | +1.4 | ||
Turnout | 1,225 | 29 | ±0 | ||
Liberal Democrats hold | Swing | ||||
Party | Candidate | Votes | % | ±% | |
---|---|---|---|---|---|
Conservative | Tim Harman* | 991 | 46.9 | +4.4 | |
Liberal Democrats | Dilys Mary Juliet Barrell | 912 | 43.2 | -1.7 | |
Labour | Megan Alice England | 109 | 5.2 | +0.7 | |
Green | Anne Knight-Elliott | 101 | 4.8 | -3.3 | |
Majority | 79 | 3.7 | +1.3 | ||
Turnout | 2,120 | 45 | ±0 | ||
Conservative hold | Swing | ||||
Dennis Parsons was expelled from the Liberal Democrats on 17 June 2020 for using a racist slur at a council meeting the day before. He now sits as an Independent. [3]
Party | Candidate | Votes | % | ±% | |
---|---|---|---|---|---|
Liberal Democrats | Dennis Frank Parsons | 838 | 46.0 | +8.5 | |
PAB | Peter Sayers | 536 | 29.4 | -11.6 | |
Conservative | Barry Geoffrey Perks | 273 | 15.0 | -6.5 | |
Labour | Sandra Easton-Lawrence | 91 | 5.0 | N/A | |
Green | Ian Antony Lander | 84 | 4.6 | N/A | |
Majority | 302 | 16.6 | +13.1 | ||
Turnout | 1,826 | 41 | -1 | ||
Liberal Democrats gain from PAB | Swing | ||||
Party | Candidate | Votes | % | ±% | |
---|---|---|---|---|---|
PAB | Malcolm George Stennett* | 1,196 | 69.0 | -7.4 | |
Conservative | Alicia Wyer | 258 | 14.9 | -0.4 | |
Liberal Democrats | Lisa Patricia Carr | 202 | 11.6 | +3.3 | |
Green | Catherine Sarah Green | 78 | 4.5 | N/A | |
Majority | 938 | 54.1 | -7.0 | ||
Turnout | 1,737 | 40 | -5 | ||
PAB hold | Swing | ||||
Party | Candidate | Votes | % | ±% | |
---|---|---|---|---|---|
Liberal Democrats | Suzanne Theresa Williams* | 778 | 57.0 | +9.4 | |
Conservative | Gavin Lee Garthwaite | 285 | 20.8 | +6.1 | |
UKIP | Elizabeth Jane Roberts | 217 | 15.9 | -8.9 | |
Green | Dale Karl Campbell | 86 | 6.3 | N/A | |
Majority | 493 | 36.2 | +13.9 | ||
Turnout | 1,367 | 29 | +1 | ||
Liberal Democrats hold | Swing | ||||
Party | Candidate | Votes | % | ±% | |
---|---|---|---|---|---|
Liberal Democrats | Christopher Francis Coleman* | 896 | 62.9 | +19.3 | |
Conservative | Rosemary Rita Harvey | 172 | 12.1 | -3.4 | |
UKIP | Peter Bowman | 139 | 9.8 | -14.2 | |
Labour | Andre Ambrosius | 124 | 8.7 | +0.1 | |
Green | Demelza Jade Jones | 93 | 6.5 | -1.8 | |
Majority | 724 | 50.8 | +31.2 | ||
Turnout | 1,433 | 31 | -2 | ||
Liberal Democrats hold | Swing | ||||
Party | Candidate | Votes | % | ±% | |
---|---|---|---|---|---|
Liberal Democrats | Karl Nicholas Hobley | 322 | 36.6 | +6.4 | |
Independent | Daud McDonald | 231 | 26.3 | +13.2 | |
Labour | Clive Robert Harriss | 141 | 16.0 | +0.7 | |
Conservative | Ben Stone | 96 | 10.9 | -5.0 | |
Green | Jasmine Climpson Moreton | 90 | 10.2 | -1.6 | |
Majority | 91 | 13.3 | -1.0 | ||
Turnout | 888 | 21 | ±0 | ||
Liberal Democrats hold | Swing | ||||
Party | Candidate | Votes | % | ±% | |
---|---|---|---|---|---|
Liberal Democrats | David John Willingham | 669 | 46.5 | -0.6 | |
Conservative | John Vincent Hopwood | 376 | 26.1 | +8.9 | |
Green | Emily Catherine Campbell | 263 | 18.3 | N/A | |
Labour | Robert Ramuz Irons | 131 | 9.1 | -4.1 | |
Majority | 293 | 20.4 | -4.2 | ||
Turnout | 1,448 | 29 | ±0 | ||
Liberal Democrats hold | Swing | ||||
Party | Candidate | Votes | % | ±% | |
---|---|---|---|---|---|
Liberal Democrats | Bernie Fisher* | 607 | 45.3 | -21.0 | |
PAB | Stuart James Deakin | 456 | 34.0 | N/A | |
Conservative | Janet Diana Honeywill | 183 | 13.6 | -20.1 | |
Green | Adrian Becker | 95 | 7.1 | N/A | |
Majority | 151 | 11.3 | -21.3 | ||
Turnout | 1,352 | 31 | +1 | ||
Liberal Democrats hold | Swing | ||||
Party | Candidate | Votes | % | ±% | |
---|---|---|---|---|---|
Liberal Democrats | Roger Lee Whyborn* | 1,163 | 64.5 | +14.1 | |
Conservative | Marcus Annfield | 370 | 20.5 | -8.1 | |
UKIP | Peter William Joiner | 138 | 7.7 | -7.8 | |
Labour | Christine Mary England | 68 | 3.8 | -1.7 | |
Green | Adam Paul Van Coevorden | 64 | 3.5 | N/A | |
Majority | 793 | 44.0 | +22.2 | ||
Turnout | 1,809 | 43 | -4 | ||
Liberal Democrats hold | Swing | ||||
Party | Candidate | Votes | % | ±% | |
---|---|---|---|---|---|
Liberal Democrats | Tony Oliver | 825 | 47.0 | +11.6 | |
Conservative | Neil Killian Jones | 564 | 32.1 | -7.2 | |
UKIP | Ann Homer | 167 | 9.5 | -8.4 | |
Labour | Joseph David Sucksmith | 114 | 6.5 | N/A | |
Green | Tim Bonsor | 86 | 4.9 | -2.4 | |
Majority | 261 | 14.9 | +11.0 | ||
Turnout | 1,762 | 41 | -2 | ||
Liberal Democrats gain from Conservative | Swing | ||||
Cheltenham is a constituency in Gloucestershire represented in the House of Commons of the UK Parliament since 1832. As with all constituencies, it elects one Member of Parliament (MP) by the first past the post system of election at least every five years. Since 2015, its MP has been Alex Chalk, who was appointed Secretary of State for Justice in 2023.
Martin Charles Horwood is a British Liberal Democrat politician who represented South West England in the European Parliament from 2019 to 2020. He previously served as the Member of Parliament for Cheltenham from 2005 to 2015.
The 2010 Cheltenham Council election took place on 6 May 2010 to elect members of Cheltenham Borough Council in Gloucestershire, England. Half of the council was up for election and the Liberal Democrats stayed in overall control of the council.
The 2011 United Kingdom local elections was held on Thursday May 5. In England, direct elections were held in all 36 Metropolitan boroughs, 194 Second-tier district authorities, 49 unitary authorities and various mayoral posts, meaning local elections took place in all parts of England with the exception of seven unitary authorities, and seven districts and boroughs. For the majority of English districts and the 25 unitary authorities that are elected "all out" these were the first elections since 2007. In Northern Ireland, there were elections to all 26 local councils. Elections also took place to most English parish councils.
The 1998 Cheltenham Council election took place on 7 May 1998 to elect members of Cheltenham Borough Council in Gloucestershire, England. One third of the council was up for election and the Liberal Democrats stayed in overall control of the council.
The 1999 Cheltenham Council election took place on 6 May 1999 to elect members of Cheltenham Borough Council in Gloucestershire, England. One third of the council was up for election and the Liberal Democrats lost overall control of the council to no overall control.
The 2000 Cheltenham Council election took place on 4 May 2000 to elect members of Cheltenham Borough Council in Gloucestershire, England. One third of the council was up for election and the Conservative Party stayed in overall control of the council.
The 2002 Cheltenham Council election took place on 2 May 2002 to elect members of Cheltenham Borough Council in Gloucestershire, England. The whole council was up for election with boundary changes since the last election in 2000 reducing the number of seats by 1. The Liberal Democrats gained overall control of the council from the Conservative Party.
The 2004 Cheltenham Council election took place on 10 June 2004 to elect members of Cheltenham Borough Council in Gloucestershire, England. Half of the council was up for election and the Liberal Democrats lost overall control of the council to no overall control.
The 2006 Cheltenham Council election took place on 4 May 2006 to elect members of Cheltenham Borough Council in Gloucestershire, England. Half of the council was up for election and the council stayed under no overall control.
The 2008 Cheltenham Council election took place on 1 May 2008 to elect members of Cheltenham Borough Council in Gloucestershire, England. Half of the council was up for election and the council stayed under no overall control.
The 2014 United Kingdom local elections were held on 22 May 2014. Usually these elections are held on the first Thursday in May but were postponed to coincide with the 2014 European Parliament Elections. Direct elections were held for all 32 London boroughs, all 36 metropolitan boroughs, 74 district/borough councils, 19 unitary authorities and various mayoral posts in England and elections to the new councils in Northern Ireland.
The 2014 Cheltenham Borough Council election took place on 22 May 2014 to elect members of Cheltenham Borough Council in England. This was on the same day as other local elections.
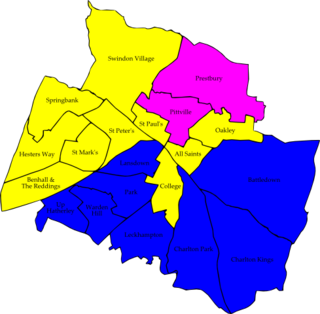
Cheltenham Borough Council is the local authority for Cheltenham, which is split into 20 wards, with a total of 40 councillors elected to serve on the borough council. Since 2002, elections have been held every two years with half of the councillors elected at each election. Following the last election in 2022, there were 31 Liberal Democrat members, 6 Conservatives, 2 representing the People Against Bureaucracy group, and 1 from the Green Party, a historical first. On 5 June 2022, Liberal Democrat councillor Wendy Flynn defected to the Green Party. In September 2022, the mayor, councillor Sandra Holliday, was suspended from the Liberal Democrats for 12 months for bullying. She remains in post but non aligned.
The 1990 Hammersmith and Fulham Council election took place on 3 May 1990 to elect members of Hammersmith and Fulham London Borough Council in London, England. The whole council was up for election and the Labour party stayed in overall control of the council.
Elections for the London Borough of Merton were held on 3 May 1990 to elect members of Merton London Borough Council in London, England. This was on the same day as other local elections in England and Scotland.
Elections for the London Borough of Merton were held on 5 May 1994 to elect members of Merton London Borough Council in London, England. This was on the same day as other local elections in England.
Tewkesbury is a local government district and borough in Gloucestershire, England. Named after its main town, Tewkesbury, the borough had a population of 85,800 in 2015. Other places in the borough include Ashchurch, Bishop's Cleeve, Churchdown and Winchcombe. It is administratively distinct from the parish of Tewkesbury, which is served by Tewkesbury Town Council.
The 2018 Watford Borough Council election took place on 3 May 2018 to elect members of Watford Borough Council in England. This was the same day as other local elections.
The 2019 Wirral Metropolitan Borough Council election took place on 2 May 2019 to elect members of Wirral Metropolitan Borough Council in England. This election was held on the same day as other local elections.