2019 Cotswold District Council election

Last updated

2019 Cotswold District Council election
Severn Cross.svg
  2015 2 May 2019 (2019-05-02) 2023  

All 34 seats to Cotswold District Council
18 seats needed for a majority
 First partySecond party
  No image wide.svg No image wide.svg
Party Liberal Democrats Conservative
Last election10 seats, 33.4%24 seats, 54.8%
Seats won1814
Seat changeIncrease2.svg 8Decrease2.svg 10
Popular vote12,25510,727
Percentage44.5%38.9%
SwingIncrease2.svg 11.1%Decrease2.svg 15.9%

 Third partyFourth party
  No image wide.svg No image wide.svg
Party Independent Green
Last election0 seats, 1.3%0 seats, 2.7%
Seats won11
Seat changeIncrease2.svg 1Increase2.svg 1
Popular vote1,5701,370
Percentage5.7%5.0%
SwingIncrease2.svg 4.4%Increase2.svg 2.3%

Cotswold District Council election 2019 map.svg
Map of results of 2019 election, with Cirencester shown inset.

Leader of the council before election

Tony Berry
Conservative

Leader of the council after election

Joe Harris
Liberal Democrats

The 2019 Cotswold District Council election took place on 2 May 2019 to elect all members of Cotswold District Council, as part of the United Kingdom local elections. The Conservatives had controlled the council since 2003 but lost ten seats. The Liberal Democrats won overall control of the council for the first time since the council's creation in 1974. The Green Party also won their first seat on the council since the council's creation.

Contents

The Tetbury Town ward was decided by one vote. The returning officer reportedly decided the seat by allocating a doubtful ballot paper that had the word "BREXIT" written across it with an arrow pointing to the Conservative candidate, Stephen Hirst, in favour of Hirst. The hitherto tied candidate, Independent David Painter, described it as a "travesty of justice" and said "no wonder people are turned off voting". Painter sought to raise £2,500 to begin a legal challenge against the returning officer's decision. [1] The council maintained that the returning officer's decision was in line with guidance from the Electoral Commission. [2]

Summary

Election result

2019 Cotswold District Council election
PartyCandidatesSeatsGainsLossesNet gain/lossSeats %Votes %Votes+/−
  Liberal Democrats 291880Increase2.svg 852.944.512,255Increase2.svg 11.1
  Conservative 3414010Decrease2.svg 1041.238.910,727Decrease2.svg 15.9
  Independent 6110Increase2.svg 12.95.71,570Increase2.svg 4.4
  Green 5110Increase2.svg 12.95.01,370Increase2.svg 2.3
  Labour 11000Steady2.svg0.03.1857Decrease2.svg 0.2
  UKIP 4000Steady2.svg0.02.9793Decrease2.svg 1.7

Ward results

Abbey Ward

Cirencester Abbey Ward
PartyCandidateVotes%±%
Liberal Democrats Mark Harris* 573 75.2 +22.0
Conservative Rebecca Senior12716.7-20.4
Labour Alan Mackenzie628.1N/A
Majority44658.5
Turnout 40.4
Liberal Democrats hold Swing

Blockley Ward

Blockley Ward
PartyCandidateVotes%±%
Conservative Sue Jepson* 394 56.2 -5.9
Liberal Democrats Bella McMillan-Scott17925.5-12.4
Green Clare Turner12818.3N/A
Majority21530.7
Turnout 34.2
Conservative hold Swing

Bourton Vale Ward

Bourton Vale Ward
PartyCandidateVotes%±%
Conservative Richard Keeling* 494 64.4 -8.1
Liberal Democrats Malcolm Lilley27335.6+8.1
Majority22128.8
Turnout 35.7
Conservative hold Swing

Bourton Village Ward

Bourton Village Ward
PartyCandidateVotes%±%
Liberal Democrats Nick Maunder 470 55.0 +5.8
Conservative Len Wilkins*38545.0-5.8
Majority8510.0
Turnout 35.2
Liberal Democrats gain from Conservative Swing

Campden and Vale Ward

Campden and Vale Ward (2 seats)
PartyCandidateVotes%±%
Conservative Gina Blomefield 888 49.2 -5.1
Conservative Mark Annett* 829 46.0 -11.7
UKIP Rob McNeil-Wilson62334.5+17.3
Liberal Democrats Marcus Efstratiou52128.9+7.4
Majority206
Turnout 37.7
Conservative hold Swing

Chedworth and Churn Valley Ward

Chedworth and Churn Valley Ward
PartyCandidateVotes%±%
Liberal Democrats Jenny Forde* 586 57.6 +7.5
Independent David Broad20119.7-30.2
Conservative Stephen Senior18017.7-32.2
UKIP Christopher Harlow525.1N/A
Majority38537.9
Turnout 51.4
Liberal Democrats hold Swing

Chesterton Ward

Cirencester Chesterton Ward
PartyCandidateVotes%±%
Liberal Democrats Roly Hughes* 538 85.5 +39.6
Conservative Diana Mackenzie-Charrington9114.5-17.1
Majority44771.0
Turnout 34.1
Liberal Democrats hold Swing

Coln Valley Ward

Coln Valley Ward
PartyCandidateVotes%±%
Conservative Ray Theodoulou* 459 58.7 -10.1
Liberal Democrats Joanna Walker18623.8+5.0
Green Michael Poole13717.5+5.2
Majority27334.9
Turnout 39.7
Conservative hold Swing

Ermin Ward

Ermin Ward
PartyCandidateVotes%±%
Conservative Julia Judd 464 57.9 -0.2
Liberal Democrats Ed Smith33842.1+9.3
Majority12615.8
Turnout 39.9
Conservative hold Swing

Fairford North Ward

Following the 2017 by-election, this ward was held by the Liberal Democrats. [3]

Fairford North Ward
PartyCandidateVotes%±%
Liberal Democrats Andrew Doherty* 493 69.2 +41.4
Conservative Rob Stead21930.8-20.3
Majority27438.4
Turnout 36.4
Liberal Democrats hold Swing

Fosseridge Ward

Fosseridge Ward
PartyCandidateVotes%±%
Conservative Julian Beale* 620 68.7 -2.9
Liberal Democrats Dominique Simpson28231.3+17.0
Majority33837.4
Turnout 42.9
Conservative hold Swing

Four Acres Ward

Cirencester Four Acres Ward
PartyCandidateVotes%±%
Liberal Democrats Ray Brassington* 407 69.6 +17.1
Conservative Edward Horsfall14023.9-10.5
Labour Richard Guilding386.5N/A
Majority26745.7
Turnout 38.3
Liberal Democrats hold Swing

Grumbolds Ash with Avening Ward

Grumbolds Ash with Avening Ward
PartyCandidateVotes%±%
Conservative Richard Morgan* 460 61.3 -10.2
Liberal Democrats Nicky Baber17222.9-5.6
Labour Ed Shelton11815.7N/A
Majority28838.4
Turnout 37.2
Conservative hold Swing

Kemble Ward

Kemble Ward
PartyCandidateVotes%±%
Conservative Tony Berry* 538 57.9 -4.3
Green Sabrina Poole26228.2N/A
Labour Sian Smith687.3N/A
UKIP John Fleming616.6-3.6
Majority27629.7
Turnout 44.2
Conservative hold Swing

Lechlade, Kempsford and Fairford South Ward

Lechlade, Kempsford and Fairford South Ward (2 seats)
PartyCandidateVotes%±%
Conservative Stephen Andrews* 829 52.0 +2.2
Conservative Steve Trotter 826 51.8 -5.2
Liberal Democrats Kara Wise48330.3+10.2
Green Xanthe Messenger46829.4N/A
Labour Trevor Smith23514.7+1.3
Majority343
Turnout 33.6
Conservative hold Swing

Moreton East Ward

Moreton East Ward
PartyCandidateVotes%±%
Liberal Democrats Rachel Coxcoon 585 62.8 +48.3
Conservative David Cunningham31433.7-33.6
Labour Simon Cohen333.5-14.7
Majority27129.1
Turnout 41.8
Liberal Democrats gain from Conservative Swing

Moreton West Ward

Moreton West Ward
PartyCandidateVotes%±%
Liberal Democrats Clive Webster 468 55.2 +32.1
Conservative Alison Coggins*38044.8-32.1
Majority8810.4
Turnout 44.1
Liberal Democrats gain from Conservative Swing

New Mills Ward

Cirencester New Mills Ward
PartyCandidateVotes%±%
Liberal Democrats Claire Bloomer 353 75.9 +20.3
Conservative Frederick Hart11224.1-20.3
Majority24151.8
Turnout 25.3
Liberal Democrats hold Swing

Northleach Ward

Northleach Ward
PartyCandidateVotes%±%
Liberal Democrats Tony Dale 557 62.2 +27.1
Conservative Jolyon Grey33837.8-19.8
Majority21924.4
Turnout 41.2
Liberal Democrats gain from Conservative Swing

Sandywell Ward

Sandywell Ward
PartyCandidateVotes%±%
Conservative Robin Hughes* 536 67.0 -3.6
Liberal Democrats Harry Chalklin19924.9-4.5
Labour Ian Pillinger658.1N/A
Majority33742.1
Turnout 38.5
Conservative hold Swing

Siddington and Cerney Rural Ward

Siddington and Cerney Rural Ward
PartyCandidateVotes%±%
Liberal Democrats Mike Evemy 565 71.4 +22.9
Conservative Richard Davies22628.6-22.9
Majority33942.8
Turnout 38.1
Liberal Democrats gain from Conservative Swing

South Cerney Village Ward

South Cerney Village
PartyCandidateVotes%±%
Liberal Democrats Juliet Layton* 565 83.7 +35.1
Conservative Margaret Saunders11016.3-13.5
Majority45567.4
Turnout 33.0
Liberal Democrats hold Swing

St Michael's Ward

Cirencester St Michael's Ward
PartyCandidateVotes%±%
Liberal Democrats Joe Harris* 554 73.0 +22.9
Conservative Harry Coutts14719.4-12.4
Labour Terence Pomroy587.6N/A
Majority40753.6
Turnout 41.1
Liberal Democrats hold Swing

Stow Ward

Stow Ward
PartyCandidateVotes%±%
Liberal Democrats Dilys Neill* 577 65.3 +21.4
Conservative Tom Bradley30734.7-21.4
Majority27030.6
Turnout 42.7
Liberal Democrats gain from Conservative Swing

Stratton Ward

Cirencester Stratton Ward
PartyCandidateVotes%±%
Liberal Democrats Patrick Coleman* 497 57.1 +5.2
Independent Phillip Coleman22325.6N/A
Conservative Malcolm Gilmore11513.2-24.9
Labour Gunther Strait354.0N/A
Majority27431.5
Turnout 42.8
Liberal Democrats hold Swing

Tetbury East and Rural Ward

Tetbury East and Rural Ward
PartyCandidateVotes%±%
Independent Nikki Ind 603 73.5 N/A
Conservative Maggie Heaven*21726.5-47.0
Majority38647.0
Turnout
Independent gain from Conservative Swing

Tetbury Town Ward

Tetbury Town Ward
PartyCandidateVotes%±%
Conservative Stephen Hirst* 232 40.3 -6.8
Independent Kevin Painter23140.2+15.5
Liberal Democrats Rebecca Halifax11219.5+11.2
Majority10.1
Turnout 33.6
Conservative hold Swing

Tetbury with Upton Ward

Tetbury with Upton Ward
PartyCandidateVotes%±%
Conservative Richard Norris 334 48.0 -13.5
Independent Georgina Osman22332.0N/A
Labour Jon Easterbrook7610.9-9.0
Liberal Democrats Nigel Bass639.1-9.5
Majority11116.0
Turnout 42.0
Conservative hold Swing

The Ampneys and Hampton Ward

The Ampneys and Hampton Ward
PartyCandidateVotes%±%
Liberal Democrats Lisa Spivey 727 58.5 +21.5
Conservative David Fowles*51641.5-21.5
Majority21117.0
Turnout 57.0
Liberal Democrats gain from Conservative Swing

The Beeches Ward

Cirencester Beeches
PartyCandidateVotes%±%
Liberal Democrats Nigel Robbins* 526 79.6 +40.1
Conservative Robin McCorkell13520.4-15.1
Majority39159.2
Turnout 30.1
Liberal Democrats hold Swing

The Rissingtons Ward

The Rissingtons Ward
PartyCandidateVotes%±%
Green Andrew Maclean 375 52.6 +31.9
Conservative Mark Mackenzie-Charrington*33847.4-19.0
Majority375.2
Turnout 36.8
Green gain from Conservative Swing

Watermoor Ward

Cirencester Watermoor
PartyCandidateVotes%±%
Liberal Democrats Gary Selwyn 406 57.8 +9.1
Independent Jenny Hincks*8912.7-36.0
Conservative Christopher Daniels8211.7-21.3
Labour Will Downes-Hall699.8N/A
UKIP Pete Elliot578.1-10.1
Majority31745.1
Turnout 33.9
Liberal Democrats hold Swing

By-elections

Fosseridge

Fosseridge, 6 May 2021
PartyCandidateVotes%±%
Conservative David Cunningham 641 63.7 -5.0
Liberal Democrats Dominique Simpson25125.0-6.3
Green Clare Turner11411.3N/A
Majority39038.7
Turnout 1,00947.09
Conservative hold Swing

Campden and Vale

Campden and Vale, 3 February 2022
PartyCandidateVotes%±%
Conservative Tom Stowe 1,180 56.2 +10.2
Liberal Democrats Danny Loveridge92043.8+14.9
Majority26012.4
Turnout 2,10042.35
Conservative hold Swing

Related Research Articles

<span class="mw-page-title-main">Berwickshire, Roxburgh and Selkirk (UK Parliament constituency)</span> Parliamentary constituency in the United Kingdom, 2005 onwards

Berwickshire, Roxburgh and Selkirk is a constituency of the British House of Commons, located in the south of Scotland within the Scottish Borders council area. It elects one Member of Parliament (MP) at least once every five years using the first-past-the-post system of voting. Since 2017 the MP has been John Lamont of the Conservative Party.

<span class="mw-page-title-main">Wimbledon (UK Parliament constituency)</span> Parliamentary constituency in the United Kingdom, 1885 onwards

Wimbledon is a constituency in Greater London represented in the House of Commons of the UK Parliament. Since 2005, the seat has been held by Stephen Hammond of the Conservative Party.
<span class="mw-page-title-main">South East Cambridgeshire (UK Parliament constituency)</span> Parliamentary constituency in the United Kingdom, 1983 onwards

South East Cambridgeshire is a constituency represented in the House of Commons of the UK Parliament since 2015 by Lucy Frazer, a member of the Conservative Party who has served as the Culture Secretary since 2023. It was established for the 1983 general election. The constituency has always been based on the cathedral city of Ely.
<span class="mw-page-title-main">Sutton and Cheam (UK Parliament constituency)</span> Parliamentary constituency in the United Kingdom, 1945 onwards

Sutton and Cheam is a constituency in Greater London represented in the House of Commons of the UK Parliament since 2015 by Paul Scully, a Conservative.

<span class="mw-page-title-main">Surrey Heath (UK Parliament constituency)</span> Parliamentary constituency in the UK

Surrey Heath is a constituency represented in the House of Commons of the UK Parliament since 2005 by Michael Gove, a Conservative who has also been the Secretary of State for Levelling Up, Housing and Communities since October 2022. The Home counties suburban constituency is in the London commuter belt, on the outskirts of Greater London. Surrey Heath is in the north west of Surrey and borders the counties of Berkshire and Hampshire.

<span class="mw-page-title-main">Winchester (UK Parliament constituency)</span> Parliamentary constituency in the United Kingdom, 1885 onwards

Winchester is a constituency in Hampshire represented in the House of Commons of the UK Parliament since 2010 by Steve Brine, a Conservative.

<span class="mw-page-title-main">Chesham and Amersham (UK Parliament constituency)</span> Parliamentary constituency in the United Kingdom, 1974 onwards

Chesham and Amersham is a parliamentary constituency in Buckinghamshire, South East England, represented in the House of Commons by Sarah Green, a Liberal Democrat elected at a 2021 by-election.

<span class="mw-page-title-main">Crawley (UK Parliament constituency)</span> UK Parliament constituency since 1983

Crawley is a constituency in West Sussex represented in the House of Commons of the UK Parliament since 2010 by Henry Smith of the Conservative Party.

<span class="mw-page-title-main">Aberconwy (UK Parliament constituency)</span> Parliamentary constituency in the United Kingdom, 2010 onwards

Aberconwy is a constituency represented in the House of Commons of the UK Parliament since 2019 by Robin Millar, a Conservative.

Elections to the Borough Council in Slough, England, were held on 3 May 2007. One third of the council was up for election. This was the 122nd Slough general local authority election since Slough became a local government unit in 1863.

The region of South West England has, since the 2010 general election, 55 parliamentary constituencies which is made up of 15 borough constituencies and 40 county constituencies. At that election the Conservative Party held the largest number of constituencies, with 36. The Liberal Democrats had 15 and Labour had 4. At the 2015 general election the Liberal Democrats lost all of their seats, while the Conservatives gained one seat from Labour, leaving the Conservatives with 51 and Labour with 4. In the 2017 general election, the Conservatives remained, by far, the largest party with 47 seats, though losing three to Labour, who won 7, and one to the Liberal Democrats, who won 1. In the 2019 general election, the Conservatives increased their number of seats to 48 by regaining Stroud from Labour, who held their other six seats, while the Liberal Democrats retained their sole seat in Bath.
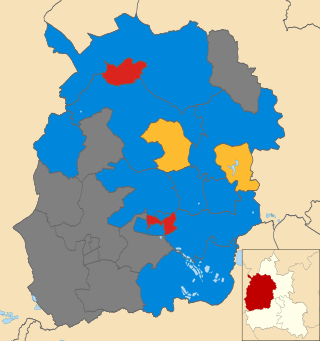
<span class="mw-page-title-main">2012 West Oxfordshire District Council election</span>

The 2012 West Oxfordshire District Council election took place on 3 May 2012 to elect members of West Oxfordshire District Council in Oxfordshire, England. One third of the council was up for election and the Conservative Party stayed in overall control of the council.

<span class="mw-page-title-main">2014 West Oxfordshire District Council election</span>

The 2014 West Oxfordshire District Council election took place on 22 May 2014 to elect members of West Oxfordshire District Council in Oxfordshire, England. One third of the council was up for election and the Conservative Party stayed in overall control of the council.

Elections to Mid Bedfordshire District Council were held in May 2007. These were the last elections to council, with all 53 seats being up for election. Councillors elected would serve a two-year term, expiring in 2009, when Mid Bedfordshire District Council was replaced by Central Bedfordshire Council. The Conservative Party retained overall control of the council, winning 37 of 53 seats on the council. The Conservatives won 8 seats unopposed, as did an Independent candidate in one ward.

<span class="mw-page-title-main">2018 South Cambridgeshire District Council election</span>

Elections to South Cambridgeshire District Council were held on Thursday 3 May 2018 as part of the 2018 United Kingdom local elections. Forty five seats, making up the whole of South Cambridgeshire District Council, were up for election in twenty six wards. The council previously had 57 members, last elected by thirds in 2016, 2015 and 2014. Following a boundary review, there has been a reduction of twelve seats to 45 and the electoral pattern has changed from election by thirds to all out elections, meaning that all seats were up for election on this occasion.

<span class="mw-page-title-main">2019 United Kingdom local elections</span> Elections to local councils and mayoralties

The 2019 United Kingdom local elections took place on Thursday 2 May 2019, with 248 English local councils, six directly elected mayors in England, and all 11 local councils in Northern Ireland being contested.

2019 Sunderland City Council election

The 2019 Sunderland City Council election took place on 2 May 2019 to elect members of Sunderland City Council in England. The election took place on the same day as other local elections.

<span class="mw-page-title-main">2022 Aberdeenshire Council election</span> Aberdeenshire Council election

Elections to Aberdeenshire Council took place on Thursday 5 May 2022 on the same day as the 31 other Scottish local government elections. As with other Scottish council elections, it was held using single transferable vote (STV) – a form of proportional representation – in which multiple candidates are elected in each ward and voters rank candidates in order of preference.

References

  1. Private Eye, Issue 1496, p.15
  2. Boobyer, Leigh (3 May 2019). "Ballot paper with 'Brexit' and an arrow written across it accepted as deciding vote in controversial Cotswolds local election". Gloucestershire Live. Retrieved 26 August 2023.
  3. Cotswold District Council (20 July 2023). "DECLARATION OF RESULT OF POLL Election of a District Councillor for Fairford North on Thursday 9 February 2017" (PDF). cotswold.gov.uk. Archived from the original (PDF) on 20 July 2023. Retrieved 20 July 2023.