| |||||||||||||||||||||||||||||||||||||||||||||||||||||
20 out of 40 seats to Cheltenham Borough Council 20 seats needed for a majority | |||||||||||||||||||||||||||||||||||||||||||||||||||||
---|---|---|---|---|---|---|---|---|---|---|---|---|---|---|---|---|---|---|---|---|---|---|---|---|---|---|---|---|---|---|---|---|---|---|---|---|---|---|---|---|---|---|---|---|---|---|---|---|---|---|---|---|---|
| |||||||||||||||||||||||||||||||||||||||||||||||||||||
Map showing the results of the 2021 Cheltenham Borough Council elections by ward. Yellow shows the Liberal Democrats, blue shows the Conservatives and black People Against Bureaucracy. | |||||||||||||||||||||||||||||||||||||||||||||||||||||
|
The 2021 Cheltenham Borough Council elections took place on 6 May 2021 to elect members of Cheltenham Borough Council in Gloucestershire, England. Half of the council was up for election, and the Liberal Democrats remained in overall control of the council. [1] [2]
These seats were due to be contested in 2020, but were delayed by one year due to the COVID-19 pandemic.
2021 Cheltenham Borough Council election | ||||||||||
---|---|---|---|---|---|---|---|---|---|---|
Party | This election | Full council | This election | |||||||
Seats | Net | Seats % | Other | Total | Total % | Votes | Votes % | +/− | ||
Liberal Democrats | 14 | 1 | 75.0 | 16 | 31 | 75.0 | 16,241 | 42.6 | -2.9 | |
Conservative | 5 | 1 | 20.0 | 3 | 7 | 20.0 | 14,312 | 37.5 | +8.2 | |
PAB | 1 | 1 | 5.0 | 1 | 2 | 5.0 | 1,307 | 3.4 | -3.4 | |
Green | 0 | 0.0 | 0 | 0 | 0.0 | 4,178 | 11.0 | +4.8 | ||
Labour | 0 | 0.0 | 0 | 0 | 0.0 | 2,068 | 5.4 | -0.9 | ||
TUSC | 0 | 0.0 | 0 | 0 | 0.0 | 26 | 0.1 | ±0.0 |
Before the election, the composition of the council was:
32 | 6 | 2 |
Liberal Democrats | Conservative | PAB |
After the election, the composition of the council was:
31 | 7 | 2 |
Liberal Democrats | Conservative | PAB |
PAB - People Against Bureaucracy
Incumbent councillors are denoted by an asterisk (*)
Party | Candidate | Votes | % | ±% | |
---|---|---|---|---|---|
Liberal Democrats | Barbara Ann Clark | 798 | 46.8 | -0.3 | |
Conservative | Susan Mary Godwin | 508 | 29.8 | -6.7 | |
Green | Jessica West | 271 | 15.9 | +9.2 | |
Labour | Isobel Amy Laing | 129 | 7.6 | -2.1 | |
Majority | 290 | 17.0 | |||
Turnout | 1,706 | 40 | +6 | ||
Liberal Democrats hold | Swing | ||||
Party | Candidate | Votes | % | ±% | |
---|---|---|---|---|---|
Conservative | Louis Arthur Ives Savage* | 1,005 | 46.3 | -11.9 | |
Liberal Democrats | Helen Clare Pemberton | 850 | 39.1 | +9.0 | |
Green | Daniel Joseph Willey | 185 | 8.5 | +3.3 | |
Labour | Caroline Adele Gavin | 132 | 6.1 | -0.4 | |
Majority | 155 | 7.2 | |||
Turnout | 2,172 | 46 | +8 | ||
Conservative hold | Swing | ||||
Party | Candidate | Votes | % | ±% | |
---|---|---|---|---|---|
Liberal Democrats | Mike Collins* | 1,048 | 51.6 | -3.7 | |
Conservative | Jonathan Edward Beeston | 768 | 37.8 | -2.0 | |
Green | Sarah Jane Field | 153 | 7.5 | N/A | |
Labour | Robin Frederick Carey | 62 | 3.1 | -1.8 | |
Majority | 280 | 13.8 | |||
Turnout | 2,031 | 51 | +4 | ||
Liberal Democrats hold | Swing | ||||
Party | Candidate | Votes | % | ±% | |
---|---|---|---|---|---|
Liberal Democrats | Paul Gerard McCloskey* | 1,016 | 46.4 | -1.4 | |
Conservative | Jake Wilson | 852 | 38.9 | -0.1 | |
Green | Lorraine Elizabeth Mason | 229 | 10.5 | +5.2 | |
Labour | Elle Harriet Rees | 91 | 4.2 | -3.6 | |
Majority | 164 | 7.5 | |||
Turnout | 2,188 | 50 | +6 | ||
Liberal Democrats hold | Swing | ||||
Party | Candidate | Votes | % | ±% | |
---|---|---|---|---|---|
Liberal Democrats | Steve Harvey* | 1,092 | 46.8 | -2.4 | |
Conservative | Phil Davis | 1,003 | 43.0 | -2.1 | |
Green | Sharon Lorna Wallington | 162 | 6.9 | +3.7 | |
Labour | Sarah Jane Chacko | 75 | 3.2 | +0.7 | |
Majority | 89 | 3.8 | |||
Turnout | 2,332 | 58 | +5 | ||
Liberal Democrats hold | Swing | ||||
Party | Candidate | Votes | % | ±% | |
---|---|---|---|---|---|
Liberal Democrats | William Guy Rosewarne Maughfling | 1,027 | 51.0 | -6.7 | |
Conservative | Rich Newman | 563 | 27.9 | +1.4 | |
Green | Elizabeth Johnson | 307 | 15.2 | +9.0 | |
Labour | Robert George Arnott | 118 | 5.9 | -2.7 | |
Majority | 464 | 23.1 | |||
Turnout | 2,015 | 46 | +8 | ||
Liberal Democrats hold | Swing | ||||
Party | Candidate | Votes | % | ±% | |
---|---|---|---|---|---|
Liberal Democrats | Wendy Louise Flynn* | 619 | 45.4 | -9.7 | |
Conservative | Laura Elizabeth Haley | 515 | 37.8 | +6.1 | |
Green | Adrian Becker | 118 | 8.7 | N/A | |
Labour | John Malcolm Bride | 105 | 7.7 | -5.5 | |
TUSC | Samuel Jacob Coxson | 7 | 0.5 | N/A | |
Majority | 104 | 7.6 | |||
Turnout | 1,364 | 28 | +4 | ||
Liberal Democrats hold | Swing | ||||
Party | Candidate | Votes | % | ±% | |
---|---|---|---|---|---|
Conservative | Diggory Charles Seacome* | 795 | 45.1 | -7.8 | |
Liberal Democrats | Paul Wheat | 627 | 35.6 | +5.8 | |
Green | Stephen Paul Bell | 239 | 13.6 | +7.2 | |
Labour | Duncan James Siret | 100 | 5.7 | -5.2 | |
Majority | 168 | 9.5 | |||
Turnout | 1,761 | 42 | +9 | ||
Conservative hold | Swing | ||||
Party | Candidate | Votes | % | ±% | |
---|---|---|---|---|---|
Conservative | Margaret Emma Frances Nelson | 1,132 | 43.9 | -2.7 | |
Liberal Democrats | Glenn Andrews | 853 | 33.1 | -3.3 | |
Green | Peter Robert Frings | 592 | 23.0 | +9.8 | |
Majority | 279 | 10.8 | |||
Turnout | 2,577 | 59 | +7 | ||
Conservative hold | Swing | ||||
Party | Candidate | Votes | % | ±% | |
---|---|---|---|---|---|
Liberal Democrats | Rowena Mary Hay* | 597 | 48.1 | -6.1 | |
Conservative | Jake Michael Andrew Hardy | 414 | 33.4 | +10.0 | |
Labour | Mike Jarvis | 122 | 9.8 | -13.6 | |
Green | Stephen West | 107 | 8.6 | N/A | |
Majority | 183 | 14.7 | |||
Turnout | 1,240 | 29 | -4 | ||
Liberal Democrats hold | Swing | ||||
Party | Candidate | Votes | % | ±% | |
---|---|---|---|---|---|
Conservative | Tim Harman* | 1,292 | 49.6 | +4.2 | |
Liberal Democrats | Izaac Augustus Tailford | 983 | 37.7 | -9.9 | |
Green | Catherine Sunita Lyon Leggett | 217 | 8.3 | +5.1 | |
Labour | Kevin Michael Boyle | 112 | 4.3 | +0.5 | |
Majority | 309 | 11.9 | |||
Turnout | 2,604 | 53 | +3 | ||
Conservative hold | Swing | ||||
Party | Candidate | Votes | % | ±% | |
---|---|---|---|---|---|
Conservative | Stephan Alexander Fifield | 1,038 | 48.3 | +16.8 | |
Liberal Democrats | Jason Edwin Potter-Peachey | 713 | 33.2 | +1.5 | |
Green | Billy Wassell | 231 | 10.8 | +7.5 | |
Labour | Julie Frances Farmer | 166 | 7.7 | +0.1 | |
Majority | 325 | 15.1 | |||
Turnout | 2,148 | 44 | +3 | ||
Conservative gain from Liberal Democrats | Swing | ||||
Party | Candidate | Votes | % | ±% | |
---|---|---|---|---|---|
PAB | Ian Michael Bassett-Smith | 1,128 | 50.0 | -15.7 | |
Conservative | Alan James Davis | 683 | 30.3 | +16.4 | |
Liberal Democrats | Graham Anthony Beale | 445 | 19.7 | -0.7 | |
Majority | 455 | 19.7 | |||
Turnout | 2,256 | 46 | +2 | ||
PAB hold | Swing | ||||
Party | Candidate | Votes | % | ±% | |
---|---|---|---|---|---|
Liberal Democrats | Suzanne Theresa Williams* | 746 | 52.9 | -11.4 | |
Conservative | Paul Robert Simons | 427 | 30.3 | +4.9 | |
Labour | Thomas Alister Johnson | 132 | 9.4 | -1.0 | |
Green | Stephen John Bear | 104 | 7.4 | N/A | |
Majority | 319 | 22.6 | |||
Turnout | 1,409 | 28 | +3 | ||
Liberal Democrats hold | Swing | ||||
Party | Candidate | Votes | % | ±% | |
---|---|---|---|---|---|
Liberal Democrats | Richard James Pineger | 736 | 48.0 | -4.8 | |
Conservative | Jerome Eugene Forrest | 467 | 30.4 | +2.6 | |
Green | David John Clarke | 179 | 11.7 | +4.7 | |
Labour | Mike Farmer | 152 | 9.9 | -2.5 | |
Majority | 269 | 17.6 | |||
Turnout | 1,534 | 32 | +6 | ||
Liberal Democrats hold | Swing | ||||
Party | Candidate | Votes | % | ±% | |
---|---|---|---|---|---|
Liberal Democrats | Alisha Chloe-Marie Lewis | 431 | 33.5 | -5.3 | |
Green | Tabi Joy | 294 | 22.9 | N/A | |
Conservative | Roger Graham Fox | 227 | 17.7 | +5.8 | |
PAB | Daud McDonald | 179 | 13.9 | -9.6 | |
Labour | Kenneth Syme | 136 | 10.6 | -15.1 | |
TUSC | Joe Waters | 19 | 1.5 | N/A | |
Majority | 137 | 10.6 | |||
Turnout | 1,286 | 29 | +3 | ||
Liberal Democrats hold | Swing | ||||
Party | Candidate | Votes | % | ±% | |
---|---|---|---|---|---|
Liberal Democrats | David John Willingham* | 953 | 52.5 | +12.6 | |
Conservative | Edward Wahid Hazzan | 493 | 27.2 | -5.6 | |
Green | Karen Wilson | 215 | 11.9 | -6.1 | |
Labour | Clive Robert Harriss | 153 | 8.4 | -1.0 | |
Majority | 460 | 26 | |||
Turnout | 1,814 | 33 | +4 | ||
Liberal Democrats hold | Swing | ||||
Party | Candidate | Votes | % | ±% | |
---|---|---|---|---|---|
Liberal Democrats | Bernie Fisher* | 740 | 48.3 | -13.8 | |
Conservative | Susan Jean McArdle | 452 | 29.5 | -8.4 | |
Green | Edward Nuan Bycroft Saul | 212 | 13.8 | N/A | |
Labour | Peter Arthur Robert Clark | 128 | 8.4 | N/A | |
Majority | 288 | 18.8 | |||
Turnout | 1,532 | 35 | +8 | ||
Liberal Democrats hold | Swing | ||||
Party | Candidate | Votes | % | ±% | |
---|---|---|---|---|---|
Liberal Democrats | Julie Margaret Sankey | 979 | 47.3 | -9.6 | |
Conservative | Rhiannon Evans | 810 | 39.2 | +3.0 | |
Green | Samantha Diane Hodges | 199 | 9.6 | N/A | |
Labour | Neil Andrew Armitage | 80 | 3.9 | -3.1 | |
Majority | 169 | 8.1 | |||
Turnout | 2,068 | 50 | +7 | ||
Liberal Democrats hold | Swing | ||||
Party | Candidate | Votes | % | ±% | |
---|---|---|---|---|---|
Liberal Democrats | Tony Oliver* | 988 | 47.2 | +0.8 | |
Conservative | Ro Baillie | 868 | 41.4 | -3.1 | |
Green | Timothy Cosmo Bonsor | 164 | 7.8 | +3.0 | |
Labour | Ian Hugh White | 75 | 3.6 | -0.6 | |
Majority | 120 | 5.8 | |||
Turnout | 2,095 | 48 | +3 | ||
Liberal Democrats hold | Swing | ||||
Cheltenham, also known as Cheltenham Spa, is a large spa town and borough on the edge of the Cotswolds in the county of Gloucestershire, England. Cheltenham became known as a health and holiday spa town resort following the discovery of mineral springs in 1716, and claims to be the most complete Regency town in Britain.
Cheltenham is a constituency represented in the House of Commons of the UK Parliament. As with all constituencies, the constituency elects one Member of Parliament (MP) by the first past the post system of election at least every five years.
Half of Cheltenham Borough Council in Gloucestershire, England is elected every two years, while before 2002 the council was elected by thirds. Since the last boundary changes in 2002, 40 councillors have been elected from 20 wards.
Hazel Grove is an electoral ward in the Metropolitan Borough of Stockport. It elects three Councillors to Stockport Metropolitan Borough Council using the first past the post electoral method, electing one Councillor every year without election on the fourth.
The 2010 Cheltenham Council election took place on 6 May 2010 to elect members of Cheltenham Borough Council in Gloucestershire, England. Half of the council was up for election and the Liberal Democrats stayed in overall control of the council.
The 2012 Cheltenham Council election took place on 3 May 2012 to elect members of Cheltenham Borough Council in Gloucestershire, England. Half of the council was up for election and the Liberal Democrats stayed in overall control of the council.
Elections for the London Borough of Merton were held on 22 May 2014 to elect members of Merton London Borough Council in England. This was on the same day as other local elections in England and an election to the European Parliament.
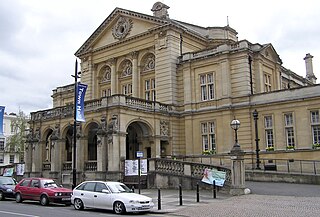
Cheltenham Borough Council is the local authority for Cheltenham, which is split into 20 wards, with a total of 40 councillors elected to serve on the borough council. Since 2002, elections have been held every two years with half of the councillors elected at each election. Following the last election in 2021, there were 30 Liberal Democrat members, 8 Conservatives and 2 representing the People Against Bureaucracy group.
The 2019 Leeds City Council election took place on Thursday 2 May 2019 to elect members of Leeds City Council in England. It was held on the same day as other local elections across England and the rest of the UK.
The 2019 Blackburn with Darwen Borough Council election took place on 2 May 2019 to elect members of Blackburn with Darwen Borough Council in England. This was the same day as other local elections.
Elections to Ipswich Borough Council were held on 6 May 2021. The elections included the seats that were planned to be elected on 7 May 2020, but were postponed due to the COVID-19 pandemic. Usually 16 seats – one in each of the 16 wards – are contested at each election. However, due to the resignation of former Labour Councillor and Mayor Jan Parry in Holywells ward, as well as Conservative Councillor Robin Vickery in Castle Hill, two by-elections were held on the same day. Thus, 18 seats were up for election.
Elections to Hampshire County Council took on 6 May 2021 as part of the 2021 United Kingdom local elections. All 78 seats were up for election, with each ward returning either one or two councillors by first-past-the-post voting for a four-year term of office. This took place at the same time as the elections for the Hampshire Police and Crime Commissioner and district councils.
The 2021 Warrington Borough Council election took place on 6 May 2021 to elect members of Warrington Borough Council in England. This was on the same day as other local elections. All 58 seats were up for election.
The 2021 Pendle Borough Council election took place on 6 May 2021 to elect all members of Pendle Borough Council in England. This was on the same day as other English local elections. All 33 seats across 12 wards were up for election due to boundary changes.
The 2021 Amber Valley Borough Council elections took place on 6 May 2021 to elect members of Amber Valley Borough Council in Derbyshire, England. One third of the council was up for election, and the Conservatives won overall control of the council from Labour.
The 2022 Redbridge London Borough Council election is due to take place on 5 May 2022. All 63 members of Redbridge London Borough Council will be elected. The elections will take place alongside local elections in the other London boroughs and elections to local authorities across the United Kingdom.
The 1991 Cheltenham Council election took place on 2 May 1991 to elect members of Cheltenham Borough Council in Gloucestershire, England. Due to local authority boundary changes a number of areas had been transferred from the Borough of Tewkesbury to the Borough of Cheltenham. Although most wards were unchanged, and continued to elect by thirds, three new wards were created, and had an all-up election: Leckhampton with Warden Hill, Prestbury and Swindon. Furthermore, the ward of Hatherley was abolished and recreated as Hatherley & The Reddings, and the number of councillors it elected was increased from three to four. This ward also had an all-out election.
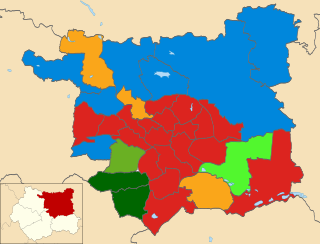
The 2022 Cheltenham Borough Council elections will take place on 5 May 2022 to elect members of Cheltenham Borough Council in Gloucestershire, England. Half of the council was up for election.