County result maps
 2005 results map
 2009 results map
 2013 results map
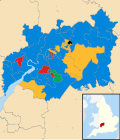 2017 results map
 2021 results map
 2025 results map
Gloucestershire County Council in England is elected every four years. Since the last boundary changes in 2013 the council has comprised 53 councillors, each representing an electoral division. Elections are held every four years. [1]
| Year | Conservative | Labour | Liberal Democrats [a] | Reform | Green | UKIP | Independents & Others | Council control after election | |
|---|---|---|---|---|---|---|---|---|---|
| Local government reorganisation; council established (61 seats) | |||||||||
| 1973 [3] | 30 | 18 | 5 | – | – | – | 8 | No overall control | |
| 1977 [3] | 46 | 3 | 0 | – | 0 | – | 12 | Conservative | |
| 1981 [3] | 25 | 17 | 11 | – | 0 | – | 8 | No overall control | |
| New division boundaries; seats increased from 61 to 63 | |||||||||
| 1985 [3] | 18 | 14 | 23 | – | 0 | – | 8 | No overall control | |
| 1989 [3] | 20 | 16 | 23 | – | 0 | – | 4 | No overall control | |
| 1993 [3] | 10 | 20 | 30 | – | 0 | – | 3 | No overall control | |
| 1997 [3] | 21 | 18 | 22 | – | 0 | 0 | 2 | No overall control | |
| 2001 [3] | 27 | 19 | 16 | – | 0 | 0 | 1 | No overall control | |
| 2005 [3] | 33 | 13 | 13 | – | 0 | 0 | 4 | Conservative | |
| 2009 | 42 | 4 | 13 | – | 1 | 0 | 3 [b] | Conservative | |
| New division boundaries; seats decreased from 63 to 53 | |||||||||
| 2013 | 23 | 9 | 14 | – | 1 | 3 | 3 [c] | No overall control | |
| 2017 | 31 | 5 | 14 | – | 2 | 0 | 1 [d] | Conservative | |
| 2021 | 28 | 5 | 16 | 0 | 4 | 0 | 0 | Conservative | |
| New division boundaries; seats increased from 53 to 55 | |||||||||
| 2025 | 6 | 1 | 27 | 11 | 9 | 0 | 1 | No overall control | |


| Party | Candidate | Votes | % | ±% | |
|---|---|---|---|---|---|
| Liberal Democrats | 1,064 | 80.0 | |||
| Labour | 266 | 20.0 | |||
| Majority | 798 | 60.0 | |||
| Turnout | 1,370 | 16.0 | |||
| Liberal Democrats hold | Swing | ||||
| Party | Candidate | Votes | % | ±% | |
|---|---|---|---|---|---|
| Conservative | 1,274 | 44.0 | +9.1 | ||
| Liberal Democrats | 982 | 33.9 | +11.2 | ||
| Labour | 642 | 22.2 | −20.2 | ||
| Majority | 292 | 10.1 | |||
| Turnout | 2,898 | 24.0 | |||
| Conservative gain from Labour | Swing | ||||
| Party | Candidate | Votes | % | ±% | |
|---|---|---|---|---|---|
| Conservative | 1,087 | 60.8 | +13.6 | ||
| Liberal Democrats | 701 | 39.2 | −3.4 | ||
| Majority | 386 | 21.6 | |||
| Turnout | 1,788 | 37.9 | |||
| Conservative hold | Swing | ||||
| Party | Candidate | Votes | % | ±% | |
|---|---|---|---|---|---|
| Conservative | 1,230 | 71.8 | +31.3 | ||
| Liberal Democrats | 297 | 17.3 | −28.5 | ||
| Labour | 186 | 10.9 | −2.8 | ||
| Majority | 939 | 54.5 | |||
| Turnout | 1,713 | 26.2 | |||
| Conservative gain from Liberal Democrats | Swing | ||||
| Party | Candidate | Votes | % | ±% | |
|---|---|---|---|---|---|
| Liberal Democrats | 958 | 63.2 | −2.0 | ||
| Conservative | 416 | 27.5 | +5.8 | ||
| Labour | 141 | 9.3 | −3.9 | ||
| Majority | 542 | 35.7 | |||
| Turnout | 1,515 | 21.7 | |||
| Liberal Democrats hold | Swing | ||||
| Party | Candidate | Votes | % | ±% | |
|---|---|---|---|---|---|
| Liberal Democrats | 922 | 46.6 | |||
| Labour | 621 | 31.4 | |||
| Conservative | 437 | 22.1 | |||
| Majority | 301 | 15.2 | |||
| Turnout | 1,980 | 22.5 | |||
| Liberal Democrats gain from Labour | Swing | ||||
| Party | Candidate | Votes | % | ±% | |
|---|---|---|---|---|---|
| Conservative | 835 | 44.4 | +20.1 | ||
| Labour | 694 | 36.9 | +5.3 | ||
| Liberal Democrats | 350 | 18.6 | −25.5 | ||
| Majority | 141 | 7.5 | |||
| Turnout | 1,879 | 31.0 | |||
| Conservative gain from Liberal Democrats | Swing | ||||
| Party | Candidate | Votes | % | ±% | |
|---|---|---|---|---|---|
| Conservative | Antonia Noble | 2,208 | 52.3 | −6.6 | |
| Liberal Democrats | Martin Dunne | 1,605 | 38.0 | +7.3 | |
| Labour | Brian Hughes | 226 | 5.4 | +6.6 | |
| Green | Janet Thomas | 184 | 4.3 | +7.3 | |
| Majority | 603 | 14.3 | |||
| Turnout | 4,223 | 30.0 | |||
| Conservative hold | Swing | ||||
| Party | Candidate | Votes | % | ±% | |
|---|---|---|---|---|---|
| Liberal Democrats | Michael Collins | 1,040 | 52.9 | +41.0 | |
| Conservative | Ronald Furolo | 751 | 38.2 | +11. | |
| Labour | Terry Haines | 175 | 8.9 | −15.9 | |
| Majority | 289 | 14.7 | |||
| Turnout | 1,966 | 31.4 | |||
| Liberal Democrats gain from Independent | Swing | ||||
| Party | Candidate | Votes | % | ±% | |
|---|---|---|---|---|---|
| Labour | Brian Oosthuysen | 793 | 31.7 | +19.5 | |
| Conservative | Nigel Cooper | 790 | 31.6 | −3.7 | |
| Liberal Democrats | Christine Headley | 660 | 26.4 | −4.9 | |
| Green | Phil Blomberg | 260 | 10.4 | −10.7 | |
| Majority | 3 | 0.1 | |||
| Turnout | 2,503 | ||||
| Labour gain from Conservative | Swing | ||||
| Party | Candidate | Votes | % | ±% | |
|---|---|---|---|---|---|
| Conservative | Brian Robinson | 959 | 38.4 | +14.0 | |
| UKIP | Malcolm Berry | 550 | 22.0 | +2.7 | |
| Independent | Ian Whitburn | 455 | 18.2 | +18.2 | |
| Labour | Jackie Fraser | 278 | 11.1 | +0.7 | |
| Liberal Democrats | Sue Henchley | 150 | 6.0 | +0.3 | |
| Green | Ken Power | 106 | 4.2 | +0.4 | |
| Majority | 409 | 16.4 | |||
| Turnout | 2,498 | ||||
| Conservative gain from Independent | Swing | ||||
| Party | Candidate | Votes | % | ±% | |
|---|---|---|---|---|---|
| Liberal Democrats | Jack Williams | 1,700 | 54.5 | +5.8 | |
| Conservative | Graham Bocking | 1,062 | 34.0 | +4.4 | |
| Labour | Ed Buxton | 359 | 11.5 | −2.5 | |
| Majority | 638 | 20.4 | |||
| Turnout | 3,121 | ||||
| Liberal Democrats hold | Swing | ||||
| Party | Candidate | Votes | % | ±% | |
|---|---|---|---|---|---|
| Liberal Democrats | Benjamin Evans | 1,405 | 47.8 | −2.7 | |
| Conservative | Graham Bocking | 811 | 27.6 | −12.8 | |
| Independent | Dick Bishop | 263 | 8.9 | +8.9 | |
| Green | Cate Cody | 249 | 8.5 | +8.5 | |
| UKIP | Robert McCormick | 213 | 7.2 | +7.2 | |
| Majority | 594 | 20.2 | |||
| Turnout | 2,941 | ||||
| Liberal Democrats hold | Swing | ||||
| Party | Candidate | Votes | % | ±% | |
|---|---|---|---|---|---|
| Conservative | Paul McLain | 2,041 | 50.7 | −15.5 | |
| Liberal Democrats | James Joyce | 1,411 | 35.1 | +24.0 | |
| Green | Jonathan Bristow | 572 | 14.2 | +2.2 | |
| Majority | 630 | 15.7 | |||
| Turnout | 4,024 | ||||
| Conservative hold | Swing | ||||
| Current | |
|---|---|
| Former | |
aUnitary authorities referred to as county councils | |