Elections
Summary of the council composition, click on the year for full details of each election.
| Year | Conservative | Labour | Liberal Democrats [a] | Reform | Green | Independents & Others | Council control after election | |
|---|---|---|---|---|---|---|---|---|
| Local government reorganisation; council established (72 seats) | ||||||||
| 1973 [2] | 35 | 33 | 3 | – | – | 1 | No overall control | |
| 1977 [2] | 65 | 6 | 0 | – | 0 | 1 | Conservative | |
| New division boundaries; increased seats from 72 to 77 [3] | ||||||||
| 1981 [2] | 43 | 29 | 4 | – | 0 | 1 | Conservative | |
| 1985 [2] | 36 | 27 | 14 | – | 0 | 0 | No overall control | |
| 1989 [2] | 45 | 27 | 5 | – | 0 | 0 | Conservative | |
| 1993 [2] | 27 | 30 | 19 | – | 0 | 1 | No overall control | |
| 1997 [2] | 38 | 30 | 9 | – | 0 | 0 | No overall control | |
| New division boundaries [4] | ||||||||
| 2001 [5] | 40 | 27 | 10 | – | 0 | 0 | Conservative | |
| 2005 [6] | 46 | 16 | 14 | – | 1 | 0 | Conservative | |
| 2009 [7] | 55 | 3 | 17 | – | 1 | 1 [b] | Conservative | |
| 2013 [8] | 46 | 15 | 16 | – | 0 | 0 | Conservative | |
| New division boundaries [1] | ||||||||
| 2017 [9] | 51 | 9 | 18 | – | 0 | 0 | Conservative | |
| 2021 [10] | 46 | 7 | 23 | 0 | 1 | 1 | Conservative | |
| 2025 [11] | 22 | 5 | 31 | 14 | 5 | 1 | No overall control | |
Result maps
 2001 results map
 2005 results map
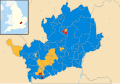 2009 results map
 2013 results map
 2017 results map
 2021 results map
 2025 results map


