Council elections
| Year | Conservative | Labour | Liberal Democrats [a] | Reform | Green | UKIP | BNP | Independent | Council control after election | |
|---|---|---|---|---|---|---|---|---|---|---|
| 1973 [2] | 42 | 36 | 7 | – | – | – | – | 8 | No overall control | |
| 1977 [2] | 75 | 17 | 0 | 1 | Conservative | |||||
| 1981 [2] | 44 | 43 | 5 | 1 | No overall control | |||||
| 1985 [b] [2] | 42 | 32 | 11 | 0 | 0 | No overall control | ||||
| 1989 [2] | 39 | 33 | 12 | 0 | 1 | No overall control | ||||
| 1993 [4] | 31 | 37 | 17 | 0 | 0 | No overall control | ||||
| 1997 [c] [6] | 25 | 17 | 11 | – | 1 | No overall control | ||||
| 2001 [7] [8] | 29 | 15 | 10 | 0 | Conservative | |||||
| 2005 [d] [10] [11] | 30 | 12 | 13 | 0 | 0 | Conservative | ||||
| 2009 [12] [13] | 36 | 4 | 14 | 1 | 0 | Conservative | ||||
| 2013 [14] | 30 | 10 | 13 | 2 | 0 | 0 | Conservative | |||
| 2017 [e] [16] | 36 | 6 | 13 | 0 | – | 0 | Conservative | |||
| 2021 [17] | 42 | 4 | 9 | – | 0 | Conservative | ||||
| 2025 [18] | 15 | 2 | 11 | 25 | 1 | 1 | No overall control | |||
County result maps
 2005
2005 2009
2009 2013
2013 2017
2017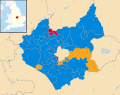 2021
2021 2025
2025


