Results maps
 2003 results map
 2007 results map
 2011 results map
 2015 results map
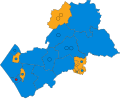 2019 results map
 2023 results map
Harborough District Council elections are generally held every four years. Harborough District Council is the local authority for the non-metropolitan district of Harborough in Leicestershire, England. Since the last boundary changes in 2019, 34 councillors have been elected from 19 wards. [1]
| Overall control | Conservative | Lib Dem | Labour | Green | Independent | ||||||
| 2023 | NOC | 15 | 13 | 3 | 3 | - | |||||
| 2019 | Conservative | 22 | 11 | 1 | - | - | |||||
| 2015 | Conservative | 29 | 8 | - | - | - | |||||
A dash indicates that the results for a particular election are not available, or that a party did not stand in an election.


| Party | Candidate | Votes | % | ±% | |
|---|---|---|---|---|---|
| Conservative | 544 | 52.7 | −4.4 | ||
| Liberal Democrats | 339 | 32.8 | +32.8 | ||
| Labour | 149 | 14.4 | −28.6 | ||
| Majority | 205 | 19.9 | |||
| Turnout | 1,032 | 33.0 | |||
| Conservative hold | Swing | ||||
| Party | Candidate | Votes | % | ±% | |
|---|---|---|---|---|---|
| Liberal Democrats | 733 | 50.2 | +43.9 | ||
| Conservative | 500 | 34.3 | +11.7 | ||
| Independent | 119 | 8.2 | −49.7 | ||
| Independent | 66 | 4.5 | +4.5 | ||
| Majority | 233 | 15.9 | |||
| Turnout | 1,418 | 34.7 | |||
| Liberal Democrats gain from Independent | Swing | ||||
| Party | Candidate | Votes | % | ±% | |
|---|---|---|---|---|---|
| Liberal Democrats | 690 | 55.1 | −3.7 | ||
| Conservative | 562 | 44.9 | +13.0 | ||
| Majority | 128 | 10.2 | |||
| Turnout | 1,252 | 31.0 | |||
| Liberal Democrats hold | Swing | ||||
| Party | Candidate | Votes | % | ±% | |
|---|---|---|---|---|---|
| Conservative | 2,255 | 61.3 | +3.1 | ||
| Labour | 1,426 | 37.7 | −3.1 | ||
| Majority | 829 | 23.6 | |||
| Turnout | 3,681 | ||||
| Conservative hold | Swing | ||||
| Party | Candidate | Votes | % | ±% | |
|---|---|---|---|---|---|
| Conservative | 549 | 48.3 | −10.4 | ||
| Liberal Democrats | 367 | 32.3 | +32.3 | ||
| Labour | 221 | 19.4 | −21.9 | ||
| Majority | 182 | 16.0 | |||
| Turnout | 1,137 | ||||
| Conservative hold | Swing | ||||
| Party | Candidate | Votes | % | ±% | |
|---|---|---|---|---|---|
| Conservative | 397 | 46.7 | +4.5 | ||
| Liberal Democrats | 374 | 43.9 | −3.2 | ||
| Labour | 80 | 9.4 | −1.3 | ||
| Majority | 23 | 2.8 | |||
| Turnout | 851 | 55.0 | |||
| Conservative gain from Liberal Democrats | Swing | ||||
| Party | Candidate | Votes | % | ±% | |
|---|---|---|---|---|---|
| Liberal Democrats | Carol LoGalbo | 615 | 51.9 | −7.8 | |
| Conservative | Robert Brewer | 570 | 48.1 | +7.8 | |
| Majority | 45 | 3.8 | |||
| Turnout | 1,185 | 33.0 | |||
| Liberal Democrats hold | Swing | ||||
| Party | Candidate | Votes | % | ±% | |
|---|---|---|---|---|---|
| Conservative | John Everett | 425 | 57.6 | −16.9 | |
| Liberal Democrats | Stephen Walkley | 266 | 36.0 | +36.0 | |
| Labour | Elaine Carter | 47 | 6.4 | −19.1 | |
| Majority | 159 | 21.6 | |||
| Turnout | 738 | 37.9 | |||
| Conservative hold | Swing | ||||
| Party | Candidate | Votes | % | ±% | |
|---|---|---|---|---|---|
| Conservative | Chris Golden | unopposed | |||
| Conservative hold | Swing | ||||
| Party | Candidate | Votes | % | ±% | |
|---|---|---|---|---|---|
| Liberal Democrats | Colin Davies | 600 | 54.8 | +7.1 | |
| Conservative | Barry Champion | 373 | 34.1 | +5.3 | |
| BNP | Geoffrey Dickens | 122 | 11.1 | +11.1 | |
| Majority | 227 | 20.7 | |||
| Turnout | 1,095 | 22.8 | |||
| Liberal Democrats hold | Swing | ||||
| Party | Candidate | Votes | % | ±% | |
|---|---|---|---|---|---|
| Liberal Democrats | Phil Knowles | 966 | 61.8 | +12.1 | |
| Conservative | Barry Champion | 598 | 38.2 | −12.1 | |
| Majority | 368 | 23.6 | |||
| Turnout | 1,564 | 24.9 | |||
| Liberal Democrats gain from Conservative | Swing | ||||
| Party | Candidate | Votes | % | ±% | |
|---|---|---|---|---|---|
| Liberal Democrats | Peter Elliott | 1,341 | 63.1 | −2.1 | |
| Conservative | Simon Whelband | 785 | 36.9 | +2.1 | |
| Majority | 556 | 26.2 | |||
| Turnout | 2,126 | ||||
| Liberal Democrats hold | Swing | ||||
| Party | Candidate | Votes | % | ±% | |
|---|---|---|---|---|---|
| Conservative | Lesley Bowles | 259 | 54.2 | −21.2 | |
| Liberal Democrats | Annette Deacon | 114 | 23.8 | +23.8 | |
| UKIP | Bill Piper | 105 | 22.0 | +22.0 | |
| Majority | 145 | 30.3 | |||
| Turnout | 478 | ||||
| Conservative hold | Swing | ||||
| Party | Candidate | Votes | % | ±% | |
|---|---|---|---|---|---|
| Liberal Democrats | Barbara Johnson | 402 | 45.2 | +9.0 | |
| Conservative | Paul Bremner | 303 | 34.0 | −1.4 | |
| Labour | Anne Pridmore | 82 | 9.2 | −5.9 | |
| Green | Darren Woodiwiss | 56 | 6.3 | −7.1 | |
| UKIP | Robert Davison | 47 | 5.3 | +5.3 | |
| Majority | 99 | 11.1 | |||
| Turnout | 890 | ||||
| Liberal Democrats hold | Swing | ||||
| Party | Candidate | Votes | % | ±% | |
|---|---|---|---|---|---|
| Conservative | Jonathan Bateman | 257 | 50.4 | −24.7 | |
| Labour | Liz Marsh | 119 | 23.3 | −1.6 | |
| Liberal Democrats | Martin Sarfas | 77 | 15.1 | +15.1 | |
| UKIP | Bill Piper | 57 | 11.2 | +11.2 | |
| Majority | 138 | 27.1 | |||
| Turnout | 510 | ||||
| Conservative hold | Swing | ||||
| Party | Candidate | Votes | % | ±% | |
|---|---|---|---|---|---|
| Conservative | Peter Critchley | 727 | 40.9 | +4.5 | |
| Liberal Democrats | James Ward | 507 | 28.5 | −11.8 | |
| Labour | Maria Panter | 213 | 12.0 | −11.4 | |
| Women's Equality | Clare Bottle | 149 | 8.4 | +8.4 | |
| Green | Mary Morgan | 122 | 6.9 | +6.9 | |
| Independent | Robin Lambert | 61 | 3.4 | +3.4 | |
| Majority | 220 | 12.4 | |||
| Turnout | 1,779 | ||||
| Conservative hold | Swing | ||||
| Party | Candidate | Votes | % | ±% | |
|---|---|---|---|---|---|
| Liberal Democrats | Geraldine Whitmore | 582 | 45.7 | +10.4 | |
| Conservative | Robin Cutsforth | 382 | 30.0 | +3.2 | |
| Labour | Maria Panter | 250 | 19.6 | +10.6 | |
| Independent | Robin Lambert | 60 | 4.7 | −6.4 | |
| Majority | 200 | 15.7 | |||
| Turnout | 1,274 | ||||
| Liberal Democrats hold | Swing | ||||
| Party | Candidate | Votes | % | ±% | |
|---|---|---|---|---|---|
| Conservative | Peter Scott | 809 | 79.8 | ||
| Liberal Democrats | Christopher Graves | 114 | 11.2 | ||
| Labour | Andy Thomas | 77 | 7.6 | ||
| SDP | Robin Lambert | 14 | 1.4 | ||
| Majority | 695 | 68.5 | |||
| Turnout | 1,014 | ||||
| Conservative hold | Swing | ||||
| Party | Candidate | Votes | % | ±% | |
|---|---|---|---|---|---|
| Conservative | Paul Bremner | 410 | 31.3 | ||
| Liberal Democrats | Roger Dunton | 355 | 27.1 | ||
| Green | Jake Bolton | 290 | 22.2 | ||
| Reform | Jonny Austin | 190 | 14.5 | ||
| Labour | Bridget Fitzpatrick | 44 | 3.4 | ||
| Independent | Robin Lambert | 10 | 0.8 | ||
| Communist | Peter Whalen | 9 | 0.7 | ||
| Majority | 55 | 4.2 | |||
| Turnout | 1,308 | ||||
| Conservative gain from Liberal Democrats | Swing | ||||
| Party | Candidate | Votes | % | ±% | |
|---|---|---|---|---|---|
| Reform | Jonny Austin | 551 | 35.0 | ||
| Liberal Democrats | Stephen Walkley | 453 | 28.7 | ||
| Conservative | Peter Critchley | 416 | 26.4 | ||
| Green | Jessie Jenkins | 102 | 6.5 | ||
| Labour | Helen Morrison | 54 | 3.4 | ||
| Majority | 98 | 6.2 | |||
| Turnout | 1,576 | ||||
| Reform gain from Conservative | Swing | ||||
| Party | Candidate | Votes | % | ±% | |
|---|---|---|---|---|---|
| Conservative | David Page | 461 | 34.7 | ||
| Green | Jake Bolton | 358 | 26.9 | ||
| Liberal Democrats | Marion Lewis | 268 | 20.2 | ||
| Reform | Barry Walton | 195 | 14.7 | ||
| Labour | Deborah Bennett | 43 | 3.2 | ||
| SDP | Robin Lambert | 4 | 0.3 | ||
| Majority | 103 | 7.8 | |||
| Turnout | 1,329 | ||||
| Conservative gain from Liberal Democrats | Swing | ||||