This article relies largely or entirely on a single source .(August 2020) |
| |||||||||||||||||||||||||||||||||||||||||||||||||||||||||||||
All 38 seats to North West Leicestershire District Council 20 seats needed for a majority | |||||||||||||||||||||||||||||||||||||||||||||||||||||||||||||
---|---|---|---|---|---|---|---|---|---|---|---|---|---|---|---|---|---|---|---|---|---|---|---|---|---|---|---|---|---|---|---|---|---|---|---|---|---|---|---|---|---|---|---|---|---|---|---|---|---|---|---|---|---|---|---|---|---|---|---|---|---|
| |||||||||||||||||||||||||||||||||||||||||||||||||||||||||||||
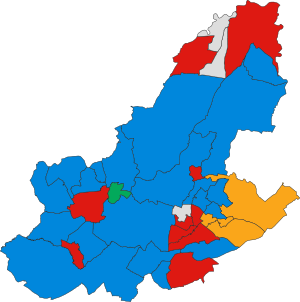
Results map of the election | |||||||||||||||||||||||||||||||||||||||||||||||||||||||||||||
|
Elections to elect all members of the North West Leicestershire District Council took place on 2 May 2019, held as one of the English local elections of that year. [1]
2019 North West Leicestershire District Council election | ||||||||||
---|---|---|---|---|---|---|---|---|---|---|
Party | Candidates | Seats | Gains | Losses | Net gain/loss | Seats % | Votes % | Votes | +/− | |
Conservative | 38 | 20 | 2 | 7 | 5 | 52.6 | 45.1 | 11,072 | –1.8 | |
Labour | 38 | 10 | 3 | 3 | 26.3 | 33.0 | 8,116 | –1.2 | ||
Liberal Democrats | 16 | 4 | 3 | 0 | 3 | 10.5 | 12.3 | 3,032 | +5.9 | |
Independent | 4 | 3 | 1 | 0 | 1 | 7.9 | 3.9 | 948 | –0.2 | |
Green | 1 | 1 | 1 | 0 | 1 | 2.6 | 1.7 | 429 | +1.4 | |
UKIP | 6 | 0 | 0 | 0 | 0.0 | 3.3 | 805 | –4.5 | ||
Libertarian | 1 | 0 | 0 | 0 | 0.0 | 0.3 | 83 | N/A | ||
Monster Raving Loony | 1 | 0 | 0 | 0 | 0.0 | 0.3 | 76 | N/A |
Party | Candidate | Votes | % | ±% | |
---|---|---|---|---|---|
Conservative | Richard Blunt | 451 | 58.5 | ||
Labour | Joe Wain | 127 | 16.5 | ||
Liberal Democrats | David Wyatt | 117 | 15.2 | ||
Monster Raving Loony | Colin Roberts | 76 | 9.9 | ||
Majority | |||||
Turnout | 778 | ||||
Conservative hold | Swing | ||||
Party | Candidate | Votes | % | ±% | |
---|---|---|---|---|---|
Green | Carl Benfield | 429 | 43.0 | ||
Conservative | John Coxon | 427 | 42.8 | ||
Labour | Paul Montgomery | 141 | 14.1 | ||
Majority | |||||
Turnout | 1,008 | ||||
Green gain from Conservative | Swing | ||||
Party | Candidate | Votes | % | ±% | |
---|---|---|---|---|---|
Conservative | Roger Bayliss | 379 | 52.5 | ||
Labour | Doug Cooper | 235 | 32.5 | ||
Liberal Democrats | Maxine Sedgwick | 108 | 15.0 | ||
Majority | |||||
Turnout | 749 | ||||
Conservative hold | Swing | ||||
Party | Candidate | Votes | % | ±% | |
---|---|---|---|---|---|
Conservative | Jim Hoult | 450 | 54.9 | ||
Labour | Elaine Robinson | 370 | 45.1 | ||
Majority | |||||
Turnout | 845 | ||||
Conservative hold | Swing | ||||
Party | Candidate | Votes | % | ±% | |
---|---|---|---|---|---|
Conservative | Daniel Harrison | 375 | 60.5 | ||
Labour | Avril Wilson | 245 | 39.5 | ||
Majority | |||||
Turnout | 646 | ||||
Conservative hold | Swing | ||||
Party | Candidate | Votes | % | ±% | |
---|---|---|---|---|---|
Labour | Dave Bigby | 424 | 53.5 | ||
Conservative | David Jones | 368 | 46.5 | ||
Majority | |||||
Turnout | 830 | ||||
Labour gain from Conservative | Swing | ||||
Party | Candidate | Votes | % | ±% | |
---|---|---|---|---|---|
Conservative | John Bridges | 339 | 61.4 | ||
Labour | Anne Donegan | 213 | 38.6 | ||
Majority | |||||
Turnout | 582 | ||||
Conservative hold | Swing | ||||
Party | Candidate | Votes | % | ±% | |
---|---|---|---|---|---|
Liberal Democrats | Angela Black | 295 | 48.1 | ||
Conservative | Mick Specht | 122 | 19.9 | ||
Labour | Nick Clarke | 113 | 18.4 | ||
Libertarian | Dan Liddicott | 83 | 13.5 | ||
Majority | |||||
Turnout | 626 | ||||
Liberal Democrats gain from Conservative | Swing | ||||
Party | Candidate | Votes | % | ±% | |
---|---|---|---|---|---|
Conservative | Hill Hoult | 361 | 53.4 | ||
Labour | Kath Lauro | 315 | 46.6 | ||
Majority | |||||
Turnout | 705 | ||||
Conservative gain from Labour | Swing | ||||
Party | Candidate | Votes | % | ±% | |
---|---|---|---|---|---|
Conservative | Alexander Bridgen | 366 | 39.7 | ||
Liberal Democrats | Lee Windram | 344 | 37.3 | ||
Labour | Anthony Barker | 212 | 23.0 | ||
Majority | |||||
Turnout | 945 | ||||
Conservative gain from Labour | Swing | ||||
Party | Candidate | Votes | % | ±% | |
---|---|---|---|---|---|
Independent | Tony Saffell | 288 | 45.3 | ||
Labour Co-op | Ray Sutton | 193 | 30.3 | ||
Conservative | Leon Spence | 155 | 24.4 | ||
Majority | |||||
Turnout | 658 | ||||
Independent hold | Swing | ||||
Party | Candidate | Votes | % | ±% | |
---|---|---|---|---|---|
Independent | Rachel Canny | 435 | 68.1 | ||
Conservative | Lisa Collins | 146 | 22.8 | ||
Labour | Dan Green | 58 | 9.1 | ||
Majority | |||||
Turnout | 652 | ||||
Independent hold | Swing | ||||
Party | Candidate | Votes | % | ±% | |
---|---|---|---|---|---|
Labour | Michael Hay | 190 | 54.4 | ||
Conservative | Leigh Brothwell | 159 | 45.6 | ||
Majority | |||||
Turnout | 374 | ||||
Labour gain from Conservative | Swing | ||||
Party | Candidate | Votes | % | ±% | |
---|---|---|---|---|---|
Liberal Democrats | Michael Wyatt | 432 | 61.7 | ||
Conservative | Paula Purver | 164 | 23.4 | ||
Labour | Olivia Andrade | 104 | 14.9 | ||
Majority | |||||
Turnout | 716 | ||||
Liberal Democrats hold | Swing | ||||
Party | Candidate | Votes | % | ±% | |
---|---|---|---|---|---|
Liberal Democrats | Marie French | 286 | 44.5 | ||
Conservative | Ronald Cotterill | 200 | 31.1 | ||
Labour | Elijah Bennett | 157 | 24.4 | ||
Majority | |||||
Turnout | 647 | ||||
Liberal Democrats gain from Conservative | Swing | ||||
Party | Candidate | Votes | % | ±% | |
---|---|---|---|---|---|
Labour Co-op | John Legrys | 209 | 45.0 | ||
Liberal Democrats | Moira Lynch | 151 | 32.5 | ||
Conservative | Mary Tuckey | 104 | 22.4 | ||
Majority | |||||
Turnout | 472 | ||||
Labour hold | Swing | ||||
Party | Candidate | Votes | % | ±% | |
---|---|---|---|---|---|
Labour | Carol Sewell | 305 | 53.4 | ||
Conservative | Clare Watson-Spence | 266 | 46.6 | ||
Majority | |||||
Turnout | 590 | ||||
Labour gain from Conservative | Swing | ||||
Party | Candidate | Votes | % | ±% | |
---|---|---|---|---|---|
Conservative | Keith Merrie | 272 | 47.9 | ||
UKIP | Matthew Pollard | 123 | 21.7 | ||
Labour | Martin Walton | 109 | 19.2 | ||
Liberal Democrats | Sheila Wyatt | 64 | 11.3 | ||
Majority | |||||
Turnout | 576 | ||||
Conservative hold | Swing | ||||
Party | Candidate | Votes | % | ±% | |
---|---|---|---|---|---|
Liberal Democrats | Jake Windram | 232 | 38.9 | ||
Labour | Ron Adams | 183 | 30.7 | ||
UKIP | Benny Wileman | 124 | 20.8 | ||
Conservative | Robert Bradley | 57 | 9.6 | ||
Majority | |||||
Turnout | 605 | ||||
Liberal Democrats gain from Labour | Swing | ||||
Party | Candidate | Votes | % | ±% | |
---|---|---|---|---|---|
Conservative | Stuart Gillard | 277 | 53.3 | ||
Labour | Peter Moult | 243 | 46.7 | ||
Majority | |||||
Turnout | 541 | ||||
Conservative hold | Swing | ||||
Party | Candidate | Votes | % | ±% | |
---|---|---|---|---|---|
Conservative | Tony Gillard | 421 | 61.6 | ||
Labour | Alison Andrade | 262 | 38.4 | ||
Majority | |||||
Turnout | 709 | ||||
Conservative hold | Swing | ||||
Party | Candidate | Votes | % | ±% | |
---|---|---|---|---|---|
Labour | Russell Johnson | 236 | 49.0 | ||
Conservative | Vicki Boam | 168 | 34.9 | ||
Liberal Democrats | Aaron Windram | 78 | 16.2 | ||
Majority | |||||
Turnout | 502 | ||||
Labour hold | Swing | ||||
Party | Candidate | Votes | % | ±% | |
---|---|---|---|---|---|
Labour Co-op | Terri Eynon | 243 | 37.9 | ||
Conservative | Will Jennings | 222 | 34.6 | ||
Liberal Democrats | James Hemsley | 176 | 27.5 | ||
Majority | |||||
Turnout | 657 | ||||
Labour Co-op hold | Swing | ||||
Party | Candidate | Votes | % | ±% | |
---|---|---|---|---|---|
Labour | Daniel Tebbutt | 222 | 41.8 | ||
Conservative | Pamela Spence | 171 | 32.2 | ||
UKIP | George Norley | 138 | 26.0 | ||
Majority | |||||
Turnout | 539 | ||||
Labour hold | Swing | ||||
Party | Candidate | Votes | % | ±% | |
---|---|---|---|---|---|
Conservative | John Clarke | 361 | 65.0 | ||
Labour | Jim Roberts | 194 | 35.0 | ||
Majority | |||||
Turnout | 579 | ||||
Conservative hold | Swing | ||||
Party | Candidate | Votes | % | ±% | |
---|---|---|---|---|---|
Conservative | Bertie Rushton | 340 | 64.9 | ||
Labour | David Manley | 184 | 35.1 | ||
Majority | |||||
Turnout | 562 | ||||
Conservative hold | Swing | ||||
Party | Candidate | Votes | % | ±% | |
---|---|---|---|---|---|
Conservative | Nicholas Rushton | 482 | 57.3 | ||
Labour | Anna Champneys | 359 | 42.7 | ||
Majority | |||||
Turnout | 865 | ||||
Conservative hold | Swing | ||||
Party | Candidate | Votes | % | ±% | |
---|---|---|---|---|---|
Conservative | Andrew Woodman | 242 | 45.1 | ||
Labour Co-op | Laurie Andrade | 190 | 35.4 | ||
UKIP | Angela Ross | 105 | 19.6 | ||
Majority | |||||
Turnout | 540 | ||||
Conservative hold | Swing | ||||
Party | Candidate | Votes | % | ±% | |
---|---|---|---|---|---|
Labour Co-op | Sean Sheahan | 281 | 45.0 | ||
UKIP | Karen Lott | 193 | 30.9 | ||
Conservative | Annette Bridges | 150 | 24.0 | ||
Majority | |||||
Turnout | 630 | ||||
Labour Co-op hold | Swing | ||||
Party | Candidate | Votes | % | ±% | |
---|---|---|---|---|---|
Conservative | Robert Ashman | 338 | 61.7 | ||
Labour | Richard Dyason | 210 | 38.3 | ||
Majority | |||||
Turnout | 574 | ||||
Conservative hold | Swing | ||||
Party | Candidate | Votes | % | ±% | |
---|---|---|---|---|---|
Conservative | Nigel Smith | 510 | 59.1 | ||
Liberal Democrats | David Holliday | 216 | 25.0 | ||
Labour | Kathleen Timberley | 137 | 15.9 | ||
Majority | |||||
Turnout | 885 | ||||
Conservative hold | Swing | ||||
Party | Candidate | Votes | % | ±% | |
---|---|---|---|---|---|
Conservative | Virge Richichi | 369 | 60.6 | ||
Labour | Rupert Knapton | 240 | 39.4 | ||
Majority | |||||
Turnout | 630 | ||||
Conservative hold | Swing | ||||
Party | Candidate | Votes | % | ±% | |
---|---|---|---|---|---|
Independent | Elliott Allman | 134 | 26.2 | ||
Labour | Fliss Middleton | 133 | 26.0 | ||
Conservative | Hope Brothwell | 130 | 25.4 | ||
Liberal Democrats | Vivienne Brooks | 114 | 22.3 | ||
Majority | |||||
Turnout | 515 | ||||
Independent gain from Conservative | Swing | ||||
Party | Candidate | Votes | % | ±% | |
---|---|---|---|---|---|
Labour | John Geary | 177 | 33.7 | ||
Liberal Democrats | Jack Coleman | 134 | 25.5 | ||
UKIP | Paul Martin | 122 | 23.2 | ||
Conservative | Paul Spence | 92 | 17.5 | ||
Majority | |||||
Turnout | 530 | ||||
Labour hold | Swing | ||||
Party | Candidate | Votes | % | ±% | |
---|---|---|---|---|---|
Conservative | Louise Gillard | 362 | 48.9 | ||
Labour | Ray Woodward | 287 | 38.8 | ||
Independent | John Smith | 91 | 12.3 | ||
Majority | |||||
Turnout | 761 | ||||
Conservative hold | Swing | ||||
Party | Candidate | Votes | % | ±% | |
---|---|---|---|---|---|
Labour | Dave Everitt | 307 | 56.5 | ||
Conservative | Mark Evans | 236 | 43.5 | ||
Majority | |||||
Turnout | 574 | ||||
Labour hold | Swing | ||||
Party | Candidate | Votes | % | ±% | |
---|---|---|---|---|---|
Conservative | Russell Boam | 490 | 60.8 | ||
Labour | Paul Cudby | 161 | 20.0 | ||
Liberal Democrats | Paul Tyler | 155 | 19.2 | ||
Majority | |||||
Turnout | 830 | ||||
Conservative hold | Swing | ||||
Party | Candidate | Votes | % | ±% | |
---|---|---|---|---|---|
Conservative | David Stevenson | 550 | 66.5 | ||
Labour | Gregory Parle | 147 | 17.8 | ||
Liberal Democrats | Alan Turner | 130 | 15.7 | ||
Majority | |||||
Turnout | 846 | ||||
Conservative hold | Swing | ||||
Elliott Allman, elected as an independent in Snibston North ward, joined the Conservatives in 2020. [2]
Party | Candidate | Votes | % | ±% | |
---|---|---|---|---|---|
Conservative | Jenny Simmons | 355 | 57.8 | +25.6 | |
Labour | Carissma Griffiths | 164 | 26.7 | -15.1 | |
Liberal Democrats | David Wyatt | 54 | 8.8 | +8.8 | |
Green | Liz Fletcher | 41 | 6.7 | +6.7 | |
Majority | 191 | 31.1 | |||
Turnout | 614 | ||||
Conservative gain from Labour | Swing | ||||
Party | Candidate | Votes | % | ±% | |
---|---|---|---|---|---|
Conservative | Raymond Morris | 696 | 69.7 | +3.2 | |
Labour | Gregory Parle | 139 | 13.9 | -3.9 | |
Green | Gareth Shilton | 104 | 10.4 | +10.4 | |
Liberal Democrats | Paul Tyler | 60 | 6.0 | -9.7 | |
Majority | 557 | 55.8 | |||
Turnout | 999 | ||||
Conservative hold | Swing | ||||
Russell Johnson, elected as a Labour councillor in Hugglestone St John's ward, left the party to sit as an independent early in 2023. [5]
Lewes District Council in East Sussex, England is elected every four years. Since the last boundary changes in 2019, 41 councillors are elected from 21 wards.
Braintree District Council in Essex, England is elected every four years. Since the last comprehensive boundary changes in 2015, 49 councillors have been elected from 26 wards.
Broxtowe Borough Council elections are held every four years. Broxtowe Borough Council is the local authority for the non-metropolitan district of Borough of Broxtowe in Nottinghamshire, England. Since the full review of boundaries in 2015, 44 councillors are elected from 20 wards.
Cannock Chase District Council elections are held three years out of every four, with a third of the council elected each time. Cannock Chase District Council is the local authority for the non-metropolitan district of Cannock Chase in Staffordshire, England. Since the last boundary changes in 2002, 41 councillors have been elected from 15 wards.
Fenland District Council in Cambridgeshire, England is elected every four years. Since the last boundary changes in 2023, the council has comprised 43 councillors representing 18 wards, with each ward electing one, two or three councillors.
Dartford Borough Council is the local authority for the Borough of Dartford in Kent, England. The council is elected every four years.
North Norfolk District Council in Norfolk, England is elected every four years.
One third of Mole Valley District Council in Surrey, England is elected each year, followed by one year when there is an election to Surrey County Council instead.
North West Leicestershire District Council elections are held every four years. North West Leicestershire District Council is the local authority for the non-metropolitan district of North West Leicestershire in Leicestershire, England. Since the last boundary changes in 2015, 38 councillors are elected from 38 wards.
Teignbridge District Council in Devon, England is elected every four years. Since the last boundary changes in 2019, 47 councillors have been elected from 24 wards.
Thanet District Council elections are held every four years to elect Thanet District Council in Kent, England. Since the last boundary changes in 2003 the council has comprised 56 councillors representing 23 wards.
Local elections were held in Waveney district every four years to elect councillors to Waveney District Council. In the past, one-third of councillors were elected each year, but in 2010 the council opted to change to a whole council election system. Since the last boundary changes in 2002, 48 councillors have been elected from 23 wards. The district was merged with Suffolk Coastal in April 2019 to form East Suffolk, meaning that the 2015 elections were the final Waveney elections to be held.
East Cambridgeshire District Council is a non-metropolitan district council in the county of Cambridgeshire in the United Kingdom. Elections are held every four years.
The 2015 Wealden District Council election took place on 7 May 2015 to elect members of the Wealden District Council in England. It was held on the same day as other local elections.
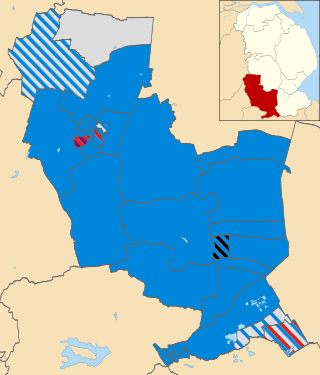
The 2015 South Kesteven District Council election took place on 7 May 2015 to elect members of South Kesteven District Council in Lincolnshire, England. The whole council was up for election after boundary changes reduced the number of seats by two. The Conservative party stayed in overall control of the council.
The 2015 Rother District Council election took place on 7 May 2015 to elect members of Rother District Council in East Sussex, England. The whole council was up for election and the Conservative Party stayed in overall control of the council.
Nottingham City Council elections are held every four years. Nottingham City Council is the local authority for the unitary authority of Nottingham in Nottinghamshire, England. Until 1 April 1998 it was a non-metropolitan district. Since the last boundary changes in 2019, 55 councillors are elected from 20 wards.
The 2019 Craven District Council election took place on 2 May 2019 to elect members of Craven District Council in England.
The 2022 North Yorkshire Council election took place on 5 May 2022, alongside the other local elections. These were the last elections to North Yorkshire County Council, and the elected councillors would also serve as the first councillors on the North Yorkshire Council, which replaced the existing county council in April 2023.
The 2019 South Kesteven District Council election took place on 2 May 2019 to elect members of South Kesteven District Council. This was on the same day as other local elections. The entire council was up for election. The incumbent Conservatives lost 5 seats and UKIP lost 1, while independents gained 5 and the Liberal Democrats gained 2. Two wards did not hold a vote, as an equal number of candidates ran as seats available.