Results maps
 2003 results map
 2007 results map
 2011 results map
 2015 results map
 2019 results map
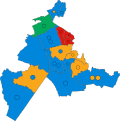 2023 results map
Blaby District Council elections are held every four years. Blaby District Council is the local authority for the non-metropolitan district of Blaby in Leicestershire, England. Since the last boundary changes in 2023 the council has comprised 36 councillors representing 17 wards, with each ward electing one, two or three councillors. [1]
| Overall control | Conservative | Labour | Lib Dem | Independent | Green | ||||||
| 2023 | Conservative | 19 | 6 | 9 | – | 2 | |||||
| 2019 | Conservative | 25 | 6 | 6 | 1 | 1 | |||||
| 2015 | Conservative | 29 | 6 | 4 | – | – | |||||
| 2011 | Conservative | 28 | 6 | 5 | – | – | |||||
| 2007 | Conservative | 27 | 4 | 7 | 1 | – | |||||
| 2003 | Conservative | 25 | 4 | 9 | 1 | – | |||||
| 1999 | Conservative | 25 | 6 | 8 | – | – | |||||
A dash indicates that the results for a particular election are not available, or that a party did not stand in an election.


| Party | Candidate | Votes | % | ±% | |
|---|---|---|---|---|---|
| Labour | 335 | 34.1 | |||
| Liberal Democrats | 212 | 21.6 | |||
| Conservative | 177 | 18.0 | |||
| Independent | 158 | 16.1 | |||
| Independent | 101 | 10.2 | |||
| Majority | 123 | 12.5 | |||
| Turnout | 983 | 31.6 | |||
| Labour gain from Independent | Swing | ||||
| Party | Candidate | Votes | % | ±% | |
|---|---|---|---|---|---|
| Conservative | 578 | 64.5 | +7.3 | ||
| Liberal Democrats | 314 | 35.2 | +35.2 | ||
| Majority | 264 | 29.3 | |||
| Turnout | 892 | 29.7 | |||
| Conservative hold | Swing | ||||
| Party | Candidate | Votes | % | ±% | |
|---|---|---|---|---|---|
| Labour | 225 | 37.6 | −14.9 | ||
| Conservative | 187 | 31.3 | −6.1 | ||
| Liberal Democrats | 186 | 31.1 | +21.0 | ||
| Majority | 38 | 6.3 | |||
| Turnout | 598 | 38.1 | |||
| Labour hold | Swing | ||||
| Party | Candidate | Votes | % | ±% | |
|---|---|---|---|---|---|
| Conservative | 852 | 43.3 | −2.3 | ||
| Labour | 700 | 35.6 | −1.0 | ||
| Liberal Democrats | 416 | 21.1 | +3.3 | ||
| Majority | 152 | 7.7 | |||
| Turnout | 1,968 | ||||
| Conservative hold | Swing | ||||
| Party | Candidate | Votes | % | ±% | |
|---|---|---|---|---|---|
| Conservative | 1,575 | 52.5 | −12.2 | ||
| Labour | 1,423 | 47.5 | +12.2 | ||
| Majority | 152 | 5.0 | |||
| Turnout | 2,998 | ||||
| Conservative hold | Swing | ||||
| Party | Candidate | Votes | % | ±% | |
|---|---|---|---|---|---|
| Conservative | Karl Coles | 298 | 45.2 | +7.3 | |
| Liberal Democrats | Jeannine Songhurst | 265 | 40.2 | +28.9 | |
| Labour | Michael Bounds | 96 | 14.6 | −0.9 | |
| Majority | 33 | 5.0 | |||
| Turnout | 659 | 17.9 | |||
| Conservative hold | Swing | ||||
| Party | Candidate | Votes | % | ±% | |
|---|---|---|---|---|---|
| Liberal Democrats | Christine Merrill | 701 | 52.0 | −17.1 | |
| Conservative | Nadina Kalsi | 311 | 23.1 | −7.8 | |
| Labour | Alan Methven | 243 | 18.0 | +18.0 | |
| BNP | Gary Reynolds | 94 | 7.0 | +7.0 | |
| Majority | 390 | 28.9 | |||
| Turnout | 1,349 | ||||
| Liberal Democrats hold | Swing | ||||
| Party | Candidate | Votes | % | ±% | |
|---|---|---|---|---|---|
| Liberal Democrats | Antony Moseley | 381 | 44.0 | −21.0 | |
| Conservative | Marian Broomhead | 264 | 30.5 | −4.5 | |
| Labour | Inga Windley | 153 | 17.7 | +17.7 | |
| BNP | Peter Jarvis | 68 | 7.9 | +7.9 | |
| Majority | 117 | 13.5 | |||
| Turnout | 866 | ||||
| Liberal Democrats hold | Swing | ||||
| Party | Candidate | Votes | % | ±% | |
|---|---|---|---|---|---|
| Labour | Sam Maxwell | 1,083 | 68.4 | +7.8 | |
| Conservative | Michael Potter | 501 | 31.6 | −7.8 | |
| Majority | 582 | 36.7 | |||
| Turnout | 1,584 | ||||
| Labour hold | Swing | ||||
| Party | Candidate | Votes | % | ±% | |
|---|---|---|---|---|---|
| Conservative | Michael Potter | 442 | 61.1 | −8.4 | |
| Labour | Ann Malthouse | 281 | 38.9 | +8.4 | |
| Majority | 161 | 22.3 | |||
| Turnout | 723 | ||||
| Conservative hold | Swing | ||||
| Party | Candidate | Votes | % | ±% | |
|---|---|---|---|---|---|
| Conservative | Mike Shirley | 1,651 | 62.0 | −7.0 | |
| Liberal Democrats | Luke Cousin | 552 | 20.7 | +20.7 | |
| Labour | Courtney Stephenson | 265 | 9.9 | −21.1 | |
| Green | Nick Cox | 197 | 7.4 | +7.4 | |
| Majority | 1,099 | 41.2 | |||
| Turnout | 2,665 | ||||
| Conservative hold | Swing | ||||
| Party | Candidate | Votes | % | ±% | |
|---|---|---|---|---|---|
| Liberal Democrats | Ande Savage | 438 | 60.5 | ||
| Conservative | Shane Blackwell | 141 | 19.5 | ||
| Labour | Laura Badland | 102 | 14.1 | ||
| Green | Mike Jelfs | 43 | 5.9 | ||
| Majority | 297 | 41.0 | |||
| Turnout | 724 | ||||
| Liberal Democrats hold | Swing | ||||
| Party | Candidate | Votes | % | ±% | |
|---|---|---|---|---|---|
| Reform UK | John Bloxham | 571 | 43.2 | ||
| Liberal Democrats | Yashmeet Bhamra | 460 | 34.8 | ||
| Conservative | Shane Blackwell | 145 | 11.0 | ||
| Labour | Anna Parrish | 77 | 5.8 | ||
| Green | Eleanor Turner | 70 | 5.3 | ||
| Majority | 111 | 8.4 | |||
| Turnout | 1,323 | ||||
| Reform UK gain from Liberal Democrats | Swing | ||||