2013 Leicestershire County Council election

Last updated

2013 Leicestershire County Council election
Flag of England.svg
  2009 2 May 2013 2017  

All 55 seats to Leicestershire County Council
28 seats needed for a majority
 First partySecond party
 
Party Conservative Liberal Democrats
Seats won3013
Seat changeDecrease2.svg 6Decrease2.svg 1
SwingDecrease2.svg 4.9Decrease2.svg 7.9

 Third partyFourth party
 
Party Labour UKIP
Seats won102
Seat changeIncrease2.svg 6Increase2.svg 2
SwingIncrease2.svg 8.8N/A

Leicestershire UK local election 2013 map.svg
Map showing the results of the 2013 Leicestershire County Council elections.

Council control before election

Conservative

Council control after election

Conservative

An election to Leicestershire County Council took place on 2 May 2013 as part of the 2013 United Kingdom local elections. 55 councillors were elected from 52 electoral divisions, which returned either one or two county councillors each by first-past-the-post voting for a four-year term of office. The Conservatives held control of the council with a reduced majority of 5 seats. Despite a strong challenge from UKIP, the party only gained 2 seats (including one where the sitting Conservative councillor had previously defected to UKIP) whilst the Liberal Democrats lost one seat and Labour recouped some of their 2009 losses, gaining 6 seats. [1]

Contents

All locally registered electors (British, Irish, Commonwealth and European Union citizens) who were aged 18 or over on Thursday 2 May 2013 were entitled to vote in the local elections. Those who were temporarily away from their ordinary address (for example, away working, on holiday, in student accommodation or in hospital) were also entitled to vote in the local elections, [2] although those who had moved abroad and registered as overseas electors cannot vote in the local elections. It is possible to register to vote at more than one address (such as a university student who had a term-time address and lives at home during holidays) at the discretion of the local Electoral Register Office, but it remains an offence to vote more than once in the same local government election. [3]

Results

Leicestershire County Council election, 2013
PartySeatsGainsLossesNet gain/lossSeats %Votes %Votes+/−
  Conservative 3017−654.639.566,687−4.9
  Liberal Democrats 1301−123.619.232,496−7.9
  Labour 1060+618.224.341,145+8.8
  UKIP 220+23.613.422,722New
  Independent 000±002.13,563+1.2
  BNP 001−100.91,542−11.2
  TUSC 000±000.3478New
  British Democratic 000±000.3421New

Results by electoral division

Results for individual divisions are shown below. [4] They have been divided into their respective Districts or Boroughs and listed alphabetically.

District of Blaby

(8 seats, 8 Electoral Divisions)

Blaby District Summary Result
PartySeatsGainsLossesNet gain/lossSeats %Votes %Votes+/−
  Conservative 501−162.547.69,429−0.3
  Labour 100±012.530.96,120+15.5
  Liberal Democrats 100±012.514.22,812−7.6
  UKIP 110+112.54.4881N/A
  Independent 000±00.02.5492N/A
  BNP 000±00.00.476−14.5
Blaby and Glen Parva (1 seat)
PartyCandidateVotes%±%
Liberal Democrats Geoff Welsh1,63863.0+8.9
Conservative Tony Greenwood65325.1−1.6
Labour Shabbir Aslam30811.9+5.3
Turnout 2,59927.7−11.0
Liberal Democrats hold Swing +5.3
Braunstone Town (1 seat)
PartyCandidateVotes%±%
Labour Jo Fox1,35661.1+23.4
Conservative Les Phillimore86438.9+6.4
Turnout 2,22026.0−12.3
Labour hold Swing +8.5
Cosby and Countesthorpe (1 seat)
PartyCandidateVotes%±%
Conservative David Jennings1,50555.5−2.4
Labour Mike Howkins73927.2+13.7
Liberal Democrats Mick Munn47017.3+0.8
Turnout 2,71429.1−11.3
Conservative hold Swing −8.1
Enderby Meridian (1 seat)
PartyCandidateVotes%±%
Conservative Jackie Dickinson84839.5−13.9
Labour Amanda Hack80937.6+12.7
Independent Brian Coleman49222.9N/A
Turnout 2,14922.4−9.8
Conservative hold Swing −13.3
Glenfields (1 seat)
PartyCandidateVotes%±%
UKIP Lynton Yates88135.2N/A
Conservative Lee Breckon81532.5−7.4
Liberal Democrats John Springthorpe44817.9−19.1
Labour Glenn Thurlby28511.4+4.5
BNP Peter Cheeseman763.0−13.1
Turnout 2,50531.6−8.6
UKIP gain from Conservative Swing −21.6
Kirby Muxloe and Leicester Forest East (1 seat)
PartyCandidateVotes%±%
Conservative Richard Blunt1,48457.0−2.2
Labour Malcolm Fox1,11843.0+29.0
Turnout 2,60229.5−11.2
Conservative hold Swing −15.6
Narborough and Whetstone (1 seat)
PartyCandidateVotes%±%
Conservative Karl Coles1,45859.3+4.9
Labour Michael Bounds74630.3+16.9
Liberal Democrats Bev Welsh25610.4−7.0
Turnout 2,46023.4−11.7
Conservative hold Swing −6.0
Stanton, Croft and Normanton (1 seat)
PartyCandidateVotes%±%
Conservative Ernie White1,80270.4+13.2
Labour Steve Crane75929.6+20.0
Turnout 2,56126.3−14.2
Conservative hold Swing −3.4

Borough of Charnwood

(14 seats, 14 Electoral Divisions)

Charnwood Borough Summary Result
PartySeatsGainsLossesNet gain/lossSeats %Votes %Votes+/−
  Conservative 912−164.342.215,741−1.2
  Labour 520+235.736.013,405+14.3
  UKIP 000±00.08.23,067N/A
  Liberal Democrats 001−10.07.12,641−11.6
  BNP 000±00.03.91,466−11.0
  Independent 000±00.01.5556+0.2
  TUSC 000±00.00.6230N/A
  British Democratic 000±00.00.5206N/A
Birstall (1 seat)
PartyCandidateVotes%±%
Conservative Iain Bentley1,15237.8+2.1
Liberal Democrats Simon Sansome97532.0−4.9
Labour Marion Smith65921.6+10.1
BNP Ken Tilson2588.5−7.4
Turnout 3,04429.5−12.9
Conservative gain from Liberal Democrats Swing +3.5
Bradgate (1 seat)
PartyCandidateVotes%±%
Conservative David Snartt2,02364.3+6.4
Labour Glyn McAllister58018.4N/A
BNP Jim Taylor2979.4−3.2
Liberal Democrats Christine Bilby2477.8−21.7
Turnout 3,14731.6−12.9
Conservative hold Swing −6.0
Loughborough East (1 seat)
PartyCandidateVotes%±%
Labour Jewel Miah1,63467.3+18.5
Conservative Judith Spence49620.4−0.2
TUSC Lauren Foster1707.0N/A
Liberal Democrats Mike Willis1285.3−12.2
Turnout 2,42825.2−9.8
Labour hold Swing +9.4
Loughborough North (1 seat)
PartyCandidateVotes%±%
Labour Betty Newton1,58865.2+25.1
Conservative Jenny Bokor72929.9−1.5
Liberal Democrats Robin Popley1204.9−8.2
Turnout 2,43723.8−9.4
Labour hold Swing +13.3
Loughborough North West (1 seat)
PartyCandidateVotes%±%
Labour Max Hunt1,16454.3+10.3
Independent Roy Campsall55625.9+6.4
Conservative Ron Jukes36216.9−10.7
Liberal Democrats Simon Atkins622.9N/A
Turnout 2,14420.7−12.3
Labour hold Swing +2.0
Loughborough South (1 seat)
PartyCandidateVotes%±%
Labour Robert Sharp1,44951.8+16.4
Conservative David Slater92132.9−3.2
British Democratic Kevin Stafford2067.4N/A
Liberal Democrats Diana Brass1625.8−10.3
TUSC Tony Onions602.1N/A
Turnout 2,79824.6−7.9
Labour gain from Conservative Swing +9.8
Loughborough South West (1 seat)
PartyCandidateVotes%±%
Conservative Peter Lewis1,51254.5+4.2
Labour Mike Cahill1,04637.7+21.8
Liberal Democrats David Scott2147.7−19.0
Turnout 2,77232.4−9.8
Conservative hold Swing −8.8
Quorn and Barrow (1 seat)
PartyCandidateVotes%±%
Conservative Tony Kershaw1,38545.9−7.4
Labour Alice Brennan88029.2+12.6
UKIP Andrew McWilliam60720.1N/A
Liberal Democrats Stephen Coltman1454.8−13.0
Turnout 3,01731.2−11.0
Conservative hold Swing −10.0
Rothley and Mountsorrel (1 seat)
PartyCandidateVotes%±%
Conservative Peter Osborne1,30847.9−3.8
UKIP Jamie Bye73026.7N/A
Labour Sarah Maynard69525.4+13.2
Turnout 2,73327.9−10.8
Conservative hold Swing −15.3
Shepshed (1 seat)
PartyCandidateVotes%±%
Conservative Christine Radford1,26236.0+3.1
Labour Claire Poole1,17933.7+8.5
UKIP Alexis Hira68519.6N/A
Liberal Democrats Diane Horn37510.7−13.8
Turnout 3,50132.1−9.1
Conservative hold Swing −2.7
Sileby and the Wolds (1 seat)
PartyCandidateVotes%±%
Conservative Richard Shepherd1,39660.5+8.4
Labour Gous Ali49221.3+8.8
Liberal Democrats Ian Sharpe2139.2−11.8
BNP Maurice Oatley2058.9−5.5
Turnout 2,30626.7−13.6
Conservative hold Swing −0.2
Syston Fosse (1 seat)
PartyCandidateVotes%±%
Conservative Dave Houseman1,07047.3−9.0
UKIP Ronald Jenkins47621.1N/A
Labour Stephen Rose45720.2+2.2
BNP Cathy Duffy25811.4−14.2
Turnout 2,26126.5−9.7
Conservative hold Swing −15.1
Syston Ridgeway (1 seat)
PartyCandidateVotes%±%
Conservative Stephen Hampson1,15447.7−4.9
UKIP Chris Scotton56923.5N/A
Labour Michael McLoughlin48820.2+9.6
BNP Stephen Denham2068.5−10.9
Turnout 2,41728.1−11.6
Conservative hold Swing −14.2
Thurmaston (1 seat)
PartyCandidateVotes%±%
Labour Kate Knaggs1,09447.4+25.5
Conservative Paul Harley97142.1−6.8
BNP Robin Derrick24210.5−9.1
Turnout 2,30730.0−6.9
Labour gain from Conservative Swing +16.2

District of Harborough

(7 seats, 7 Electoral Divisions)

Harborough District Summary Result
PartySeatsGainsLossesNet gain/lossSeats %Votes %Votes+/−
  Conservative 500±071.444.89,808−10.8
  Liberal Democrats 200±028.623.15,056−4.4
  Labour 000±00.015.13,296+4.6
  UKIP 000±00.014.63,193N/A
  Independent 000±00.02.4518+0.8
Broughton Astley (1 seat)
PartyCandidateVotes%±%
Conservative Bill Liquorish1,54468.7−12.4
Labour Sandra Parkinson52123.2+4.3
Liberal Democrats Antony Moseley1838.1N/A
Turnout 2,24826.3−8.9
Conservative hold Swing −8.4
Bruntingthorpe (1 seat)
PartyCandidateVotes%±%
Conservative Graham Hart1,55550.5−15.7
UKIP Tim Johnson72323.5N/A
Labour Elaine Carter57218.6+7.8
Liberal Democrats Kevin Loydall2297.4−15.6
Turnout 3,07931.9−9.1
Conservative hold Swing −19.6
Gartree (1 seat)
PartyCandidateVotes%±%
Conservative Kevin Feltham1,93754.6−17.1
UKIP Brett Lynes88825.0N/A
Labour Peter Craig47113.3+7.4
Liberal Democrats Grahame Hudson2537.1−15.3
Turnout 3,54933.8−9.0
Conservative hold Swing −21.1
Launde (1 seat)
PartyCandidateVotes%±%
Liberal Democrats Simon Galton1,98958.6+3.9
Conservative Simon Whelband1,13433.4−2.2
Labour Ian Snaith2728.0+4.2
Turnout 3,39537.4−12.6
Liberal Democrats hold Swing +3.1
Lutterworth (1 seat)
PartyCandidateVotes%±%
Conservative Rosita Page1,52554.4−5.3
Labour David Gair75827.1+0.1
Independent Martin Sears51818.5N/A
Turnout 2,80131.6−9.2
Conservative hold Swing −2.7
Market Harborough East (1 seat)
PartyCandidateVotes%±%
Liberal Democrats Sarah Hill1,25238.2−1.3
Conservative Phil King94528.8−9.9
UKIP Michael Gerard77723.7N/A
Labour Co-op Carol Wood3049.3+3.8
Turnout 3,27834.9−5.7
Liberal Democrats hold Swing +4.3
Market Harborough West and Foxton (1 seat)
PartyCandidateVotes%±%
Conservative Blake Pain1,16833.2−9.4
Liberal Democrats Phil Knowles1,15032.7−9.7
UKIP Robert Davison80522.9N/A
Labour Anne Pridmore39811.3+5.7
Turnout 3,52134.8−3.0
Conservative hold Swing +0.2

Borough of Hinckley and Bosworth

(9 seats, 7 Electoral Divisions)

Hinckley and Bosworth Borough Summary Result
PartySeatsGainsLossesNet gain/lossSeats %Votes %Votes+/−
  Conservative 401−144.437.813,568−4.0
  Liberal Democrats 400±044.431.811,432−5.1
  UKIP 110+111.215.15,437N/A
  Labour 000±00.014.55,217+4.0
  TUSC 000±00.00.7248N/A
Burbage Castle (2 seats)
PartyCandidateVotes%±%
Liberal Democrats Stuart Bray2,33823.0−1.5
Liberal Democrats Keith Lynch2,33823.0−1.3
Conservative Amanda Wright2,15221.2+2.3
Conservative Peter Wallace2,11320.8+2.4
Labour David Hodgen5365.3−0.7
Labour Tony Simhani4414.3+1.3
TUSC Michael Clifford2482.4N/A
Turnout 5,08330.1−6.1
Liberal Democrats hold Swing
Division Summary
PartyVotes% Votes±%SeatsChange
Liberal Democrats 4,67646.0−2.82
Conservative 4,26542.0+4.90
Labour 9779.6+0.60
TUSC 2482.4N/A0
Total Votes Cast10,166
Earl Shilton (1 seat)
PartyCandidateVotes%±%
Conservative Janice Richards91835.3−3.5
Labour Denis Bown84832.6+5.7
UKIP Derek Marvin65525.2N/A
Liberal Democrats Mathew Hulbert1786.8−8.2
Turnout 2,59926.7−10.2
Conservative hold Swing −4.6
Groby and Ratby (1 seat)
PartyCandidateVotes%±%
Conservative Ozzy O'Shea1,45952.6−4.2
UKIP Rob Fraser57320.6N/A
Liberal Democrats Ted Hollick41815.1+3.2
Labour Terry Gallagher32611.7−3.6
Turnout 2,77630.7−7.5
Conservative hold Swing −12.4
Hinckley (2 seats)
PartyCandidateVotes%±%
Liberal Democrats David Bill2,37823.9−2.9
Liberal Democrats Michael Mullaney2,03620.5−3.2
UKIP Gary Cart1,40414.1N/A
Conservative Alan Ottey1,38814.0−4.7
Conservative Rosemary Wright1,36813.8−2.5
Labour Clark Mitchell6967.0+2.7
Labour Eamonn Gabriel6756.8+3.7
Turnout 4,97325.1−5.2
Liberal Democrats hold Swing
Division Summary
PartyVotes% Votes±%SeatsChange
Liberal Democrats 4,41444.4−6.12
Conservative 2,75627.7−7.30
UKIP 1,40414.1N/A0
Labour 1,37113.8+6.50
Total Votes Cast9,945
Mallory (1 seat)
PartyCandidateVotes%±%
Conservative Ruth Camamile83732.4−0.7
UKIP Gordon Davis79931.0N/A
Liberal Democrats Joyce Crooks48618.8−13.0
Labour Co-op Andre Wheeler45917.8+9.1
Turnout 2,58128.8−7.1
Conservative hold Swing −15.9
Market Bosworth (1 seat)
PartyCandidateVotes%±%
Conservative Ivan Ould2,10849.6−5.9
Liberal Democrats Bill Crooks99623.5−5.1
UKIP Aaron Yates71416.8N/A
Labour Steven Malcherczyk42810.1+3.5
Turnout 4,24639.4−8.5
Conservative hold Swing −0.4
Markfield, Desford and Thornton (1 seat)
PartyCandidateVotes%±%
UKIP David Sprason1,29236.0N/A
Conservative Peter Bedford1,22534.1−21.6
Labour Tom Neilson80822.5+9.4
Liberal Democrats Dianne Finney2647.4−8.5
Turnout 3,58936.6−5.9
UKIP gain from Conservative Swing +28.8

Borough of Melton

(4 seats, 4 Electoral Divisions)

Melton Borough Summary Result
PartySeatsGainsLossesNet gain/lossSeats %Votes %Votes+/−
  Conservative 400±0100.050.65,787−2.1
  Labour 000±00.020.22,313+3.4
  UKIP 000±00.014.91,702N/A
  Independent 000±00.014.31,630+11.9
Asfordby (1 seat)
PartyCandidateVotes%±%
Conservative Joe Orson1,98579.2+19.7
Labour Mike Brown52020.8+9.2
Turnout 2,50529.1−13.4
Conservative hold Swing +5.3
Belvoir (1 seat)
PartyCandidateVotes%±%
Conservative Byron Rhodes1,58547.2−13.7
UKIP Chris Hardcastle67320.0N/A
Independent Elaine Holmes65819.6N/A
Labour Lin Machin44313.2+3.4
Turnout 3,35933.2−11.0
Conservative hold Swing −16.9
Melton North (1 seat)
PartyCandidateVotes%±%
Conservative Pam Posnett1,35941.7−1.9
Labour Trev Moncrieff73722.6−8.4
Independent Mark Twittey61718.9N/A
UKIP Malcolm Staples54816.8N/A
Turnout 3,26130.1−6.8
Conservative hold Swing +3.3
Melton South (1 seat)
PartyCandidateVotes%±%
Conservative Alan Pearson84836.9−7.2
Labour Gary Bush61326.7+11.9
UKIP Duncan Shelley48120.9N/A
Independent Alison Freer-Jones2028.8N/A
Independent Marilyn Gordon1536.7N/A
Turnout 2,29724.4−6.1
Conservative hold Swing −9.6

District of North West Leicestershire

(8 seats, 8 Electoral Divisions)

North West Leicestershire District Summary Result
PartySeatsGainsLossesNet gain/lossSeats %Votes %Votes+/−
  Labour 440+450.034.87,993+14.3
  Conservative 303−337.530.87,088−10.2
  Liberal Democrats 100±012.58.82,034−8.9
  UKIP 000±00.024.35,584N/A
  British Democratic 000±00.00.9215N/A
  Independent 000±00.00.495−1.8
Ashby de la Zouch (1 seat)
PartyCandidateVotes%±%
Conservative John Coxon1,46344.6−5.3
Labour Co-op Josh Mills1,03131.5+13.5
UKIP Jakob Whiten62319.0N/A
Liberal Democrats Maureen Wyatt1614.9−17.9
Turnout 3,27833.4−10.1
Conservative hold Swing −9.4
Castle Donington (1 seat)
PartyCandidateVotes%±%
Conservative Trevor Pendleton1,09540.0−17.7
Labour Patrick Lynch78028.5+10.5
UKIP John Scutter72626.5N/A
Liberal Democrats Kostijn Van Ginkel1385.0−8.2
Turnout 2,73929.2−12.5
Conservative hold Swing −14.1
Coalville (1 seat)
PartyCandidateVotes%±%
Labour Terri Eynon1,29444.7+22.3
UKIP Phil Holland82528.5N/A
Conservative John Cotterill47616.4−9.0
British Democratic Graham Partner ^2157.4−20.3
Liberal Democrats Lee Windram842.9−5.8
Turnout 2,89428.2−10.4
Labour gain from BNP Swing −3.1

^ The sitting councillor Graham Partner had previously defected from the BNP to the newly formed British Democratic Party and so his vote share changes reflect the result he achieved in 2009.

Forest and Measham (1 seat)
PartyCandidateVotes%±%
Labour Co-op Sean Sheahan1,11340.3+12.6
UKIP Martin Green84330.5N/A
Conservative Geraint Jones73726.7−11.7
Liberal Democrats Daniel Bowler722.6−11.9
Turnout 2,76528.0−15.4
Labour Co-op gain from Conservative Swing −9.0
Ibstock and Appleby (1 seat)
PartyCandidateVotes%±%
Labour Heather Worman1,08940.0+18.3
Conservative Nigel Smith84931.2−8.9
UKIP Peter Depper63723.3N/A
Liberal Democrats David Wyatt1465.4−6.8
Turnout 2,72128.2−15.9
Labour gain from Conservative Swing +13.6
Valley (1 seat)
PartyCandidateVotes%±%
Conservative Nicholas Rushton1,26046.1−8.0
UKIP Val Pulford80329.4N/A
Labour Mary Draycott53019.4+6.5
Liberal Democrats Alan Turner1385.1−15.1
Turnout 2,73135.9−13.9
Conservative hold Swing −18.7
Warren Hills (1 seat)
PartyCandidateVotes%±%
Liberal Democrats Michael Wyatt1,18746.3+3.0
Labour Co-op Dave De Lacy71728.0+12.3
UKIP Chris Argent31912.4N/A
Conservative Paula Purver30311.8−11.4
Independent James Collins371.4−1.7
Turnout 2,56333.0−9.5
Liberal Democrats hold Swing −4.7
Whitwick (1 seat)
PartyCandidateVotes%±%
Labour Co-op Leon Spence1,43943.4+17.6
Conservative Tony Gillard90527.3−9.7
UKIP Tim Pulford80824.4N/A
Liberal Democrats David Siddon1083.3−7.7
Independent Mandy Jarvis581.7N/A
Turnout 3,31836.4−10.6
Labour Co-op gain from Conservative Swing +13.7

Borough of Oadby and Wigston

(5 seats, 4 Electoral Divisions)

Oadby and Wigston Borough Summary Result
PartySeatsGainsLossesNet gain/lossSeats %Votes %Votes+/−
  Liberal Democrats 500±0100.043.78,521−8.7
  Conservative 000±00.027.15,276−5.7
  Labour 000±00.014.42,801+4.8
  UKIP 000±00.013.52,628N/A
  Independent 000±00.01.4272N/A
Oadby (2 seats)
PartyCandidateVotes%±%
Liberal Democrats Dean Gamble2,52621.4−4.5
Liberal Democrats Jeffrey Kaufman2,38020.1−4.7
Conservative Bhupendra Dave2,03717.2−0.3
Conservative Rani Mahal1,80415.3−2.1
UKIP Daniel Price1,0118.6N/A
Labour Valerie Jones9037.6+1.3
Labour Camille Naylor8867.5+2.2
Independent Gabriella Garcia2722.3N/A
Turnout 5,91030.6−7.9
Liberal Democrats hold Swing
Division Summary
PartyVotes% Votes±%SeatsChange
Liberal Democrats 4,90641.5−9.22
Conservative 3,84132.5−2.40
Labour 1,78915.1+3.50
UKIP 1,0118.6N/A0
Independent 2722.3N/A0
Total Votes Cast11,819
Wigston Bushloe (1 seat)
PartyCandidateVotes%±%
Liberal Democrats Michael Charlesworth1,41644.3−14.0
UKIP Harry Jahangir76023.8N/A
Conservative Andrew Southerden71022.2−14.0
Labour Maureen Waugh3149.8+4.3
Turnout 3,20033.4−6.2
Liberal Democrats hold Swing −18.9
Wigston Poplars (1 seat)
PartyCandidateVotes%±%
Liberal Democrats Helen Loydall1,22145.1−3.6
UKIP Richard Billington62623.1N/A
Conservative David Beaumont47017.3−14.3
Labour Susan Howard39314.5+5.7
Turnout 2,71032.6−7.7
Liberal Democrats hold Swing −13.4
Wigston South (1 seat)
PartyCandidateVotes%±%
Liberal Democrats Bill Boulter97848.9−8.4
UKIP Clive Langley46123.1N/A
Labour Richard Price30515.3+9.8
Conservative Anne Bond25512.8−5.5
Turnout 1,99924.6−8.8
Liberal Democrats hold Swing −15.8

Related Research Articles

<span class="mw-page-title-main">2009 Cornwall Council election</span>

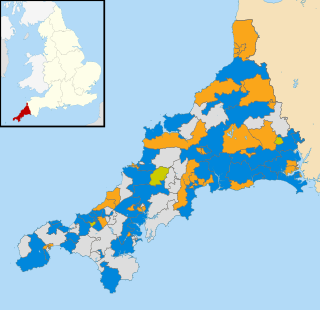
The Cornwall Council election, 2009, was an election for all 123 seats on the council. Cornwall Council is a unitary authority that covers the majority of the ceremonial county of Cornwall, with the exception of the Isles of Scilly which have an independent local authority. The elections took place concurrently with other local elections across England and Wales as well as the UK component of the elections to the European Parliament. Cornwall had seen its district and county councils abolished, replaced by a single 123-member Cornish unitary authority, for which councillors were elected for a full term.

<span class="mw-page-title-main">2009 Cambridgeshire County Council election</span>

An election to Cambridgeshire County Council took place on 4 June 2009 as part of the 2009 United Kingdom local elections. The election was delayed from 7 May to coincide with elections to the European Parliament. 69 councillors were elected from 60 electoral divisions, which returned either one or two county councillors each by first-past-the-post voting. The Conservative Party retained their majority on the council, while the Green Party and UKIP gained their first seats.

<span class="mw-page-title-main">2009 Staffordshire County Council election</span> 2009 UK local government election

Elections to Staffordshire County Council took place on 4 June 2009 as part of the 2009 United Kingdom local elections, having been delayed from 7 May, in order to coincide with elections to the European Parliament. 62 councillors were elected from the various electoral divisions, which returned either one or two county councillors each by first-past-the-post voting for a four-year term of office. The electoral divisions were the same as those used at the previous election in 2005. The council continues to be administered on the Leader and Cabinet model.

<span class="mw-page-title-main">2012 City of Lincoln Council election</span> UK municipal election

The 2012 City of Lincoln Council election took place on 3 May 2012 to elect one-third of the members of City of Lincoln Council in Lincolnshire, England, for a 4-year term of office. This was on the same day as other 2012 United Kingdom local elections.

<span class="mw-page-title-main">2013 Derbyshire County Council election</span>

An election to Derbyshire County Council took place on 2 May 2013 as part of the 2013 United Kingdom local elections. Following the final draft of the 2012 electoral review, 64 councillors were elected from 61 electoral divisions which returned either one or two county councillors each by first-past-the-post voting for a four-year term of office. No elections were held in the City of Derby, which is a unitary authority outside the area covered by the County Council. The Labour Party won back control of the council by a landslide victory, taking forty-two of the authority's sixty-four seats.

<span class="mw-page-title-main">2013 North Yorkshire County Council election</span>

An election to North Yorkshire County Council took place on 2 May 2013 as part of the 2013 United Kingdom local elections. 72 councillors were elected from 68 electoral divisions, which returned either one or two county councillors each by first-past-the-post voting for a four-year term of office. The four divisions which elected two members were Harrogate Bilton & Nidd Gorge, Harrogate Central, Knaresborough, and Selby Barlby. Of those seats UKIP won its first ever seats on the council in Bilton and Nidd Gorge. The electoral divisions were the same as those used at the previous election in 2009. The election saw the Conservative Party maintain overall control of the council.

<span class="mw-page-title-main">2013 West Sussex County Council election</span>

The West Sussex County Council election, 2013 took place on 2 May 2013, as part of the 2013 United Kingdom local elections. All 71 electoral divisions were up for election, which returned one county councillor each by first-past-the-post voting for a four-year term of office. At this election, the Conservative Party was seeking to retain overall control of the council, and the Liberal Democrats to maintain their position as the main opposition party.

<span class="mw-page-title-main">2013 East Sussex County Council election</span>

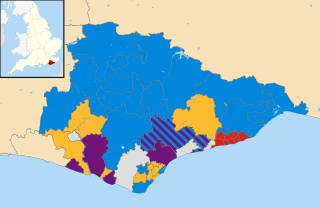
The East Sussex County Council election, 2013 took place on 2 May 2013 as part of the 2013 United Kingdom local elections. All 49 councillors of East Sussex County Council were elected from 44 electoral divisions, which return either one or two councillors each by first-past-the-post voting for a four-year term of office. The electoral divisions were the same as those used at the previous election in 2009. No elections were held in Brighton and Hove, which is a unitary authority outside the area covered by the County Council.

<span class="mw-page-title-main">2013 Hampshire County Council election</span>

An election to Hampshire County Council took place on 2 May 2013 as part of the 2013 United Kingdom local elections. 78 councillors were elected from 75 electoral divisions, which returned either one or two county councillors each by first-past-the-post voting for a four-year term of office. The electoral divisions were the same as those of the previous election in 2009. No elections were held in Portsmouth and Southampton, which are unitary authorities outside the area covered by the County Council. The election saw the Conservative Party retain overall control of the council, with a reduced majority of five councillors.

<span class="mw-page-title-main">2013 Worcestershire County Council election</span>

An election to Worcestershire County Council took place on 2 May 2013 as part of the 2013 United Kingdom local elections. 57 councillors were elected from 53 electoral divisions, which returned either one or two county councillors each by first-past-the-post voting for a four-year term of office. The divisions were the same as those used at the previous election in 2009. The election saw the Conservative Party retain overall control of the council with a significantly reduced majority of just 2 seats.

<span class="mw-page-title-main">2013 Lincolnshire County Council election</span>

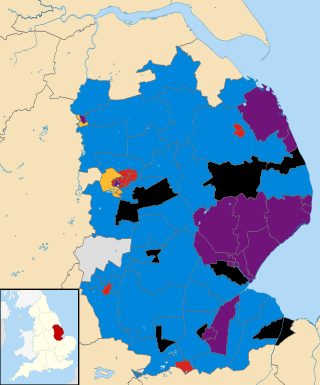
An election to Lincolnshire County Council took place on 2 May 2013 as part of the 2013 United Kingdom local elections. 77 electoral divisions returned one county councillor each by first-past-the-post voting for a four-year term of office. The electoral divisions were the same as those used at the previous election in 2009. No elections were held in North Lincolnshire or North East Lincolnshire, which are unitary authorities outside the area covered by the County Council.

<span class="mw-page-title-main">2013 Surrey County Council election</span>

The Surrey County Council election, 2013 took place on 2 May 2013 as part of the 2013 United Kingdom local elections. 81 electoral divisions returned one county councillor each by first-past-the-post voting for a four-year term of office. Following a review, new electoral division boundaries were introduced for this election, increasing the number of councillors from 80 to 81.

<span class="mw-page-title-main">2013 Gloucestershire County Council election</span>

Elections to Gloucestershire County Council took place on 2 May 2013 as part of the 2013 United Kingdom local elections. 53 electoral divisions elected one county councillor each by first-past-the-post voting for a four-year term of office. No elections were held in South Gloucestershire, which is a unitary authority outside the area covered by the County Council.

<span class="mw-page-title-main">2013 Essex County Council election</span> 2013 UK local government election

An election to Essex County Council took place on 2 May 2013 as part of the 2013 United Kingdom local elections. 75 councillors were elected from 70 electoral divisions, which returned either one or two county councillors each by first-past-the-post voting for a four-year term of office. The electoral divisions were the same as those used at the previous election in 2009. No elections were held in Thurrock or Southend-on-Sea, which are unitary authorities outside the area covered by the County Council.

<span class="mw-page-title-main">2013 Staffordshire County Council election</span> UK local elections

An election to Staffordshire County Council took place on 2 May 2013 as part of the 2013 United Kingdom local elections. 62 electoral divisions returned one county councillor each by first-past-the-post voting for a four-year term of office. Following a boundary review, new electoral division boundaries were established for this election. No elections were held in Stoke-on-Trent, which is a unitary authority outside the area covered by the County Council. The council continues to be administered on the Leader and Cabinet model.

<span class="mw-page-title-main">2013 Dorset County Council election</span>

An election to Dorset County Council took place on 2 May 2013 as part of the United Kingdom local elections. 45 councillors were elected from 42 electoral divisions, which returned either one or two county councillors each by first-past-the-post voting for a four-year term of office. The electoral divisions were the same as those used at the previous election in 2009. No elections were held in Bournemouth or Poole, which are unitary authorities outside the area covered by the County Council. The election saw the Conservative Party maintain overall control of the council.

<span class="mw-page-title-main">2013 Suffolk County Council election</span> 2013 UK local government election

Elections to Suffolk County Council took place on 2 May 2013 as part of the 2013 United Kingdom local elections. 75 councillors were elected from 63 electoral divisions, which returned either one or two county councillors each by first-past-the-post voting for a four-year term of office. The electoral divisions were the same as those used at the previous election in 2009.

<span class="mw-page-title-main">2013 Northamptonshire County Council election</span>

An election to Northamptonshire County Council took place on 2 May 2013 as part of the 2013 United Kingdom local elections. Following a boundary review, the number of county councillors was reduced from 73 to 57 from this election. All members were elected by first-past-the-post voting from single-member electoral divisions for a four-year term of office. The Conservative Party held on to their overall majority, having held overall control of the council since 2005.

<span class="mw-page-title-main">2017 Gloucestershire County Council election</span>

The 2017 Gloucestershire County Council election took place on 4 May 2017 as part of the 2017 local elections in the United Kingdom. All 53 councillors were elected from electoral divisions which returned one county councillor each by first-past-the-post voting for a four-year term of office. Control of the council went from a Conservative Party minority to a majority administration.

<span class="mw-page-title-main">2017 Lincolnshire County Council election</span>

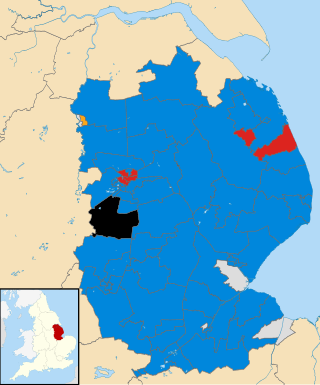
The 2017 Lincolnshire County Council election took place in non-metropolitan Lincolnshire on 4 May 2017 as part of the 2017 local elections in the United Kingdom. A total of 70 councillors were elected across the seven non-metropolitan districts that make up the administrative county of Lincolnshire from 70 single member electoral divisions by first-past-the-post voting for a four-year term of office. The election did not include North Lincolnshire and North East Lincolnshire as they are separate unitary authorities.

References

  1. Leicestershire County Council election, 2013 overall results, Leicestershire County Council website
  2. "The Representation of the People (Form of Canvass) (England and Wales) Regulations 2006, Schedule Part 1". Legislation.gov.uk. 13 October 2011. Retrieved 18 April 2012.
  3. "I have two homes. Can I register at both addresses?". The Electoral Commission. Archived from the original on 31 December 2013. Retrieved 5 January 2011.
  4. Leicestershire County Council election, 2013 ward results, Leicestershire County Council website