2013 East Sussex County Council election

Last updated

2013 East Sussex County Council election
  2009 2 May 2013 2017  

All 49 seats to East Sussex County Council
25 seats needed for a majority
 First partySecond party
 
Party Conservative Liberal Democrats
Seats won2010
Seat changeDecrease2.svg9Decrease2.svg3

 Third partyFourth party
 
Party UKIP Labour
Seats won77
Seat changeIncrease2.svg7Increase2.svg3

East Sussex UK local election 2013 map.svg
Map showing the results of the 2013 East Sussex County Council election. Striped electoral divisions have mixed representation.

Council control before election

Conservative

Council control after election

No Overall Control

The East Sussex County Council election, 2013 took place on 2 May 2013 as part of the 2013 United Kingdom local elections. All 49 councillors of East Sussex County Council were elected from 44 electoral divisions, which return either one or two councillors each by first-past-the-post voting for a four-year term of office. [1] The electoral divisions were the same as those used at the previous election in 2009. No elections were held in Brighton and Hove, which is a unitary authority outside the area covered by the County Council.

Contents

All locally registered electors (British, Irish, Commonwealth and European Union citizens) who were aged 18 or over on Thursday 2 May 2013 were entitled to vote in the local elections. Those who were temporarily away from their ordinary address (for example, away working, on holiday, in student accommodation or in hospital) were also entitled to vote in the local elections, [2] although those who had moved abroad and registered as overseas electors cannot vote in the local elections. It is possible to register to vote at more than one address (such as a university student who had a term-time address and lives at home during holidays) at the discretion of the local Electoral Register Office, but it remains an offence to vote more than once in the same local government election. [3]

Summary

At this election, the Conservative Party was seeking to retain overall control of the council, previously having a majority of four seats, and the Liberal Democrats to maintain or better their position of 13 seats.

The Conservatives were reduced to 20 seats on the 49-member council, producing no overall control. [4] UKIP made strong gains, winning 7 seats (their first ever seats on the council), and Labour also gained seats (its gain of three seats being wholly at the expense of Conservatives).[ citation needed ] The number of Independent members increased to 5. Overall, the Liberal Democrats lost three councillors.

Since the election the Conservatives have decided to form a minority administration. [5]

Election results

2013 East Sussex County Council election
PartySeatsGainsLossesNet gain/lossSeats %Votes %Votes+/−
  Conservative 20010Decrease2.svg1040.831.650,325Decrease2.svg8.3
  Liberal Democrats 1002Decrease2.svg220.414.823,538Decrease2.svg15.9
  UKIP 770Increase2.svg714.327.343,458Increase2.svg19.7
  Labour 730Increase2.svg314.314.422,962Increase2.svg0.3
  Independent 520Increase2.svg210.28.914,205Increase2.svg2.1
  Green 000Steady2.svg0.03.04,824Decrease2.svg2.2

Results by electoral division

East Sussex includes five districts: Eastbourne borough, Hastings borough, Lewes district, Rother district and Wealden district, and the results are grouped by those districts.

Eastbourne

Devonshire
PartyCandidateVotes%
Liberal Democrats Steve Wallis 893 39.3
UKIP Bob Lacey63828.1
Labour Gerry Stonestreet37316.4
Conservative Colin Murdoch32214.2
Independent Keith Gell482.1
Majority
Turnout 2,27427.0
Liberal Democrats hold
Hampden Park
PartyCandidateVotes%
Liberal Democrats Mike Blanch 859 39.8
UKIP Paul Brown60928.2
Conservative Simon Howe41519.2
Labour Paul Richards27712.8
Majority
Turnout 2,16029.1
Liberal Democrats hold
Langney
PartyCandidateVotes%
Liberal Democrats Alan Shuttleworth 1,090 48.6
UKIP Diane Kefallinos55724.8
Labour Lee Comfort29913.3
Conservative Gordon Jenkins29913.3
Majority
Turnout 2,24528.5
Liberal Democrats hold
Meads
PartyCandidateVotes%
Conservative Barry Taylor 1,261 41.0
UKIP Alan Thornton85527.8
Liberal Democrats Linda Beckmann51016.6
Labour Dennis Scard 2799.1
Green Dorothy Forsyth1695.5
Majority
Turnout 3,07438.1
Conservative hold
Old Town
PartyCandidateVotes%
Liberal Democrats John Ungar 1,457 42.9
Conservative Anne Angel1,05431.0
UKIP David Greaves61318.0
Labour Sarah Richards2758.1
Majority
Turnout 3,39940.6
Liberal Democrats hold
Ratton
PartyCandidateVotes%
Conservative Colin Belsey 1,224 40.7
UKIP Roger Stagnell88129.3
Liberal Democrats Neil Stanley55918.6
Labour Anne Grigg2217.4
Green Ann Sterenberg1214.0
Majority
Turnout 3,00638.7
Conservative hold
St Anthony's
PartyCandidateVotes%
Liberal Democrats David Tutt 1,304 48.6
UKIP Christine Woodley75728.2
Conservative Patrick Warner34913.0
Labour Ian Culshaw1997.4
Green Hugh Norris762.8
Majority
Turnout 2,68531.8
Liberal Democrats hold
Sovereign
PartyCandidateVotes%
Conservative David Elkin 1,086 39.2
UKIP Robert Harper93033.6
Liberal Democrats Steve Holt53119.2
Labour Richard Goude2228.0
Majority
Turnout 2,76929.9
Conservative hold
Upperton
PartyCandidateVotes%
Liberal Democrats Pat Rodohan 1,225 40.4
Conservative Tom Liddiard98132.4
UKIP Amanda Sheehan59119.5
Labour Matthew Quanstrom2357.8
Majority
Turnout 3,03237.5
Liberal Democrats hold

Hastings

Ashdown and Conquest
PartyCandidateVotes%
Conservative Peter Pragnell 1,061 40.0
UKIP Doug Thorogood84631.9
Labour Stuart Murphy61923.3
Liberal Democrats Paul Burton1284.8
Majority
Turnout 2,65430.5
Conservative hold
Baird and Ore
PartyCandidateVotes%
Labour Michael Wincott 872 39.2
Conservative Liam Atkins67030.1
UKIP Paul Willard53524.1
Green Will Davis783.5
Liberal Democrats Kate Tudgay683.1
Majority
Turnout 2,22330.4
Labour gain from Conservative
Braybrooke and Castle
PartyCandidateVotes%
Labour Godfrey Daniel 1,396 56.0
UKIP Jay Lavender39916.0
Conservative Matthew Lock32913.2
Green Maya Evans25510.2
Liberal Democrats Stewart Rayment1134.5
Majority
Turnout 2,49230.3
Labour hold
Central St Leonards and Gensing
PartyCandidateVotes%
Labour Trevor Webb 1,020 47.2
UKIP Michael McIver45220.9
Conservative John Waterfall34916.1
Green Maresa Bossano22810.5
Liberal Democrats Graham Hopgood1135.2
Majority
Turnout 2,16225.5
Labour hold
Hollington and Wishing Tree
PartyCandidateVotes%
Labour Phil Scott 1,152 53.1
UKIP Ken Pankhurst59627.5
Conservative Nigel Barry32214.8
Liberal Democrats Vanessa Burton994.6
Majority
Turnout 2.16926.0
Labour hold
Maze Hill and West St Leonards
PartyCandidateVotes%
Labour Kim Forward 861 35.6
Conservative Rob Lee79632.9
UKIP Markham Jary53222.0
Green Sarah Evans1305.4
Liberal Democrats Sue Tait1004.1
Majority
Turnout 2,41929.9
Labour gain from Conservative
Old Hastings and Tressell
PartyCandidateVotes%
Labour Jeremy Birch 1,076 49.2
UKIP Peter Wallace49222.5
Conservative Sally-Ann Hart34215.6
Green Sally Phillips1828.3
Liberal Democrats Christopher Dodwell974.4
Majority
Turnout 2,18927.8
Labour hold
St Helens and Silverhill
PartyCandidateVotes%
Labour John Hodges 1,206 40.8
Conservative Matthew Lock99033.5
UKIP Kara Willard55018.6
Green David Carey-Stuart1073.6
Liberal Democrats Paul Smith1033.5
Majority
Turnout 2,95639.2
Labour gain from Conservative

Lewes

Chailey
PartyCandidateVotes%
Conservative Jim Sheppard 1,621 45.8
Liberal Democrats Sarah Osborne81223.0
UKIP Tam Large66218.7
Green Alex Luetchford2226.3
Labour George Adsett-Knutsen2196.2
Majority
Turnout 3,53636.2
Conservative hold
Lewes
PartyCandidateVotes%
Independent Ruth O'Keeffe 2,385 59.5
Green Alfie Stirling59214.8
Labour Gaby Weiner3428.5
Liberal Democrats Joyce Bell3057.6
UKIP Donna Edmunds2315.8
Conservative Roy Burman1523.8
Majority
Turnout 4,00745.2
Independent hold
Newhaven and Ouse Valley West
PartyCandidateVotes%
Liberal Democrats Carla Butler 784 31.3
UKIP George Cork72428.9
Conservative Tony Bradbury54021.6
Labour Jan Woodling31712.7
Green Ashley Price1405.6
Majority
Turnout 2,50530.2
Liberal Democrats hold
Ouse Valley East
PartyCandidateVotes%
UKIP Peter Charlton 934 31.6
Conservative Robbie Robertson66322.5
Liberal Democrats Steve Saunders53218.0
Independent Roger Foxwell48616.5
Labour Trevor Hopper1866.3
Green Johnny Denis1515.1
Majority
Turnout 2,95238.5
UKIP gain from Liberal Democrats
Peacehaven and Telscombe Towns (2 seats)
PartyCandidateVotes%
UKIP Ian Buchanan 2,236 19.8
UKIP Phil Howson 2,232 19.8
Conservative John Livings2,14819.0
Conservative Andy Smith2,02718.0
Labour John Carden1,1199.9
Labour Christine Robinson1,1169.9
Green Adrian Ross2071.8
Green Keith Rapley1991.8
Turnout 5,64233.6
UKIP gain from Conservative
Ringmer and Lewes Bridge
PartyCandidateVotes%
Liberal Democrats Rosalyn St Pierre 1,103 32.3
Conservative Richard Turner70820.7
UKIP Ian Wilson57416.8
Independent Matt Kent40711.9
Labour Louis Blair3269.5
Green Susan Murray2988.7
Majority
Turnout 3,41637.7
Liberal Democrats hold
Seaford Blatchington
PartyCandidateVotes%
Liberal Democrats Carolyn Lambert 900 32.1
UKIP Jeffrey Titford87331.2
Conservative Paul Franklin70225.1
Labour Agnes Wheeler1946.9
Green Roger Murray1334.7
Majority
Turnout 2,80235.3
Liberal Democrats hold
Seaford Sutton
PartyCandidateVotes%
UKIP Frank Carstairs 1,189 39.7
Conservative Sam Adeniji92730.9
Liberal Democrats Eleas Hussain55718.6
Labour Peter Hambly1916.4
Green Patti Broome1334.4
Majority
Turnout 2,99739.9
UKIP gain from Liberal Democrats

Rother

Battle and Crowhurst
PartyCandidateVotes%
Liberal Democrats Kathryn Field 1,131 43.3
Conservative Pam Doodes62123.8
UKIP Tom Foy60623.2
Labour Tim MacPherson2529.7
Majority
Turnout 2,61034.9
Liberal Democrats hold
Bexhill East
PartyCandidateVotes%
Independent Charles Clark 879 35.1
UKIP Geoffrey Bastin61924.8
Conservative Martin Kenward47218.9
Labour Philipa Coughlan27210.9
Liberal Democrats Vivienne Bond25910.4
Majority
Turnout 2,50132.8
Independent gain from Conservative
Bexhill King Offa (2)
PartyCandidateVotes%
Conservative Michael Ensor 1,693 31.8
UKIP Michael Phillips 1,629 30.6
UKIP Yvonne Clout1,52928.7
Conservative Joy Hughes1,44527.1
Labour Alan Bearne1,02119.2
Labour Paul Courtel95217,9
Independent Yolanda Laybourne89516.8
Independent Andrew Crotty72313.6
Liberal Democrats Stuart Wood4979.3
Liberal Democrats Tracy Dixon2705.1
Turnout 5,32728.0
Conservative hold
UKIP gain from Conservative
Bexhill West
PartyCandidateVotes%
Independent Stuart Earl 1,334 42.6
Conservative Nichollas Hollingsworth81226.0
UKIP Alf Lovell72023.0
Labour Yvonne Cleland1695.4
Liberal Democrats John Zipperlen933.0
Majority
Turnout 3,12839.9
Independent gain from Conservative
Brede Valley and Marsham
PartyCandidateVotes%
Conservative Carl Maynard 1,195 44.6
UKIP Cliff Stokes83731.3
Labour Jonathan Lee50318.8
Liberal Democrats Chris Lewcock1425.3
Majority
Turnout 2,67736.3
Conservative hold
Northern Rother
PartyCandidateVotes%
Conservative Angharad Davies 1,222 42.7
UKIP Trevor Gooding82428.8
Liberal Democrats Sue Prochak81828.6
Majority
Turnout 2,86434.7
Conservative hold
Rother North West
PartyCandidateVotes%
Conservative John Barnes 1,158 47.0
UKIP Tony Smith67727.5
Liberal Democrats Steve Barrass29111.8
Green Don Nicholls1706.9
Labour Christoper Husbands1666.7
Majority
Turnout 2,46232.8
Conservative hold
Rye and Eastern Rother
PartyCandidateVotes%
Conservative Keith Glazier 963 36.1
UKIP Michael McKenzie88433.2
Labour Nick Warren64724.3
Liberal Democrats Peter Hillier-Palmer1716.4
Majority
Turnout 2,66536.2
Conservative hold

Wealden

Alfriston, East Hoathly & Hellingly
PartyCandidateVotes%
Conservative Nick Bennett 1,272 38.8
UKIP Dan Docker1,13134.5
Liberal Democrats Andy Watkins55216.8
Labour Tom Serpell32710.0
Majority
Turnout 3,28234.2
Conservative hold
Buxted Maresfield
PartyCandidateVotes%
Conservative Roy Galley 1,478 51.4
UKIP Tony Robards84529.4
Liberal Democrats Martha Whittle30910.7
Labour Bruce Meredeen2438.5
Majority
Turnout 2,87532.8
Conservative hold
Crowborough (2 seats)
PartyCandidateVotes%
Conservative Richard Stogdon 1,866 41.9
Conservative Sylvia Tidy 1,723 38.6
Independent Stephen Isted1,18926.7
UKIP Anna-Marie Crampton1,15726.0
UKIP Sonia Finch1,12725.3
Labour Brendan Clegg46910.6
Labour Dave Neeves3938.8
Liberal Democrats Beverley Johnstone3407.6
Liberal Democrats David Shaw3277.3
Green Scott Mason3257.3
Turnout 4,45826.8
Conservative hold
Conservative hold
Forest Row
PartyCandidateVotes%
Conservative Francis Whetstone 1,095 39.8
UKIP Peter Griffiths79528.9
Green Keith Obbard43315.7
Liberal Democrats Chris Rycroft2699.8
Labour Kevin O'Sullivan1585.7
Majority
Turnout 2,75030.4
Conservative hold
Framfield and Horam
PartyCandidateVotes%
Conservative Chris Dowling 1,415 48.8
UKIP Graham Shevill93532.2
Labour Lis Rumbold2769.5
Liberal Democrats Michael Harker2759.5
Majority
Turnout 2,90132.2
Conservative hold
Hailsham and Herstmonceux (2 seats)
PartyCandidateVotes%
UKIP Laurence Keeley 1,892 40.4
Conservative Bill Bentley 1,859 39.7
UKIP David Younge1,76937.7
Conservative Roger Thomas1,51532.3
Liberal Democrats Paul Holbrook66014.1
Labour Steve Cross65614.0
Labour Roger McCarthy53211.3
Liberal Democrats Graham Morgan49310.5
Turnout 4,68827.2
UKIP gain from Conservative
Conservative hold
Heathfield
PartyCandidateVotes%
Conservative Rupert Simmons 1,253 49.7
UKIP Julie Docker79831.6
Labour Craig Austen-White26510.5
Liberal Democrats Jim Benson2068.2
Majority
Turnout 2,52230.7
Conservative hold
Pevensey and Westham
PartyCandidateVotes%
UKIP Mike Pursglove 1,096 43.9
Conservative Tony Freebody99139.7
Labour Robert Slater27210.9
Liberal Democrats Rachel Hills1365.5
Majority
Turnout 2,49532.7
UKIP gain from Conservative
Polegate, Willingdon and East Dean (2 seats)
PartyCandidateVotes%
Independent Stephen Shing3,06654.0
Independent Daniel Shing2,79349.2
UKIP Bernie Goodwin1,28922.7
Conservative Douglas Murray1,09919.4
UKIP Maureen Goodwin1,04718.4
Conservative Simon Popek87515.4
Liberal Democrats Don Broadbent59510.5
Liberal Democrats Rob Slater3566.3
Labour Alex Mthobi2304.1
Turnout 5,67539.2
Independent hold
Independent hold
Uckfield
PartyCandidateVotes%
Conservative Claire Dowling 928 32.3
Liberal Democrats Paul Sparks88030.7
UKIP Mike Mayo76426.6
Labour Chris Horlock29810.4
Majority
Turnout 2,87032.3
Conservative hold
Wadhurst
PartyCandidateVotes%
Conservative Bob Standley 2,037 66.9
Green Jonathan Kent47515.6
Labour Felicity Harvest2698.8
Liberal Democrats Gavin Barrass2668.7
Majority
Turnout 3,04732.1
Conservative hold

Related Research Articles

<span class="mw-page-title-main">2005 Suffolk County Council election</span> 2005 UK local government election

Elections to Suffolk County Council were held on 5 May 2005. The whole council was up for election with boundary changes since the last election in 2001 reducing the number of seats by 5. The Conservative Party gained control of the council from no overall control.

<span class="mw-page-title-main">2009 Hertfordshire County Council election</span>

An election to Hertfordshire County Council took place on 4 June 2009 the date of the 2009 United Kingdom local elections. The whole elected council was up for election. The councillors were elected from the 77 wards, which return one each by first-past-the-post voting for a four-year term of office. The wards were the same as those used at the previous election in 2005.

<span class="mw-page-title-main">2009 Cornwall Council election</span>

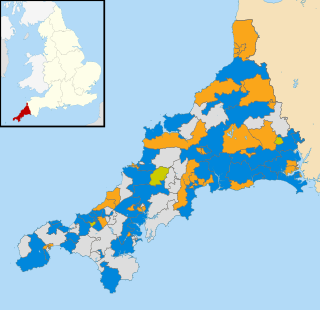
The Cornwall Council election, 2009, was an election for all 123 seats on the council. Cornwall Council is a unitary authority that covers the majority of the ceremonial county of Cornwall, with the exception of the Isles of Scilly which have an independent local authority. The elections took place concurrently with other local elections across England and Wales as well as the UK component of the elections to the European Parliament. Cornwall had seen its district and county councils abolished, replaced by a single 123-member Cornish unitary authority, for which councillors were elected for a full term.

<span class="mw-page-title-main">2009 Surrey County Council election</span>

Elections to Surrey County Council took place on 4 June 2009 as part of the 2009 United Kingdom local elections, having been delayed from 7 May in order for the elections to take place alongside those to the European Parliament.

<span class="mw-page-title-main">2014 United Kingdom local elections</span>

The 2014 United Kingdom local elections were held on 22 May 2014. Usually these elections are held on the first Thursday in May but were postponed to coincide with the 2014 European Parliament Elections. Direct elections were held for all 32 London boroughs, all 36 metropolitan boroughs, 74 district/borough councils, 19 unitary authorities and various mayoral posts in England and elections to the new councils in Northern Ireland.

<span class="mw-page-title-main">2013 Derbyshire County Council election</span>

An election to Derbyshire County Council took place on 2 May 2013 as part of the 2013 United Kingdom local elections. Following the final draft of the 2012 electoral review, 64 councillors were elected from 61 electoral divisions which returned either one or two county councillors each by first-past-the-post voting for a four-year term of office. No elections were held in the City of Derby, which is a unitary authority outside the area covered by the County Council. The Labour Party won back control of the council by a landslide victory, taking forty-two of the authority's sixty-four seats.

<span class="mw-page-title-main">2013 North Yorkshire County Council election</span>

An election to North Yorkshire County Council took place on 2 May 2013 as part of the 2013 United Kingdom local elections. 72 councillors were elected from 68 electoral divisions, which returned either one or two county councillors each by first-past-the-post voting for a four-year term of office. The four divisions which elected two members were Harrogate Bilton & Nidd Gorge, Harrogate Central, Knaresborough, and Selby Barlby. Of those seats UKIP won its first ever seats on the council in Bilton and Nidd Gorge. The electoral divisions were the same as those used at the previous election in 2009. The election saw the Conservative Party maintain overall control of the council.

<span class="mw-page-title-main">2013 Leicestershire County Council election</span> 2013 UK local government election

An election to Leicestershire County Council took place on 2 May 2013 as part of the 2013 United Kingdom local elections. 55 councillors were elected from 52 electoral divisions, which returned either one or two county councillors each by first-past-the-post voting for a four-year term of office. The Conservatives held control of the council with a reduced majority of 5 seats. Despite a strong challenge from UKIP, the party only gained 2 seats whilst the Liberal Democrats lost one seat and Labour recouped some of their 2009 losses, gaining 6 seats.

<span class="mw-page-title-main">2013 West Sussex County Council election</span>

The West Sussex County Council election, 2013 took place on 2 May 2013, as part of the 2013 United Kingdom local elections. All 71 electoral divisions were up for election, which returned one county councillor each by first-past-the-post voting for a four-year term of office. At this election, the Conservative Party was seeking to retain overall control of the council, and the Liberal Democrats to maintain their position as the main opposition party.

<span class="mw-page-title-main">2013 Hampshire County Council election</span>

An election to Hampshire County Council took place on 2 May 2013 as part of the 2013 United Kingdom local elections. 78 councillors were elected from 75 electoral divisions, which returned either one or two county councillors each by first-past-the-post voting for a four-year term of office. The electoral divisions were the same as those of the previous election in 2009. No elections were held in Portsmouth and Southampton, which are unitary authorities outside the area covered by the County Council. The election saw the Conservative Party retain overall control of the council, with a reduced majority of five councillors.

<span class="mw-page-title-main">2013 Kent County Council election</span> 2013 UK local government election

The Kent County Council election, 2013 was an election to all 84 seats on Kent County Council held on Thursday 2 May as part of the 2013 United Kingdom local elections. 84 councillors were elected from 72 electoral divisions, which returned either one or two county councillors each by first-past-the-post voting for a four-year term of office. The electoral divisions were the same as those used at the previous election in 2009. No elections were held in Medway, which is a unitary authority outside the area covered by the County Council. The election saw the Conservative Party narrowly retain overall control of the council.

<span class="mw-page-title-main">2013 Cambridgeshire County Council election</span>

An election to Cambridgeshire County Council took place on 2 May 2013 as part of the 2013 United Kingdom local elections. 69 councillors were elected from 60 electoral divisions, which returned either one or two county councillors each by first-past-the-post voting for a four-year term of office. The electoral divisions were the same as those used at the previous election in 2009. No elections were held in Peterborough, which is a unitary authority outside the area covered by the County Council. The election saw the Conservative Party lose overall control of the council.

<span class="mw-page-title-main">2013 Worcestershire County Council election</span>

An election to Worcestershire County Council took place on 2 May 2013 as part of the 2013 United Kingdom local elections. 57 councillors were elected from 53 electoral divisions, which returned either one or two county councillors each by first-past-the-post voting for a four-year term of office. The divisions were the same as those used at the previous election in 2009. The election saw the Conservative Party retain overall control of the council with a significantly reduced majority of just 2 seats.

<span class="mw-page-title-main">2013 Lincolnshire County Council election</span>

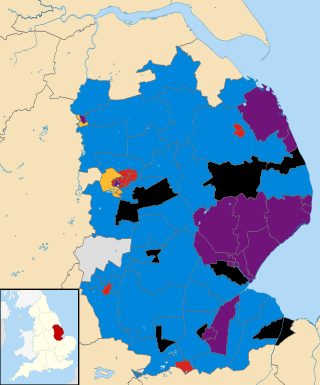
An election to Lincolnshire County Council took place on 2 May 2013 as part of the 2013 United Kingdom local elections. 77 electoral divisions returned one county councillor each by first-past-the-post voting for a four-year term of office. The electoral divisions were the same as those used at the previous election in 2009. No elections were held in North Lincolnshire or North East Lincolnshire, which are unitary authorities outside the area covered by the County Council.

<span class="mw-page-title-main">2013 Gloucestershire County Council election</span>

Elections to Gloucestershire County Council took place on 2 May 2013 as part of the 2013 United Kingdom local elections. 53 electoral divisions elected one county councillor each by first-past-the-post voting for a four-year term of office. No elections were held in South Gloucestershire, which is a unitary authority outside the area covered by the County Council.

<span class="mw-page-title-main">2013 Hertfordshire County Council election</span>

An election to Hertfordshire County Council took place on 2 May 2013, as part of the 2013 United Kingdom local elections. 77 electoral divisions elected one county councilor each by first-past-the-post voting for a four-year term of office. The electoral divisions were the same as those used at the previous election in 2009.

<span class="mw-page-title-main">2013 Essex County Council election</span> 2013 UK local government election

An election to Essex County Council took place on 2 May 2013 as part of the 2013 United Kingdom local elections. 75 councillors were elected from 70 electoral divisions, which returned either one or two county councillors each by first-past-the-post voting for a four-year term of office. The electoral divisions were the same as those used at the previous election in 2009. No elections were held in Thurrock or Southend-on-Sea, which are unitary authorities outside the area covered by the County Council.

<span class="mw-page-title-main">2013 Suffolk County Council election</span> 2013 UK local government election

Elections to Suffolk County Council took place on 2 May 2013 as part of the 2013 United Kingdom local elections. 75 councillors were elected from 63 electoral divisions, which returned either one or two county councillors each by first-past-the-post voting for a four-year term of office. The electoral divisions were the same as those used at the previous election in 2009.

<span class="mw-page-title-main">2013 Northamptonshire County Council election</span>

An election to Northamptonshire County Council took place on 2 May 2013 as part of the 2013 United Kingdom local elections. Following a boundary review, the number of county councillors was reduced from 73 to 57 from this election. All members were elected by first-past-the-post voting from single-member electoral divisions for a four-year term of office. The Conservative Party held on to their overall majority, having held overall control of the council since 2005.

<span class="mw-page-title-main">2017 Gloucestershire County Council election</span>

The 2017 Gloucestershire County Council election took place on 4 May 2017 as part of the 2017 local elections in the United Kingdom. All 53 councillors were elected from electoral divisions which returned one county councillor each by first-past-the-post voting for a four-year term of office. Control of the council went from a Conservative Party minority to a majority administration.

References

  1. "County Council Elections". East Sussex County Council. 30 March 2013. Retrieved 30 March 2013.
  2. "The Representation of the People (Form of Canvass) (England and Wales) Regulations 2006, Schedule Part 1". Legislation.gov.uk. 13 October 2011. Retrieved 18 April 2012.
  3. "I have two homes. Can I register at both addresses?". The Electoral Commission. Archived from the original on 31 December 2013. Retrieved 5 January 2011.
  4. "Tories lose control of East Sussex County Council". BBC News . Retrieved 4 May 2013.
  5. "Tories to form minority administration on East Sussex County Council". BBC. 11 May 2013. Retrieved 17 May 2013.