This article needs additional citations for verification .(March 2020) |
| |||||||||||||||||||||||||||||||||||||||||
All 78 seats to Brighton and Hove Borough Council 40 seats needed for a majority | |||||||||||||||||||||||||||||||||||||||||
---|---|---|---|---|---|---|---|---|---|---|---|---|---|---|---|---|---|---|---|---|---|---|---|---|---|---|---|---|---|---|---|---|---|---|---|---|---|---|---|---|---|
Turnout | 38.4% | ||||||||||||||||||||||||||||||||||||||||
| |||||||||||||||||||||||||||||||||||||||||
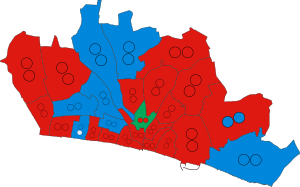
Winner of each seat at the 1996 Brighton and Hove Borough Council election | |||||||||||||||||||||||||||||||||||||||||
|
The 1996 Brighton and Hove Borough Council election was held on 9 May 1996 to elect members to the new unitary authority of Brighton and Hove Borough Council in East Sussex, England. It was the inaugural election to the new council, and was held nearly a year before the council formally came into being on 1 April 1997, replacing the former Brighton Borough Council and Hove Borough Council. The councillors elected in May 1996 served as a shadow authority alongside the outgoing councils, overseeing the transition to the new arrangements, until coming into their powers in April 1997.
The whole council was up for election, and all 78 councillors were elected from 26 wards. [1] The ward boundaries were the same as the old boundaries used in previous elections for the two predecessor authorities.
The result was a clear Labour victory, with the party winning an overall majority of seats. Labour had previously controlled both predecessor authorities: Brighton Borough Council since 1986, and Hove Borough Council since 1995.
The wards and number of seats in each wards remained the same as the respective borough councils and therefore the swing and incumbents are all technically nominal.
Party | Brighton and Hove Borough Council 1996 | Pre merger councils | |||||||||||
---|---|---|---|---|---|---|---|---|---|---|---|---|---|
Brighton Borough (thirds) | Hove Borough (all out) | Total (nominal) | |||||||||||
1992 | 1994 | 1995 | 1995 | ||||||||||
Seats | % | Seats | % | Seats | % | Seats | % | Seats | % | Seats | % | ||
Labour | 54 | 46.7 | 3 | 32.6 | 12 | 49.6 | 13 | 55.7 | 11 | 44.1 | 39 | 45.5 | |
Conservative | 22 | 32.6 | 13 | 55.1 | 4 | 32.6 | 3 | 29.7 | 16 | 33.8 | 36 | 37.8 | |
Green Party | 1 | 8.6 | 0 | 4.8 | 0 | 4.3 | 0 | 4.8 | 0 | 5.8 | 0 | 4.9 | |
Liberal Democrat | 0 | 9.1 | 0 | 7.6 | 0 | 13.1 | 0 | 9.2 | 3 | 16 | 3 | 11.5 | |
Independent | 1 | 1.3 | 0 | 0 | 0 | 0 | 0 | 0.1 | 0 | 0.2 | 0 | 0.1 |
1996 Brighton and Hove Borough Council election | ||||||||||
---|---|---|---|---|---|---|---|---|---|---|
Party | Candidates | Seats | Gains | Losses | Net gain/loss | Seats % | Votes % | Votes | +/− | |
Labour | 78 | 54 | 12 | 2 | 10 | 69.2 | 51.0 | 105,903 | N/A | |
Conservative | 77 | 22 | 1 | 10 | 9 | 28.2 | 35.5 | 73,684 | N/A | |
Green | 28 | 1 | 1 | 0 | 1 | 1.3 | 4.1 | 8,585 | N/A | |
Ind. Conservative | 9 | 1 | 1 | 0 | 1 | 1.3 | 1.4 | 2,906 | N/A | |
Liberal Democrats | 59 | 0 | 0 | 3 | 3 | 0.0 | 7.8 | 16,260 | N/A | |
Residents | 1 | 0 | 0 | 0 | 0.0 | 0.1 | 227 | N/A | ||
Militant Labour | 1 | 0 | 0 | 0 | 0.0 | 0.1 | 162 | N/A |
After the inaugural elections the composition of the council was compared to its previous consistent councils.
Brighton Borough Council composition after the election in 1995 was:
28 | 20 |
Lab | Con |
Hove Borough Council composition after the election in 1995 was:
16 | 11 | 3 |
Lab | Con | LD |
After the inaugural election in 1996 the composition of the council was:
54 | 22 | 1 | 1 |
Lab | Con | G | I |
Candidates who were previously councillors in the Brighton Borough Council or Hove Borough Council are indicated with a (*)
Party | Candidate | Votes | % | |
---|---|---|---|---|
Labour | Davies C. | 941 | 40.4 | |
Labour | Hunt F. Ms. | 919 | 39.5 | |
Labour | McGinley J. | 841 | 36.1 | |
Liberal Democrats | Hillman J.* | 749 | 32.2 | |
Liberal Democrats | Wakeling J. Ms.* | 691 | 29.7 | |
Liberal Democrats | Vivian P. Ms. | 671 | 28.8 | |
Conservative | Hunter S. Ms. | 610 | 26.2 | |
Conservative | Boustead C. | 604 | 25.9 | |
Conservative | Mitchell J. | 583 | 25.0 | |
Green | Nightengale K. | 230 | 9.9 | |
Turnout | 2,329 | 30.7 | ||
Registered electors | 7,587 | |||
Labour gain from Liberal Democrats | ||||
Party | Candidate | Votes | % | |
---|---|---|---|---|
Conservative | Langston J. Ms.* | 1,330 | 49.5 | |
Conservative | Langston S.* | 1,294 | 48.2 | |
Conservative | Jordan B.* | 1,292 | 48.1 | |
Labour | Bower S. Lab | 1,145 | 42.6 | |
Labour | Visor V. Ms. | 1,118 | 41.6 | |
Labour | Ralfe B. | 1,064 | 39.6 | |
Liberal Democrats | Thomas P. Ms. | 246 | 9.2 | |
Liberal Democrats | Driffill B. | 237 | 8.8 | |
Green | Hudson G. | 225 | 8.4 | |
Liberal Democrats | Taylor S. | 224 | 8.3 | |
Turnout | 2,686 | 36.7 | ||
Registered electors | 7,318 | |||
Conservative hold | ||||
Conservative hold |
Party | Candidate | Votes | % | |
---|---|---|---|---|
Labour | Keilty G.* | 1,421 | 51.9 | |
Labour | Newland D. | 1,309 | 47.8 | |
Labour | Walshe B. Ms.* | 1,300 | 47.5 | |
Conservative | Willows P. | 1,090 | 39.8 | |
Conservative | Jackson M. | 1,066 | 39.0 | |
Conservative | Jackson G. | 1,055 | 38.6 | |
Liberal Democrats | Walls M. Ms | 185 | 6.8 | |
Liberal Democrats | Bates E. | 167 | 6.1 | |
Liberal Democrats | Bickle P. Ms | 164 | 6.0 | |
Green | McHenry J. Ms. | 99 | 3.6 | |
Turnout | 2,736 | 43.1 | ||
Registered electors | 6,348 | |||
Labour hold | ||||
Labour hold | ||||
Labour hold |
Party | Candidate | Votes | % | |
---|---|---|---|---|
Labour | Smith J. Ms.* | 2,100 | 71.5 | |
Labour | Schaffer S. Ms.* | 1,990 | 67.8 | |
Labour | Morley C. | 1,789 | 60.9 | |
Green | Chapman K. Ms. | 665 | 22.6 | |
Conservative | Dudeney R. Ms. | 380 | 12.9 | |
Conservative | Jackson G. | 338 | 11.5 | |
Conservative | Radford-Kirby E. Ms. | 323 | 11.0 | |
Liberal Democrats | Cornelius C. | 296 | 10.1 | |
Turnout | 2,936 | 34.7 | ||
Registered electors | 8,461 | |||
Labour hold | ||||
Labour hold | ||||
Labour hold |
Party | Candidate | Votes | % | |
---|---|---|---|---|
Labour | David Lepper* | 1,891 | 77.9 | |
Labour | Lepper J. Ms. | 1,798 | 74.1 | |
Labour | Finch B.* | 1,742 | 71.8 | |
Conservative | Franklin C. Ms. | 384 | 15.8 | |
Conservative | McGrath M. | 377 | 15.5 | |
Conservative | Norman K. | 359 | 14.8 | |
Green | Gardner P. | 276 | 11.4 | |
Liberal Democrats | Lamb D. | 266 | 11.0 | |
Liberal Democrats | Powell D. | 194 | 8.0 | |
Turnout | 2,426 | 32.1 | ||
Registered electors | 7,556 | |||
Labour hold | ||||
Labour hold | ||||
Labour hold |
Party | Candidate | Votes | % | |
---|---|---|---|---|
Labour | Duncan I.* | 1,577 | 66.5 | |
Labour | Burgess S.* | 1,567 | 66.1 | |
Labour | Mitchell G. Ms.* | 1,529 | 64.5 | |
Conservative | Radford D. Ms. | 634 | 26.8 | |
Conservative | Sampson S. | 593 | 25.0 | |
Conservative | Amin J. | 589 | 24.9 | |
Green | Hodd J. Ms. | 235 | 9.9 | |
Liberal Democrats | Jones M. | 217 | 9.2 | |
Turnout | 2,370 | 35.4 | ||
Registered electors | 6,696 | |||
Labour hold | ||||
Labour hold | ||||
Labour hold |
Party | Candidate | Votes | % | |
---|---|---|---|---|
Labour | Marsh M. Ms.* | 1,347 | 59.1 | |
Labour | Desmond Turner | 1,309 | 57.4 | |
Labour | Johnston M. | 1,275 | 55.9 | |
Conservative | Mears M. Ms.* | 1,003 | 44.0 | |
Conservative | Smith D. | 916 | 40.2 | |
Conservative | Fairs B. Ms. | 906 | 39.8 | |
Militant Labour | Dale K. | 162 | 7.1 | |
Liberal Democrats | Clements I. | 140 | 6.1 | |
Green | Coyne B. Ms. | 133 | 5.8 | |
Liberal Democrats | Howard P. Ms. | 126 | 5.5 | |
Liberal Democrats | Howard A. | 114 | 5.0 | |
Turnout | 2,279 | 29.2 | ||
Registered electors | 7,803 | |||
Labour hold | ||||
Labour hold | ||||
Labour gain from Conservative | ||||
Party | Candidate | Votes | % | |
---|---|---|---|---|
Labour | Meadows A. Ms.* | 1,097 | 62.9 | |
Labour | Hazelgrove J. | 1,079 | 61.9 | |
Labour | Tonks F.* | 1,019 | 58.4 | |
Conservative | Gunn K. Ms.* | 407 | 23.3 | |
Conservative | Amiet J. Ms. | 399 | 22.9 | |
Conservative | Stevens J. | 375 | 21.5 | |
Residents | Avey C. | 227 | 13.0 | |
Liberal Democrats | Lovatt J. | 179 | 10.3 | |
Green | Mills A. Ms. | 127 | 7.3 | |
Turnout | 1,744 | 27.1 | ||
Registered electors | 6,435 | |||
Labour hold | ||||
Labour gain from Conservative | ||||
Labour hold |
Party | Candidate | Votes | % | |
---|---|---|---|---|
Conservative | Lewis P. | 1,406 | 50.3 | |
Conservative | Worgan M. | 1,398 | 50.1 | |
Conservative | Wade S. | 1,325 | 48.4 | |
Labour | James H. Ms. | 1,250 | 44.8 | |
Labour | Anthony D. | 1,242 | 44.5 | |
Labour | Spillman H. | 1,133 | 40.6 | |
Liberal Democrats | Alldred E. | 187 | 6.7 | |
Green | Phillips J. Ms. | 123 | 4.4 | |
Turnout | 2,793 | 45.3 | ||
Registered electors | 6,165 | |||
Conservative hold | ||||
Conservative gain from Labour | ||||
Conservative hold |
Party | Candidate | Votes | % | |
---|---|---|---|---|
Labour | Carden B.* | 1,720 | 70.3 | |
Labour | Steer H. | 1,686 | 68.9 | |
Labour | Turner D. | 1,638 | 66.9 | |
Conservative | Saunders D. Ms. | 634 | 25.9 | |
Conservative | Braybrook B. | 608 | 24.8 | |
Conservative | Hess M. | 533 | 21.8 | |
Green | Gray K. | 157 | 6.4 | |
Turnout | 2,448 | 35.1 | ||
Registered electors | 6,975 | |||
Labour hold | ||||
Labour hold | ||||
Labour hold |
Party | Candidate | Votes | % | |
---|---|---|---|---|
Conservative | Theobald C. Ms.* | 2,156 | 59.3 | |
Conservative | Theobald G.* | 2,153 | 59.2 | |
Conservative | Sheldon J. | 2,076 | 57.1 | |
Labour | Blackwood R. | 1,115 | 30.6 | |
Labour | Blackwood M. Ms. | 1,114 | 30.6 | |
Labour | Miller H. | 1,005 | 27.6 | |
Liberal Democrats | De Souza J. Ms. | 469 | 12.9 | |
Liberal Democrats | Latimer D. | 359 | 9.9 | |
Liberal Democrats | Latimer D. Ms. | 356 | 9.8 | |
Green | Haase A. | 99 | 2.7 | |
Turnout | 3,638 | 52.5 | ||
Registered electors | 6,929 | |||
Conservative hold | ||||
Conservative hold |
Party | Candidate | Votes | % | |
---|---|---|---|---|
Labour | Ivor Caplin* | 1,611 | 61.2 | |
Labour | Collier S.* | 1,552 | 59.0 | |
Labour | John S. Ms.* | 1,434 | 55.0 | |
Conservative | Kemble E. | 709 | 26.9 | |
Conservative | Greenwood C. Ms. | 704 | 28.8 | |
Conservative | Veale M. | 681 | 25.9 | |
Liberal Democrats | Donovan N. | 300 | 11.4 | |
Liberal Democrats | James I. | 295 | 11.2 | |
Green | Mylton-Thorley M. Ms. | 95 | 3.6 | |
Turnout | 2,631 | 38.4 | ||
Registered electors | 6,851 | |||
Labour hold | ||||
Labour hold | ||||
Labour hold |
Party | Candidate | Votes | % | |
---|---|---|---|---|
Labour | McCaffery J. Ms. | 1,803 | 52.2 | |
Labour | Austin L. Ms. | 1,792 | 51.9 | |
Labour | Spray J. Ms.* | 1,756 | 50.9 | |
Conservative | Mallender G. Con | 1,264 | 36.6 | |
Conservative | Marchant V.* | 1,262 | 36.5 | |
Conservative | Nilchiber K. | 1,262 | 36.5 | |
Liberal Democrats | Hunter T. | 334 | 9.7 | |
Liberal Democrats | Potts S. | 294 | 8.5 | |
Liberal Democrats | Schelwald E. | 255 | 7.4 | |
Green | Littman L. | 254 | 7.4 | |
Turnout | 3,453 | 44.9 | ||
Registered electors | 7,690 | |||
Labour hold | ||||
Labour gain from Conservative | ||||
Labour hold |
Party | Candidate | Votes | % | |
---|---|---|---|---|
Labour | Lythell J.* | 1,623 | 67.6 | |
Labour | Bodfish K. | 1,566 | 65.3 | |
Labour | Townsend J.* | 1,540 | 64.2 | |
Conservative | Allaway H. | 621 | 25.9 | |
Conservative | Vivian S. Ms. | 601 | 25.0 | |
Conservative | Wells S. Ms. | 562 | 23.4 | |
Green | Chadwick S. Ms | 275 | 11.5 | |
Liberal Democrats | Blease J. Ms. | 195 | 8.1 | |
Liberal Democrats | Blease J. | 192 | 8.0 | |
Turnout | 2,400 | 38.0 | ||
Registered electors | 6,316 | |||
Labour hold | ||||
Labour gain from Conservative | ||||
Labour hold |
Party | Candidate | Votes | % | |
---|---|---|---|---|
Labour | Ping N.* | 1,553 | 59.2 | |
Labour | Pennington R.* | 1,430 | 54.5 | |
Labour | Warmington J. | 1,404 | 53.5 | |
Conservative | Cameron J. | 776 | 29.6 | |
Conservative | Boggon M.* | 758 | 28.9 | |
Conservative | Cockman D. | 741 | 28.3 | |
Green | Hyde Parker A. | 347 | 13.2 | |
Liberal Democrats | Freeman T. | 257 | 9.8 | |
Liberal Democrats | Guild J. | 241 | 9.2 | |
Liberal Democrats | Cotton E. | 203 | 7.7 | |
Turnout | 2,623 | 36.3 | ||
Registered electors | 7,227 | |||
Labour hold | ||||
Labour hold | ||||
Labour gain from Conservative | ||||
Party | Candidate | Votes | % | |
---|---|---|---|---|
Conservative | Wrigley S. Ms.* | 1,745 | 54.8 | |
Conservative | Hunt B. | 1,738 | 54.6 | |
Conservative | Simon Radford-Kirby | 1,697 | 53.3 | |
Labour | Bunting M. | 783 | 24.6 | |
Labour | Moriarty J. | 732 | 23.0 | |
Labour | Gray A. Ms. | 715 | 22.5 | |
Liberal Democrats | Davidson D. Ms. | 470 | 14.8 | |
Liberal Democrats | De Souza H. | 470 | 14.8 | |
Liberal Democrats | Edwards P. | 437 | 13.7 | |
Ind. Conservative | Grant M. | 201 | 6.3 | |
Ind. Conservative | Wright N.* | 193 | 6.1 | |
Ind. Conservative | Wright A. Ms. | 181 | 5.7 | |
Green | Berrington J. | 113 | 3.6 | |
Turnout | 3,183 | 41.7 | ||
Registered electors | 7,633 | |||
Conservative hold | ||||
Conservative hold |
Party | Candidate | Votes | % | |
---|---|---|---|---|
Labour | Austin R. | 1,784 | 76.0 | |
Labour | Middleton M.* | 1,684 | 71.8 | |
Labour | Robinson N.* | 1,680 | 71.6 | |
Conservative | Bowes P. | 437 | 18.6 | |
Conservative | Gowans J. | 437 | 18.6 | |
Conservative | Larkin R. Ms. | 414 | 17.6 | |
Green | Needham I. | 358 | 15.3 | |
Liberal Democrats | Heale R. | 269 | 11.5 | |
Liberal Democrats | Oldfield E. Ms. | 233 | 9.9 | |
Liberal Democrats | Huggins B. | 231 | 9.8 | |
Turnout | 2,346 | 31.8 | ||
Registered electors | 7,377 | |||
Labour hold | ||||
Labour hold | ||||
Labour hold |
Party | Candidate | Votes | % | |
---|---|---|---|---|
Green | Pete West | 1,576 | 41.9 | |
Labour | Charleton S. | 1,517 | 40.4 | |
Labour | Gwyn-Jones L. Ms.* | 1,451 | 38.6 | |
Labour | Simpson C. Ms.* | 1,408 | 37.5 | |
Green | Whale R. Ms. | 973 | 25.9 | |
Green | Young F. Ms. | 845 | 22.5 | |
Conservative | Brimmell C. | 311 | 8.3 | |
Conservative | Maclean E. Ms. | 259 | 6.9 | |
Conservative | Maclean I. | 237 | 6.3 | |
Liberal Democrats | Fairweather M. | 199 | 5.3 | |
Liberal Democrats | Harden W. | 162 | 4.3 | |
Liberal Democrats | Parker W. | 135 | 3.6 | |
Turnout | 3,757 | 50.1 | ||
Registered electors | 7,499 | |||
Green gain from Labour | ||||
Labour hold | ||||
Labour hold |
Party | Candidate | Votes | % | |
---|---|---|---|---|
Conservative | Adams M. Ms.* | 1,572 | 66.9 | |
Conservative | Kapp J.* | 1,525 | 64.9 | |
Conservative | Rowe B.* | 1,525 | 64.9 | |
Labour | Jones A. | 478 | 20.3 | |
Labour | Montague S. | 461 | 19.6 | |
Labour | Lord S. | 459 | 19.5 | |
Liberal Democrats | Latham B. | 342 | 14.5 | |
Liberal Democrats | Innes D. Ms. | 331 | 14.1 | |
Liberal Democrats | Walls P. | 274 | 11.7 | |
Green | Jester M. | 92 | 3.9 | |
Turnout | 2,351 | 36.5 | ||
Registered electors | 6,441 | |||
Conservative hold | ||||
Conservative hold |
Party | Candidate | Votes | % | |
---|---|---|---|---|
Labour | Framroze T.* | 1,597 | 50.8 | |
Labour | Hawkes P. Ms.* | 1,589 | 50.6 | |
Labour | Beishon G. Ms. | 1,551 | 49.4 | |
Conservative | Careless D. | 922 | 29.4 | |
Conservative | Fairhall D. | 886 | 28.2 | |
Conservative | Pacifico M. | 854 | 27.2 | |
Liberal Democrats | Bailey P. | 258 | 8.2 | |
Green | Tofts P. | 231 | 7.4 | |
Liberal Democrats | Imms D. Ms. | 207 | 6.6 | |
Liberal Democrats | Garrett P. | 207 | 6.6 | |
Turnout | 3,141 | 40.2 | ||
Registered electors | 7,814 | |||
Labour hold | ||||
Labour hold | ||||
Labour gain from Conservative | ||||
Party | Candidate | Votes | % | |
---|---|---|---|---|
Labour | Steve Bassam* | 1,709 | 68.4 | |
Labour | Ballance J. | 1,581 | 63.2 | |
Labour | Durr A.* | 1,579 | 63.2 | |
Conservative | Dudeney D. | 623 | 24.9 | |
Conservative | Toner M.* | 580 | 23.2 | |
Conservative | Plater L. | 549 | 22.0 | |
Green | Santamaria L. | 260 | 10.4 | |
Liberal Democrats | Weller P. | 241 | 9.5 | |
Turnout | 2,500 | 33.6 | ||
Registered electors | 7,539 | |||
Labour hold | ||||
Labour gain from Conservative | ||||
Labour hold |
Party | Candidate | Votes | % | |
---|---|---|---|---|
Labour | Battle S. | 1,235 | 48.6 | |
Labour | Warman-Brown F. Ms.* | 1,217 | 47.9 | |
Labour | Gibbling M.* | 1,198 | 47.1 | |
Conservative | Martin P. | 973 | 38.3 | |
Conservative | Peltzer Dunn G. | 968 | 38.1 | |
Conservative | Bennett J. Ms. | 941 | 37.0 | |
Liberal Democrats | Bates K. Ms. | 234 | 9.2 | |
Liberal Democrats | Denyer P. | 210 | 8.3 | |
Ind. Conservative | Hogan V. | 208 | 8.2 | |
Green | Da Costa J. Ms. | 168 | 6.6 | |
Liberal Democrats | Elgood P. | 167 | 6.6 | |
Turnout | 2,542 | 35.6 | ||
Registered electors | 7,141 | |||
Labour hold | ||||
Labour hold | ||||
Labour hold |
Party | Candidate | Votes | % | |
---|---|---|---|---|
Conservative | Buttimer A. Ms.* | 1,221 | 47.2 | |
Conservative | Brown V. Ms.* | 1,186 | 45.8 | |
Ind. Conservative | Oxley B.* | 1,041 | 40.2 | |
Labour | Cooper R. | 1,008 | 39.0 | |
Labour | Benians G. | 994 | 38.4 | |
Labour | Gill P. | 965 | 37.3 | |
Liberal Democrats | Bull R. Ms. | 305 | 11.8 | |
Liberal Democrats | Lake J. Ms. | 289 | 11.2 | |
Liberal Democrats | Hayes D. | 279 | 10.8 | |
Ind. Conservative | Furness N. | 236 | 9.1 | |
Green | Mueller M. | 113 | 4.4 | |
Turnout | 2,587 | 35.3 | ||
Registered electors | 7,330 | |||
Conservative hold | ||||
Ind. Conservative gain from Conservative | ||||
Party | Candidate | Votes | % | |
---|---|---|---|---|
Conservative | Drake H.* | 1,656 | 47.0 | |
Conservative | Drake P. Ms. | 1,624 | 46.1 | |
Conservative | Norman A. Ms. | 1,514 | 43.0 | |
Labour | Prentice S. Ms. | 1,402 | 39.8 | |
Labour | Allen K. | 1,402 | 39.8 | |
Labour | Matz P. | 1,282 | 36.4 | |
Ind. Conservative | Humphrey J.* | 327 | 9.3 | |
Ind. Conservative | Barrett M.* | 299 | 8.5 | |
Liberal Democrats | McBeth D. | 243 | 6.9 | |
Liberal Democrats | Rimmington J. Ms. | 222 | 6.3 | |
Ind. Conservative | Rogers L. Ms. | 220 | 6.2 | |
Liberal Democrats | Brown P. | 218 | 6.2 | |
Green | Keenan G. Ms. | 186 | 5.3 | |
Turnout | 3,524 | 47.8 | ||
Registered electors | 7,373 | |||
Conservative hold | ||||
Conservative hold |
Party | Candidate | Votes | % | |
---|---|---|---|---|
Labour | Bowden C.* | 1,398 | 51.2 | |
Labour | Murphy P.* | 1,289 | 47.2 | |
Labour | Pratt A.* | 1,276 | 46.7 | |
Conservative | Cruikshank-Robb E. | 1,211 | 44.3 | |
Conservative | Brand S. Ms. | 1,170 | 42.8 | |
Conservative | Brand L. | 1,160 | 42.5 | |
Liberal Democrats | Percy A. | 253 | 9.3 | |
Liberal Democrats | Storey J. | 246 | 9.0 | |
Green | Baker N. | 189 | 6.9 | |
Turnout | 2,731 | 40.8 | ||
Registered electors | 6,695 | |||
Labour hold | ||||
Labour hold | ||||
Labour hold |
Party | Candidate | Votes | % | |
---|---|---|---|---|
Labour | Moorhouse M. Ms.* | 1,635 | 49.0 | |
Conservative | Wells G. | 1,608 | 48.2 | |
Conservative | Stiles P. Ms.* | 1,515 | 45.4 | |
Conservative | Dudeney D. | 1,489 | 44.6 | |
Labour | Griffiths G. | 1,385 | 41.5 | |
Labour | Newington J. | 1,325 | 39.7 | |
Liberal Democrats | Pearce L. Ms. | 325 | 9.7 | |
Green | Powell V. | 141 | 4.2 | |
Turnout | 3,339 | 44.9 | ||
Registered electors | 7,437 | |||
Labour hold | ||||
Conservative hold | ||||
Conservative hold |
The 1995 United Kingdom local elections took place on Thursday 6 April 1995 in Scotland, and Thursday 4 May 1995 in England and Wales. The Conservative Party lost over 2,000 councillors in the election, while the Labour Party won 48% of the vote, a record high for the party in local elections.
Brighton and Hove City Council is a unitary authority in East Sussex, England. It was created as Brighton and Hove Borough Council on 1 April 1997 replacing Brighton and Hove Borough Councils. It was granted city status in 2001.
Elections to Slough Borough Council were held on 4 May 2006. One third of the council was up for election. This was the 121st Slough general local authority election since Slough became a local government unit in 1863.
An election to Slough Borough Council was held on 10 June 2004. The whole council was up for election. This was the 120th Slough general local authority election, since Slough became a local government unit in 1863, including both whole Council elections and elections by thirds.
Elections to the Borough Council in Slough, England, were held on 3 May 2007. One third of the council was up for election. This was the 122nd Slough general local authority election since Slough became a local government unit in 1863.
The 1996 United Kingdom local elections were held on 2 May 1996. They were the last local elections until 2010 to show a decline in the number of Conservative councillors and an increase in the number of Labour councillors.
Elections to Brighton and Hove City Council were held on 5 May 2011, in line with other local elections in the United Kingdom. The whole council, a unitary authority, was up for election with 54 councillors elected from 21 wards.
Milton Keynes City Council is the local authority for the City of Milton Keynes, a unitary authority in Buckinghamshire, England. Until 1 April 1997 it was a non-metropolitan district.
The first election to Rhondda Cynon Taf County Borough Council was held on 4 May 1995. It was followed by the 1999 election. On the same day there were elections to the other 21 local authorities in Wales and community councils in Wales.
Hove was a non-metropolitan district in East Sussex, England. It was abolished on 1 April 1997 and replaced by Brighton and Hove.
Brighton was a non-metropolitan district in East Sussex, England. It was abolished on 1 April 1997 and replaced by Brighton and Hove.
The 1995 Cardiff Council election was the first election to the new unitary County Council of the City and County of Cardiff following the re-organization of local government in Wales. It was held on Thursday 4 May 1995. It was followed by the 1999 elections. On the same day there were elections to the other 21 local authorities in Wales and community councils in Wales. Labour won a majority of the seats. It was preceded in Cardiff by the 1991 elections to Cardiff City Council and the 1993 elections to South Glamorgan County Council.
The 1999 Cardiff Council election was the second election to the post-1996 Cardiff Council following the re-organization of local government in Wales. It was held on Thursday 6 May 1999. It was preceded by the 1995 election and followed by the 2004 elections. On the same day the first elections to the Welsh Assembly were held as well as elections to the other 21 local authorities in Wales. Labour retained a majority of the seats.
The 2019 Bracknell Forest Borough Council election took place on 2 May 2019 to elect all 42 councillors in 18 wards for Bracknell Forest Borough Council in England.
The 1995 Vale of Glamorgan Council election was held on 4 May 1995 to the new Vale of Glamorgan Council unitary authority in Vale of Glamorgan, Wales. It took place on the same day as other council elections in Wales and England. These were the first elections since the re-organization of local government in Wales.
The 2022 Barking and Dagenham London Borough Council election took place on 5 May 2022. All 51 members of Barking and Dagenham London Borough Council were elected. The elections took place alongside local elections in the other London boroughs and elections to local authorities across the United Kingdom.
The 2022 Ealing London Borough Council election took place on 5 May 2022, under new election boundaries, which increased the number of Ealing London Borough Council councillors to 70. The elections took place alongside local elections in the other London boroughs and elections to local authorities across the United Kingdom.
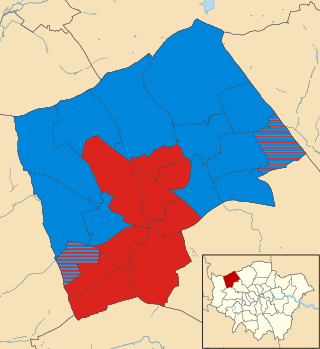
The 2022 Harrow London Borough Council election took place on 5 May 2022. All 55 members of Harrow London Borough Council were elected. The elections took place alongside local elections in the other London boroughs and elections to local authorities across the United Kingdom.
The 2022 Lambeth London Borough Council election took place on 5 May 2022. All 63 members of Lambeth London Borough Council were elected. The elections took place alongside local elections in the other London boroughs and elections to local authorities across the United Kingdom.
The 2023 Brighton and Hove City Council election took place on 4 May 2023 to elect members of Brighton and Hove City Council, England. This was at the same time as other local elections in England. Due to a boundary review, there was a change in ward boundaries, but the city council continued to comprise 54 members.