Borough result maps
 2002 results map
 2004 results map
 2006 results map
 2008 results map
 2010 results map
 2012 results map
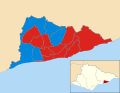 2014 results map
 2016 results map
 2018 results map
 2021 results map
 2022 results map
 2024 results map
Half of Hastings Borough Council in East Sussex, England is elected every two years, while before 2002 the council was elected by thirds. Since the last boundary changes in 2002, 32 councillors have been elected from 16 wards. [1] The Council was held by the Labour Party from 2010 [2] to 2022 when the elections returned a No Overall Control result, leading the Labour Party to form a coalition with the Green Party. This coalition broke down when 6 Labour Councillors resigned from the Labour Party and formed the Hastings Independent Group. Between January 2024 and the May 2024 elections the Council was led by an alliance between the Hastings Independent Group and the Green Party. The 2024 election returned a result of No Overall Control [3] and the Council is now minority led by the Green Party.
| Year | Conservative | Labour | Liberal Democrats [a] | Green | Independents & Others | Council control after election | ||
|---|---|---|---|---|---|---|---|---|
| Local government reorganisation; council established (33 seats) | ||||||||
| 1973 | 12 | 11 | 9 | – | 1 | No overall control | ||
| 1976 | 20 | 8 | 4 | 0 | 1 | Conservative | ||
| New ward boundaries (32 seats) [5] | ||||||||
| 1979 | 16 | 8 | 7 | 0 | 1 | Conservative | ||
| 1980 | 15 | 9 | 7 | 0 | 1 | No overall control | ||
| 1982 | 13 | 8 | 10 | 0 | 1 | No overall control | ||
| 1983 | 12 | 9 | 9 | 0 | 2 | No overall control | ||
| 1984 | 13 | 8 | 10 | 0 | 1 | No overall control | ||
| 1986 | 11 | 8 | 13 | 0 | 0 | No overall control | ||
| 1987 | 11 | 7 | 14 | 0 | 0 | No overall control | ||
| 1988 | 12 | 8 | 12 | 0 | 0 | No overall control | ||
| 1990 | 13 | 9 | 9 | 0 | 1 | No overall control | ||
| 1991 | 12 | 10 | 9 | 0 | 1 | No overall control | ||
| 1992 | 14 | 9 | 9 | 0 | 0 | No overall control | ||
| 1994 | 8 | 10 | 12 | 0 | 2 | No overall control | ||
| 1995 | 5 | 12 | 14 | 0 | 1 | No overall control | ||
| 1996 | 0 | 15 | 17 | 0 | 0 | Liberal Democrats | ||
| 1998 | 1 | 18 | 13 | 0 | 0 | Labour | ||
| 1999 | 2 | 18 | 12 | 0 | 0 | Labour | ||
| 2000 | 6 | 18 | 8 | 0 | 0 | Labour | ||
| New ward boundaries (32 seats) [6] | ||||||||
| 2002 | 10 | 21 | 1 | 0 | 0 | Labour | ||
| 2004 | 13 | 15 | 4 | 0 | 0 | No overall control | ||
| 2006 | 17 | 10 | 5 | 0 | 0 | Conservative | ||
| 2008 | 15 | 13 | 3 | 0 | 1 | No overall control | ||
| 2010 | 15 | 16 | 1 | 0 | 0 | No overall control | ||
| 2012 | 10 | 22 | 0 | 0 | 0 | Labour | ||
| 2014 | 8 | 24 | 0 | 0 | 0 | Labour | ||
| 2016 | 8 | 24 | 0 | 0 | 0 | Labour | ||
| New ward boundaries (32 seats) [7] | ||||||||
| 2018 | 8 | 24 | 0 | 0 | 0 | Labour | ||
| 2021 | 12 | 19 | 0 | 1 | 0 | Labour | ||
| 2022 | 12 | 15 | 0 | 5 | 0 | No overall control | ||
| 2024 | 5 | 8 | 0 | 12 | 7 | No overall control | ||


| Party | Candidate | Votes | % | ±% | |
|---|---|---|---|---|---|
| Liberal Democrats | 464 | 47.5 | +5.4 | ||
| Labour | 326 | 33.4 | +0.0 | ||
| Conservative | 104 | 10.6 | −9.8 | ||
| Liberal | 82 | 8.4 | +8.4 | ||
| Majority | 138 | 14.1 | |||
| Turnout | 976 | 27.0 | |||
| Liberal Democrats hold | Swing | ||||
| Party | Candidate | Votes | % | ±% | |
|---|---|---|---|---|---|
| Liberal Democrats | 479 | 40.3 | −11.9 | ||
| Conservative | 438 | 36.8 | +12.5 | ||
| Labour | 272 | 22.9 | −0.7 | ||
| Majority | 41 | 3.5 | |||
| Turnout | 1,189 | 25 | |||
| Liberal Democrats hold | Swing | ||||
| Party | Candidate | Votes | % | ±% | |
|---|---|---|---|---|---|
| Labour | 918 | 44.6 | +1.1 | ||
| Conservative | 670 | 32.6 | +17.2 | ||
| Liberal Democrats | 469 | 22.8 | −18.3 | ||
| Majority | 248 | 12.0 | |||
| Turnout | 2,057 | ||||
| Labour hold | Swing | ||||
| Party | Candidate | Votes | % | ±% | |
|---|---|---|---|---|---|
| Conservative | Gladys Martin | 504 | 37.6 | −4.4 | |
| Liberal Democrats | Colin Dormer | 294 | 21.9 | −0.7 | |
| Labour | John Ward | 274 | 20.4 | −2.4 | |
| Independent | Robert Harris | 253 | 18.9 | +6.4 | |
| Green | Kevin Young | 17 | 1.3 | +1.3 | |
| Majority | 210 | 15.7 | |||
| Turnout | 1,342 | 34.5 | |||
| Conservative hold | Swing | ||||
| Party | Candidate | Votes | % | ±% | |
|---|---|---|---|---|---|
| Labour | Andrew Cartwright | 516 | 34.2 | +8.0 | |
| Conservative | Simon Corello | 475 | 31.5 | −15.7 | |
| Liberal Democrats | Tricia Kennelly | 332 | 22.0 | +2.2 | |
| Green | Sally Phillips | 92 | 6.1 | −0.7 | |
| BNP | John Martin | 55 | 3.6 | +3.6 | |
| UKIP | Mick Turner | 38 | 2.5 | +2.5 | |
| Majority | 41 | 2.7 | |||
| Turnout | 1,508 | 37.8 | |||
| Labour gain from Conservative | Swing | ||||
| Party | Candidate | Votes | % | ±% | |
|---|---|---|---|---|---|
| Labour | Bruce Dowling | 555 | 39.2 | +4.5 | |
| Conservative | Matthew Lock | 482 | 34.1 | −9.1 | |
| Liberal Democrats | Mike Howard | 254 | 18.0 | −4.1 | |
| BNP | Nicholas Prince | 84 | 5.9 | +5.9 | |
| UKIP | Diane Granger | 40 | 2.8 | +2.8 | |
| Majority | 73 | 5.1 | |||
| Turnout | 1,415 | 41.9 | |||
| Labour gain from Conservative | Swing | ||||
| Party | Candidate | Votes | % | ±% | |
|---|---|---|---|---|---|
| Conservative | Simon Corello | 609 | 40.7 | −17.9 | |
| Labour | Michael Ward | 550 | 36.7 | −12.5 | |
| Liberal Democrats | John Tunbridge | 210 | 14.0 | −3.2 | |
| BNP | Stephen Weir | 93 | 6.2 | +6.2 | |
| English Democrat | Rod Bridger | 36 | 2.4 | +2.4 | |
| Majority | 59 | 4.0 | |||
| Turnout | 1,498 | 37.4 | |||
| Conservative hold | Swing | ||||
| Party | Candidate | Votes | % | ±% | |
|---|---|---|---|---|---|
| Labour | Terry Dowling | 481 | 44.0 | −9.1 | |
| Conservative | John Rankin | 259 | 23.7 | +10.9 | |
| Independent | Clive Gross | 184 | 16.8 | +9.4 | |
| UKIP | Kevin Hill | 77 | 7.0 | −8.8 | |
| Green | Alan Dixon | 75 | 6.9 | −0.9 | |
| Liberal Democrats | Susan Tait | 17 | 1.6 | −1.5 | |
| Majority | 222 | 20.3 | |||
| Turnout | 993 | ||||
| Labour hold | Swing | ||||
| Party | Candidate | Votes | % | ±% | |
|---|---|---|---|---|---|
| Conservative | Martin Clarke | 663 | 43.5 | +3.6 | |
| Labour | Graham Crane | 557 | 36.5 | +2.1 | |
| Liberal Democrats | Gary Spencer-Holmes | 135 | 8.9 | +5.0 | |
| UKIP | Kenneth Pankhurst | 120 | 7.9 | −13.9 | |
| Green | Christopher Petts | 48 | 3.1 | NA | |
| Majority | 106 | 7.0 | |||
| Turnout | 1523 | ||||
| Conservative hold | Swing | ||||