This article relies largely or entirely on a single source .(October 2024) |
![]() | |||||||||||||||||||||||||||||||||||||||||||||||
| |||||||||||||||||||||||||||||||||||||||||||||||
All 70 seats to East Sussex County Council 36 seats needed for a majority | |||||||||||||||||||||||||||||||||||||||||||||||
---|---|---|---|---|---|---|---|---|---|---|---|---|---|---|---|---|---|---|---|---|---|---|---|---|---|---|---|---|---|---|---|---|---|---|---|---|---|---|---|---|---|---|---|---|---|---|---|
Registered | 526,090 | ||||||||||||||||||||||||||||||||||||||||||||||
Turnout | 41.6% | ||||||||||||||||||||||||||||||||||||||||||||||
| |||||||||||||||||||||||||||||||||||||||||||||||
![]() Results map of the 1985 East Sussex County Council election. | |||||||||||||||||||||||||||||||||||||||||||||||
|
The 1985 East Sussex County Council election took place on 2 May 1985 to elect members to East Sussex County Council in East Sussex, England. This was on the same day as other local elections.
1985 East Sussex County Council election [1] | ||||||||||
---|---|---|---|---|---|---|---|---|---|---|
Party | Candidates | Seats | Gains | Losses | Net gain/loss | Seats % | Votes % | Votes | +/− | |
Conservative | 67 | 35 | 0 | 5 | ![]() | 50.0 | 42.4 | 92,754 | ||
Alliance | 65 | 21 | 3 | 2 | ![]() | 30.0 | 33.0 | 72,229 | ||
Labour | 60 | 14 | 4 | 0 | ![]() | 20.0 | 22.2 | 48,637 | ||
Residents | 2 | 0 | 0 | 0 | ![]() | 0.0 | 1.0 | 2,195 | ||
Independent | 5 | 0 | 0 | 0 | ![]() | 0.0 | 0.6 | 1,350 | ||
Ecology | 10 | 0 | 0 | 0 | ![]() | 0.0 | 0.6 | 1,217 | ||
Ind. Conservative | 1 | 0 | 0 | 0 | ![]() | 0.0 | 0.2 | 352 |
Party | Seats | +/- | Votes | % | +/- | |
---|---|---|---|---|---|---|
Labour | 10 | 21,487 | 43.6 | |||
Conservative | 4 | 17,338 | 35.2 | |||
Alliance | 1 | 10,099 | 20.5 | |||
Ecology | 0 | 323 | 0.7 | |||
Independent | 0 | 19 | <0.1 | |||
Total | 15 | 49,266 | 44.2 | |||
Registered electors | 111,337 | – |
Division results
Party | Candidate | Votes | % | ±% | |
---|---|---|---|---|---|
Labour | Roderick Fitch* | 2,282 | 55.5 | +24.6 | |
Alliance | K. Harwood | 1,353 | 32.9 | –24.0 | |
Conservative | J. Slaughter | 369 | 9.0 | –3.2 | |
Ecology | David Aherne | 108 | 2.6 | N/A | |
Majority | 929 | 22.6 | N/A | ||
Turnout | 4,112 | 47.4 | –11.1 | ||
Registered electors | 8,668 | ||||
Labour gain from Alliance |
Party | Candidate | Votes | % | ±% | |
---|---|---|---|---|---|
Labour | J. Robson | 1,846 | 57.2 | +4.6 | |
Conservative | L. Watts | 887 | 27.5 | –8.7 | |
Alliance | T. Hunter | 495 | 15.3 | +4.0 | |
Majority | 959 | 29.7 | +13.3 | ||
Turnout | 3,228 | 42.1 | –4.5 | ||
Registered electors | 7,668 | ||||
Labour hold | Swing | ![]() |
Party | Candidate | Votes | % | ±% | |
---|---|---|---|---|---|
Labour | H. Spillman* | 1,562 | 50.2 | +7.1 | |
Conservative | F. Deen | 1,160 | 37.3 | –12.9 | |
Alliance | M. Dennis | 388 | 12.5 | +5.8 | |
Majority | 402 | 12.9 | N/A | ||
Turnout | 3,110 | 46.7 | –1.9 | ||
Registered electors | 6,664 | ||||
Labour gain from Conservative | Swing | ![]() |
Party | Candidate | Votes | % | ||
---|---|---|---|---|---|
Labour | D. Turner* | 1,810 | 51.3 | ||
Conservative | G. Machen | 1,375 | 39.0 | ||
Alliance | K. Butcher | 343 | 9.7 | ||
Majority | 435 | 12.3 | |||
Turnout | 3,528 | 45.9 | |||
Registered electors | 7,694 | ||||
Labour win (new seat) |
Party | Candidate | Votes | % | ||
---|---|---|---|---|---|
Labour | E. Watson | 1,508 | 63.1 | ||
Conservative | J. Stevens | 621 | 26.0 | ||
Alliance | B. Meads | 261 | 10.9 | ||
Majority | 887 | 37.1 | |||
Turnout | 2,390 | 32.3 | |||
Registered electors | 7,390 | ||||
Labour win (new seat) |
Party | Candidate | Votes | % | ±% | |
---|---|---|---|---|---|
Conservative | G. Theobald | 2,029 | 53.4 | –4.6 | |
Labour | W. Scrace | 1,144 | 30.1 | +5.0 | |
Alliance | N. Cook | 629 | 16.5 | –0.5 | |
Majority | 885 | 23.3 | –9.6 | ||
Turnout | 3,802 | 53.0 | +11.1 | ||
Registered electors | 7,180 | ||||
Conservative hold | Swing | ![]() |
Party | Candidate | Votes | % | ±% | |
---|---|---|---|---|---|
Labour | K. Bodfish | 1,735 | 56.2 | +8.9 | |
Conservative | V. Dew | 869 | 28.2 | –14.3 | |
Alliance | A. Saunders | 379 | 12.3 | +2.1 | |
Ecology | S. Paskins | 102 | 3.3 | N/A | |
Majority | 866 | 28.1 | +23.3 | ||
Turnout | 3,085 | 47.4 | +2.4 | ||
Registered electors | 6,515 | ||||
Labour hold | Swing | ![]() |
Party | Candidate | Votes | % | ±% | |
---|---|---|---|---|---|
Labour | S. Cullen | 1,346 | 46.7 | +30.1 | |
Conservative | Michael Fabricant | 1,135 | 39.4 | –12.1 | |
Alliance | A. Cole | 403 | 14.0 | –17.9 | |
Majority | 211 | 7.3 | N/A | ||
Turnout | 2,884 | 42.5 | +4.1 | ||
Registered electors | 6,787 | ||||
Labour gain from Conservative | Swing | ![]() |
Party | Candidate | Votes | % | ±% | |
---|---|---|---|---|---|
Conservative | J. Mont | 2,365 | 58.8 | –1.7 | |
Alliance | R. Dore | 1,337 | 33.3 | +4.1 | |
Labour | B. Jones | 319 | 7.9 | –2.4 | |
Majority | 1,028 | 25.6 | –5.7 | ||
Turnout | 4,021 | 51.9 | –1.2 | ||
Registered electors | 7,754 | ||||
Conservative hold | Swing | ![]() |
Party | Candidate | Votes | % | ||
---|---|---|---|---|---|
Alliance | David Rogers* | 1,387 | 44.5 | ||
Labour | F. Tonks | 940 | 30.2 | ||
Conservative | P. Mallard | 769 | 24.7 | ||
Independent | G. O'Brien | 19 | 0.6 | ||
Majority | 447 | 14.3 | |||
Turnout | 3,115 | 43.3 | |||
Registered electors | 7,189 | ||||
Alliance win (new seat) |
Party | Candidate | Votes | % | ±% | |
---|---|---|---|---|---|
Labour | M. Farmer | 1,526 | 45.4 | –1.5 | |
Conservative | W. Brandon | 880 | 26.2 | –17.0 | |
Alliance | J. Guyer | 842 | 25.1 | +15.2 | |
Ecology | R. Nicklin | 113 | 3.4 | N/A | |
Majority | 646 | 19.2 | +15.5 | ||
Turnout | 3,361 | 46.7 | –1.4 | ||
Registered electors | 7,202 | ||||
Labour hold | Swing | ![]() |
Party | Candidate | Votes | % | ±% | |
---|---|---|---|---|---|
Labour | D. Hill* | 1,918 | 58.0 | +3.4 | |
Conservative | D. Fairhall | 938 | 28.4 | +4.7 | |
Alliance | D. McBeth | 451 | 13.6 | –8.1 | |
Majority | 980 | 29.6 | N/A | ||
Turnout | 3,307 | 42.9 | +8.4 | ||
Registered electors | 7,703 | ||||
Labour hold | Swing | ![]() |
Party | Candidate | Votes | % | ||
---|---|---|---|---|---|
Labour | S. Charleton | 1,656 | 59.1 | ||
Conservative | J. Payne | 697 | 24.9 | ||
Alliance | M. Gare-Simmons | 451 | 16.1 | ||
Majority | 959 | 34.2 | |||
Turnout | 2,804 | 36.9 | |||
Registered electors | 7,608 | ||||
Labour win (new seat) |
Party | Candidate | Votes | % | ||
---|---|---|---|---|---|
Conservative | P. Drake* | 1,616 | 51.7 | ||
Alliance | D. Roberts | 887 | 28.4 | ||
Labour | F. Spicer | 624 | 20.0 | ||
Majority | 729 | 23.3 | |||
Turnout | 3,127 | 42.3 | |||
Registered electors | 7,393 | ||||
Conservative win (new seat) |
Party | Candidate | Votes | % | ||
---|---|---|---|---|---|
Conservative | B. Thomas | 1,628 | 48.0 | ||
Labour | L. Williams | 1,271 | 37.5 | ||
Alliance | M. Rutherford | 493 | 14.5 | ||
Majority | 357 | 10.5 | |||
Turnout | 3,392 | 42.8 | |||
Registered electors | 7,922 | ||||
Conservative win (new seat) |
Party | Seats | +/- | Votes | % | +/- | |
---|---|---|---|---|---|---|
Alliance | 5 | 13,687 | 49.6 | |||
Conservative | 3 | 11,337 | 41.1 | |||
Labour | 0 | 2,579 | 9.3 | |||
Total | 8 | 27,603 | 44.3 | |||
Registered electors | 62,355 | – |
Division results
Party | Candidate | Votes | % | ||
---|---|---|---|---|---|
Alliance | J. Healy* | 2,389 | 65.0 | ||
Conservative | E. Etches | 924 | 25.1 | ||
Labour | B. Earley | 362 | 9.9 | ||
Majority | 1,465 | 39.9 | |||
Turnout | 3,675 | 43.3 | |||
Registered electors | 8,487 | ||||
Alliance win (new seat) |
Party | Candidate | Votes | % | ||
---|---|---|---|---|---|
Conservative | A. Vickers* | 2,470 | 76.5 | ||
Alliance | P. Nicholls | 758 | 23.5 | ||
Majority | 1,712 | 53.0 | |||
Turnout | 3,228 | 42.2 | |||
Registered electors | 7,654 | ||||
Conservative win (new seat) |
Party | Candidate | Votes | % | ||
---|---|---|---|---|---|
Alliance | M. Skilton | 2,100 | 56.9 | ||
Conservative | D. Townsend | 1,234 | 33.4 | ||
Labour | D. Evans | 358 | 9.7 | ||
Majority | 866 | 23.5 | |||
Turnout | 3,692 | 46.9 | |||
Registered electors | 7,874 | ||||
Alliance win (new seat) |
Party | Candidate | Votes | % | ||
---|---|---|---|---|---|
Alliance | P. Hearn* | 1,510 | 44.7 | ||
Labour | P. Day | 1,271 | 37.7 | ||
Conservative | E. Juniper | 594 | 17.6 | ||
Majority | 239 | 7.1 | |||
Turnout | 3,375 | 43.9 | |||
Registered electors | 7,692 | ||||
Alliance win (new seat) |
Party | Candidate | Votes | % | ||
---|---|---|---|---|---|
Alliance | J. Grist | 1,684 | 52.2 | ||
Conservative | C. Butler | 1,171 | 36.3 | ||
Labour | M. Kidd | 369 | 11.4 | ||
Majority | 513 | 15.9 | |||
Turnout | 3,224 | 45.0 | |||
Registered electors | 7,162 | ||||
Alliance win (new seat) |
Party | Candidate | Votes | % | ||
---|---|---|---|---|---|
Alliance | D. Tutt* | 2,405 | 68.1 | ||
Conservative | J. Waghorne | 906 | 25.7 | ||
Labour | H. Turner | 219 | 6.2 | ||
Majority | 1,499 | 42.5 | |||
Turnout | 3,530 | 44.9 | |||
Registered electors | 7,870 | ||||
Alliance win (new seat) |
Party | Candidate | Votes | % | ||
---|---|---|---|---|---|
Conservative | U. Gardner* | 1,747 | 61.3 | ||
Alliance | P. Durrant | 1,103 | 38.7 | ||
Majority | 644 | 22.6 | |||
Turnout | 2,850 | 36.8 | |||
Registered electors | 7,752 | ||||
Conservative win (new seat) |
Party | Candidate | Votes | % | ||
---|---|---|---|---|---|
Conservative | M. Tunwell* | 2,291 | 56.9 | ||
Alliance | Theresia Williamson | 1,738 | 43.1 | ||
Majority | 553 | 13.7 | |||
Turnout | 4,029 | 51.2 | |||
Registered electors | 7,864 | ||||
Conservative win (new seat) |
Party | Seats | +/- | Votes | % | +/- | |
---|---|---|---|---|---|---|
Alliance | 5 | 8,355 | 42.4 | |||
Labour | 1 | 5,854 | 29.7 | |||
Conservative | 1 | 5,325 | 27.0 | |||
Ecology | 0 | 111 | 0.6 | |||
Independent | 0 | 72 | 0.4 | |||
Total | 7 | 19,717 | 36.8 | |||
Registered electors | 53,575 | – |
Division results
Party | Candidate | Votes | % | ||
---|---|---|---|---|---|
Alliance | Pam Brown* | 1,316 | 53.1 | ||
Conservative | F. Parrott | 631 | 25.5 | ||
Labour | J. Dawes | 531 | 21.4 | ||
Majority | 685 | 27.6 | |||
Turnout | 2,478 | 35.1 | |||
Registered electors | 7,052 | ||||
Alliance win (new seat) |
Party | Candidate | Votes | % | ||
---|---|---|---|---|---|
Alliance | C. Bourner | 1,472 | 48.0 | ||
Labour | Richard Stevens | 1,028 | 33.6 | ||
Conservative | J. Marshall | 564 | 18.4 | ||
Majority | 444 | 14.5 | |||
Turnout | 3,064 | 40.6 | |||
Registered electors | 7,540 | ||||
Alliance win (new seat) |
Party | Candidate | Votes | % | ||
---|---|---|---|---|---|
Alliance | Jane Amstad | 1,157 | 43.5 | ||
Conservative | F. Wenham* | 918 | 34.5 | ||
Labour | Charles Clark | 403 | 15.1 | ||
Ecology | P. Buswell | 111 | 4.2 | ||
Independent | J. Wheatley | 72 | 2.7 | ||
Majority | 239 | 9.0 | |||
Turnout | 2,661 | 35.1 | |||
Registered electors | 7,573 | ||||
Alliance win (new seat) |
Party | Candidate | Votes | % | ||
---|---|---|---|---|---|
Labour | Michael Foster* | 1,420 | 49.1 | ||
Conservative | J. Holden | 818 | 28.3 | ||
Alliance | D. Simpson | 655 | 22.6 | ||
Majority | 602 | 20.8 | |||
Turnout | 2,893 | 40.8 | |||
Registered electors | 7,090 | ||||
Labour win (new seat) |
Party | Candidate | Votes | % | ||
---|---|---|---|---|---|
Alliance | M. Hall | 1,336 | 42.2 | ||
Labour | T. Soan | 953 | 30.1 | ||
Conservative | J. Clayton | 879 | 27.7 | ||
Majority | 383 | 12.1 | |||
Turnout | 3,168 | 41.6 | |||
Registered electors | 7,607 | ||||
Alliance win (new seat) |
Party | Candidate | Votes | % | ||
---|---|---|---|---|---|
Alliance | Paul Smith* | 1,697 | 61.2 | ||
Labour | H. Duale | 1,078 | 38.8 | ||
Majority | 619 | 22.3 | |||
Turnout | 2,775 | 32.9 | |||
Registered electors | 8,424 | ||||
Alliance win (new seat) |
Party | Candidate | Votes | % | ||
---|---|---|---|---|---|
Conservative | J. Hodgson* | 1,515 | 56.6 | ||
Alliance | C. Hughes | 722 | 27.0 | ||
Labour | S. Nester | 441 | 16.5 | ||
Majority | 793 | 29.6 | |||
Turnout | 2,678 | 32.3 | |||
Registered electors | 8,289 | ||||
Conservative win (new seat) |
Party | Seats | +/- | Votes | % | +/- | |
---|---|---|---|---|---|---|
Conservative | 6 | 11,831 | 44.3 | |||
Alliance | 2 | 7,800 | 29.2 | |||
Labour | 2 | 6,591 | 24.7 | |||
Ind. Conservative | 0 | 352 | 1.3 | |||
Ecology | 0 | 112 | 0.4 | |||
Total | 10 | 26,686 | 36.9 | |||
Registered electors | 72,348 | – |
Division results
Party | Candidate | Votes | % | ||
---|---|---|---|---|---|
Alliance | B. Bailey* | 1,888 | 65.0 | ||
Conservative | S. Gillies | 426 | 14.7 | ||
Ind. Conservative | B. Dunmore | 352 | 12.1 | ||
Labour | D. Robinson | 239 | 8.2 | ||
Majority | 1,462 | 50.3 | |||
Turnout | 2,905 | 37.1 | |||
Registered electors | 7,821 | ||||
Alliance win (new seat) |
Party | Candidate | Votes | % | ±% | |
---|---|---|---|---|---|
Conservative | A. White* | 1,592 | 59.8 | –12.2 | |
Alliance | R. Bates | 634 | 23.8 | +8.8 | |
Labour | A. Richards | 434 | 16.3 | +3.3 | |
Majority | 958 | 36.0 | –21.1 | ||
Turnout | 2,660 | 34.9 | +2.2 | ||
Registered electors | 7,632 | ||||
Conservative hold | Swing | ![]() |
Party | Candidate | Votes | % | ±% | |
---|---|---|---|---|---|
Conservative | W. Williams* | 1,037 | 47.9 | –0.8 | |
Labour | M. Robinson | 736 | 34.0 | –3.4 | |
Alliance | C. Furness | 390 | 18.0 | +4.1 | |
Majority | 301 | 13.9 | +2.7 | ||
Turnout | 2,163 | 30.9 | –3.2 | ||
Registered electors | 7,010 | ||||
Conservative hold | Swing | ![]() |
Party | Candidate | Votes | % | ||
---|---|---|---|---|---|
Conservative | J. Marshall* | 1,599 | 65.1 | ||
Labour | G. Earl | 466 | 19.0 | ||
Alliance | A. Gale | 391 | 15.9 | ||
Majority | 1,133 | 46.1 | |||
Turnout | 2,456 | 36.7 | |||
Registered electors | 6,698 | ||||
Conservative win (new seat) |
Party | Candidate | Votes | % | ±% | |
---|---|---|---|---|---|
Labour | L. Hamilton* | 1,631 | 61.9 | –3.6 | |
Conservative | A. Burton | 735 | 27.9 | ±0.0 | |
Alliance | D. Hirst | 269 | 10.2 | +4.4 | |
Majority | 896 | 34.0 | –3.7 | ||
Turnout | 2,635 | 37.8 | –7.7 | ||
Registered electors | 6,962 | ||||
Labour hold | Swing | ![]() |
Party | Candidate | Votes | % | ±% | |
---|---|---|---|---|---|
Labour | Donald Turner | 1,252 | 40.0 | +13.2 | |
Alliance | Mathew Huntbach | 950 | 30.3 | –15.7 | |
Conservative | B. Greenway | 931 | 29.7 | +3.5 | |
Majority | 302 | 9.6 | N/A | ||
Turnout | 3,133 | 43.0 | –3.5 | ||
Registered electors | 7,289 | ||||
Labour gain from Alliance | Swing | ![]() |
Party | Candidate | Votes | % | ±% | |
---|---|---|---|---|---|
Conservative | C. Exley | 1,725 | 73.1 | –9.9 | |
Alliance | S. Bucknall | 463 | 19.6 | +8.1 | |
Labour | J. Stacey | 173 | 7.3 | +1.8 | |
Majority | 1,262 | 53.5 | –18.0 | ||
Turnout | 2,361 | 35.0 | –5.1 | ||
Registered electors | 6,754 | ||||
Conservative hold | Swing | ![]() |
Party | Candidate | Votes | % | ±% | |
---|---|---|---|---|---|
Conservative | S. Stevens | 1,294 | 51.2 | –12.2 | |
Labour | C. Hopper | 752 | 29.8 | +14.0 | |
Alliance | R. Bagnall | 435 | 17.2 | –3.6 | |
Ecology | A. Sparkes | 45 | 1.8 | N/A | |
Majority | 542 | 21.5 | –21.1 | ||
Turnout | 2,526 | 33.9 | +0.9 | ||
Registered electors | 7,447 | ||||
Conservative hold | Swing | ![]() |
Party | Candidate | Votes | % | ±% | |
---|---|---|---|---|---|
Alliance | M. Randall | 1,587 | 48.7 | +33.2 | |
Conservative | R. Ireland* | 1,241 | 38.0 | –26.3 | |
Labour | J. Naysmith | 367 | 11.3 | –8.9 | |
Ecology | M. Dixon | 67 | 2.1 | N/A | |
Majority | 346 | 10.6 | N/A | ||
Turnout | 3,262 | 43.6 | +8.5 | ||
Registered electors | 7,489 | ||||
Alliance gain from Conservative | Swing | ![]() |
Party | Candidate | Votes | % | ±% | |
---|---|---|---|---|---|
Conservative | A. Rowe | 1,251 | 48.4 | –23.2 | |
Alliance | A. Percy | 793 | 30.7 | +16.5 | |
Labour | I. Caplin | 541 | 20.9 | +6.7 | |
Majority | 458 | 17.7 | –39.7 | ||
Turnout | 2,585 | 35.7 | –3.5 | ||
Registered electors | 7,246 | ||||
Conservative hold | Swing | ![]() |
Party | Seats | +/- | Votes | % | +/- | |
---|---|---|---|---|---|---|
Conservative | 5 | 12,363 | 41.6 | |||
Alliance | 3 | 10,968 | 36.9 | |||
Labour | 0 | 5,186 | 17.5 | |||
Ecology | 0 | 671 | 2.3 | |||
Independent | 0 | 523 | 1.8 | |||
Total | 8 | 29,711 | 45.4 | |||
Registered electors | 65,399 | – |
Division results
Party | Candidate | Votes | % | ||
---|---|---|---|---|---|
Conservative | S. Whitley | 1,854 | 56.0 | ||
Alliance | P. Ebert | 1,454 | 44.0 | ||
Majority | 400 | 12.1 | |||
Turnout | 3,308 | 38.2 | |||
Registered electors | 8,649 | ||||
Conservative win (new seat) |
Party | Candidate | Votes | % | ||
---|---|---|---|---|---|
Alliance | D. Venables | 1,713 | 34.7 | ||
Conservative | D. Monnington* | 1,491 | 30.2 | ||
Labour | J. Jacobs | 1,486 | 30.1 | ||
Ecology | G. Taylor | 241 | 4.9 | ||
Majority | 222 | 4.5 | |||
Turnout | 4,931 | 61.1 | |||
Registered electors | 8,073 | ||||
Alliance win (new seat) |
Party | Candidate | Votes | % | ±% | |
---|---|---|---|---|---|
Conservative | P. Harwood | 1,451 | 43.7 | +1.1 | |
Labour | L. Lamont | 1,246 | 37.5 | –4.6 | |
Alliance | R. Philp | 470 | 14.2 | –1.2 | |
Independent | P. Allen | 153 | 4.6 | N/A | |
Majority | 205 | 6.2 | +5.7 | ||
Turnout | 3,320 | 43.0 | +4.1 | ||
Registered electors | 7,722 | ||||
Conservative hold | Swing | ![]() |
Party | Candidate | Votes | % | ±% | |
---|---|---|---|---|---|
Conservative | L. Vince | 1,586 | 42.5 | –4.2 | |
Alliance | G. Wagstaff | 1,074 | 28.8 | +13.3 | |
Labour | R. Weatherhead | 1,069 | 28.7 | –9.1 | |
Majority | 512 | 13.7 | +4.8 | ||
Turnout | 3,729 | 38.9 | +0.9 | ||
Registered electors | 9,575 | ||||
Conservative hold | Swing | ![]() |
Party | Candidate | Votes | % | ||
---|---|---|---|---|---|
Alliance | David Bellotti* | 2,609 | 57.9 | ||
Conservative | R. Vigars | 1,175 | 26.1 | ||
Labour | M. Woodling | 582 | 12.9 | ||
Ecology | J. Denis | 142 | 3.1 | ||
Majority | 1,434 | 31.8 | |||
Turnout | 4,508 | 56.1 | |||
Registered electors | 8,033 | ||||
Alliance win (new seat) |
Party | Candidate | Votes | % | ±% | |
---|---|---|---|---|---|
Alliance | J. Martin | 1,774 | 52.2 | +23.8 | |
Conservative | L. Preddy* | 1,627 | 47.8 | –11.5 | |
Majority | 147 | 4.3 | N/A | ||
Turnout | 3,401 | 42.4 | –0.4 | ||
Registered electors | 8,024 | ||||
Alliance gain from Conservative | Swing | ![]() |
Party | Candidate | Votes | % | ±% | |
---|---|---|---|---|---|
Conservative | N. Mackilligin* | 1,755 | 49.9 | –9.9 | |
Alliance | A. Stiles | 962 | 27.3 | –1.3 | |
Independent | L. Williams | 370 | 10.5 | N/A | |
Labour | Alison Chapman | 298 | 8.5 | –3.0 | |
Ecology | A. Long | 133 | 3.8 | N/A | |
Majority | 793 | 22.5 | –8.7 | ||
Turnout | 3,518 | 45.4 | +1.0 | ||
Registered electors | 7,743 | ||||
Conservative hold | Swing | ![]() |
Party | Candidate | Votes | % | ±% | |
---|---|---|---|---|---|
Conservative | J. Lovill* | 1,424 | 47.5 | –8.1 | |
Alliance | P. Cook | 912 | 30.4 | +10.7 | |
Labour | T. Mayo | 505 | 16.9 | –7.8 | |
Ecology | M. Ryle | 155 | 5.2 | N/A | |
Majority | 512 | 17.1 | –13.8 | ||
Turnout | 2,996 | 39.5 | –3.4 | ||
Registered electors | 7,580 | ||||
Conservative hold | Swing | ![]() |
Party | Seats | +/- | Votes | % | +/- | |
---|---|---|---|---|---|---|
Conservative | 5 | 14,548 | 53.5 | |||
Alliance | 2 | 7,148 | 26.3 | |||
Labour | 1 | 3,445 | 12.7 | |||
Residents | 0 | 1,298 | 4.8 | |||
Independent | 0 | 736 | 2.7 | |||
Total | 8 | 27,175 | 42.7 | |||
Registered electors | 63,647 | – |
Division results
Party | Candidate | Votes | % | ±% | |
---|---|---|---|---|---|
Alliance | David Amies* | 1,960 | 53.3 | +1.8 | |
Conservative | A. Robertson | 1,718 | 46.7 | –1.8 | |
Majority | 242 | 6.6 | +3.6 | ||
Turnout | 3,678 | 47.4 | +3.4 | ||
Registered electors | 7,763 | ||||
Alliance hold | Swing | ![]() |
Party | Candidate | Votes | % | ±% | |
---|---|---|---|---|---|
Conservative | D. Kimber* | 1,344 | 47.0 | +1.1 | |
Residents | M .Traice | 1,298 | 45.4 | +0.9 | |
Labour | S. Tickner | 220 | 7.7 | –2.0 | |
Majority | 46 | 1.6 | +0.2 | ||
Turnout | 2,862 | 40.2 | –6.1 | ||
Registered electors | 7,119 | ||||
Conservative hold | Swing | ![]() |
Party | Candidate | Votes | % | ±% | |
---|---|---|---|---|---|
Labour | A. Ottley | 1,628 | 57.1 | –10.3 | |
Conservative | E. Nichols | 1,221 | 42.9 | +10.3 | |
Majority | 407 | 14.3 | –20.6 | ||
Turnout | 2,849 | 37.7 | –8.2 | ||
Registered electors | 7,555 | ||||
Labour hold | Swing | ![]() |
Party | Candidate | Votes | % | ±% | |
---|---|---|---|---|---|
Conservative | E. Prior | 2,310 | 66.5 | –3.3 | |
Independent | J. Day | 736 | 21.2 | N/A | |
Labour | S. Gover | 429 | 12.3 | N/A | |
Majority | 1,574 | 45.3 | +5.7 | ||
Turnout | 3,47 | 42.0 | +0.7 | ||
Registered electors | 8,283 | ||||
Conservative hold |
Party | Candidate | Votes | % | ±% | |
---|---|---|---|---|---|
Conservative | I. Brampton* | 2,474 | 65.6 | –1.6 | |
Alliance | M. Johnson | 1,011 | 26.8 | N/A | |
Labour | M. Alexander | 288 | 7.6 | N/A | |
Majority | 1,463 | 38.8 | +4.4 | ||
Turnout | 3,773 | 44.4 | –8.3 | ||
Registered electors | 8,507 | ||||
Conservative hold |
Party | Candidate | Votes | % | ±% | |
---|---|---|---|---|---|
Conservative | Joan Yates* | 2,015 | 57.2 | –12.4 | |
Alliance | D. Goggin | 1,013 | 28.8 | N/A | |
Labour | S. Ungar | 495 | 14.1 | N/A | |
Majority | 1,002 | 28.4 | –10.7 | ||
Turnout | 3,523 | 44.4 | +6.2 | ||
Registered electors | 7,929 | ||||
Conservative hold |
Party | Candidate | Votes | % | ±% | |
---|---|---|---|---|---|
Alliance | Ann Moore* | 1,960 | 54.4 | +19.2 | |
Conservative | J. Logan | 1,641 | 45.6 | –19.2 | |
Majority | 319 | 8.9 | N/A | ||
Turnout | 3,601 | 44.7 | +3.9 | ||
Registered electors | 8,056 | ||||
Alliance gain from Conservative | Swing | ![]() |
Party | Candidate | Votes | % | ±% | |
---|---|---|---|---|---|
Conservative | R. Bramley* | 1,825 | 53.5 | –2.9 | |
Alliance | John Lutman | 1,204 | 35.3 | –8.3 | |
Labour | B. Champion | 385 | 11.3 | N/A | |
Majority | 621 | 18.2 | +5.3 | ||
Turnout | 3,414 | 40.5 | –2.9 | ||
Registered electors | 8,435 | ||||
Conservative hold | Swing | ![]() |
Party | Seats | +/- | Votes | % | +/- | |
---|---|---|---|---|---|---|
Conservative | 11 | 20,012 | 51.9 | |||
Liberal Democrats | 1 | 14,172 | 36.7 | |||
Labour | 0 | 3,495 | 9.1 | |||
Residents | 0 | 897 | 2.3 | |||
Total | 12 | 38,576 | 39.6 | |||
Registered electors | 97,429 | – |
Division results
Party | Candidate | Votes | % | ||
---|---|---|---|---|---|
Conservative | D. Cumming | 1,953 | 59.9 | ||
Alliance | D. Synge | 1,082 | 33.2 | ||
Labour | S. Cliff | 224 | 6.9 | ||
Majority | 871 | 26.7 | |||
Turnout | 3,259 | 37.3 | |||
Registered electors | 8,733 | ||||
Conservative win (new seat) |
Party | Candidate | Votes | % | ||
---|---|---|---|---|---|
Conservative | D. Russell* | 1,313 | 47.7 | ||
Alliance | Paul Scott | 1,173 | 42.6 | ||
Labour | M. Streeter | 265 | 9.6 | ||
Majority | 140 | 5.1 | |||
Turnout | 2,751 | 34.5 | |||
Registered electors | 7,976 | ||||
Conservative win (new seat) |
Party | Candidate | Votes | % | ||
---|---|---|---|---|---|
Conservative | F. Edmonds | 1,563 | 50.5 | ||
Alliance | P. Whittington | 1,299 | 42.0 | ||
Labour | A. Salmon | 230 | 7.4 | ||
Majority | 264 | 8.5 | |||
Turnout | 3,092 | 36.8 | |||
Registered electors | 8,400 | ||||
Conservative win (new seat) |
Party | Candidate | Votes | % | ±% | |
---|---|---|---|---|---|
Conservative | O. Hughes | 1,464 | 55.9 | –7.7 | |
Alliance | C. Munday | 979 | 37.4 | +11.1 | |
Labour | J. Windebank | 178 | 6.8 | –3.3 | |
Majority | 485 | 18.5 | –18.8 | ||
Turnout | 2,621 | 38.5 | –3.9 | ||
Registered electors | 6,807 | ||||
Conservative win (new seat) |
Party | Candidate | Votes | % | ±% | |
---|---|---|---|---|---|
Conservative | B. Gray | 1,058 | 46.3 | –1.2 | |
Alliance | T. Stanford | 699 | 30.6 | +0.7 | |
Labour | D. Rose | 528 | 23.1 | +0.5 | |
Majority | 359 | 15.7 | –1.9 | ||
Turnout | 2,285 | 32.4 | –3.5 | ||
Registered electors | 7,058 | ||||
Conservative hold | Swing | ![]() |
Party | Candidate | Votes | % | ±% | |
---|---|---|---|---|---|
Conservative | H. Hatcher | 2,317 | 55.7 | –9.1 | |
Alliance | Robert Kiernan | 1,530 | 36.8 | +14.2 | |
Labour | B. Waters | 313 | 7.5 | –5.1 | |
Majority | 787 | 18.9 | –23.2 | ||
Turnout | 4,160 | 42.4 | +2.1 | ||
Registered electors | 9,820 | ||||
Conservative hold | Swing | ![]() |
Party | Candidate | Votes | % | ±% | |
---|---|---|---|---|---|
Conservative | C. Kelly* | 1,417 | 49.8 | –9.1 | |
Alliance | A. Cameron | 1,043 | 36.7 | +6.2 | |
Labour | G. Hayward | 383 | 13.5 | +2.9 | |
Majority | 374 | 13.2 | –3.1 | ||
Turnout | 2,843 | 34.9 | +4.9 | ||
Registered electors | 8,153 | ||||
Conservative hold | Swing | ![]() |
Party | Candidate | Votes | % | ±% | |
---|---|---|---|---|---|
Conservative | G. Hart* | 1,962 | 55.7 | –7.4 | |
Alliance | M. Pensten | 1,563 | 44.3 | +16.6 | |
Majority | 399 | 11.3 | –24.2 | ||
Turnout | 3,525 | 41.4 | –1.8 | ||
Registered electors | 8,523 | ||||
Conservative hold | Swing | ![]() |
Party | Candidate | Votes | % | ±% | |
---|---|---|---|---|---|
Conservative | C. Brewer | 1,240 | 34.5 | –27.8 | |
Alliance | R. Kirtley | 1,095 | 30.5 | +10.3 | |
Residents | D. Manton | 897 | 25.0 | N/A | |
Labour | R. Booth | 361 | 10.0 | –7.5 | |
Majority | 145 | 4.0 | –38.1 | ||
Turnout | 3,593 | 44.0 | +0.4 | ||
Registered electors | 8,166 | ||||
Conservative hold | Swing | ![]() |
Party | Candidate | Votes | % | ±% | |
---|---|---|---|---|---|
Alliance | M. Wigglesworth* | 1,947 | 51.2 | –3.6 | |
Conservative | J. Fordham | 1,496 | 39.3 | +2.2 | |
Labour | J. Sones | 363 | 9.5 | +1.5 | |
Majority | 451 | 11.8 | –6.1 | ||
Turnout | 3,806 | 45.8 | –1.8 | ||
Registered electors | 8,307 | ||||
Alliance hold | Swing | ![]() |
Party | Candidate | Votes | % | ±% | |
---|---|---|---|---|---|
Conservative | M. Wright* | 1,840 | 59.3 | –2.3 | |
Alliance | J. Brinton | 1,008 | 32.5 | +10.8 | |
Labour | D. White | 253 | 8.2 | –8.5 | |
Majority | 832 | 26.8 | –13.1 | ||
Turnout | 3,101 | 41.9 | +2.2 | ||
Registered electors | 7,394 | ||||
Conservative hold | Swing | ![]() |
Party | Candidate | Votes | % | ±% | |
---|---|---|---|---|---|
Conservative | J. Chatfield* | 2,389 | 67.5 | +1.0 | |
Alliance | H. Gundry | 754 | 21.3 | +2.2 | |
Labour | G. Page | 397 | 11.2 | +1.3 | |
Majority | 1,635 | 46.2 | –1.1 | ||
Turnout | 3,540 | 43.7 | –3.7 | ||
Registered electors | 8,092 | ||||
Conservative hold | Swing | ![]() |
West Sussex County Council in England is elected every four years.
East Sussex County Council in England is elected every four years.
East Sussex County Council is the upper tier local authority for the non-metropolitan county of East Sussex in England. The non-metropolitan county is smaller than the ceremonial county; the latter additionally includes Brighton and Hove.
West Sussex County Council is the upper tier local authority for the non-metropolitan county of West Sussex in England.
Bognor Regis East is an electoral division of West Sussex in the United Kingdom and returns one member to sit on West Sussex County Council.
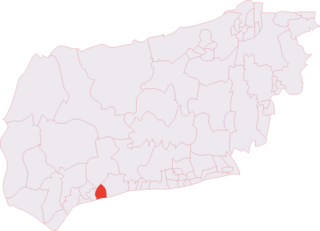
Chichester East is an electoral division of West Sussex in the United Kingdom, and returns one member to sit on West Sussex County Council.
Chichester North is an electoral division of West Sussex in the United Kingdom, and returns one member to sit on West Sussex County Council.
East Grinstead Meridian is an electoral division of West Sussex in the United Kingdom, and returns one member to sit on West Sussex County Council.
East Grinstead South & Ashurst Wood is an electoral division of West Sussex in the United Kingdom, and returns one member to sit on West Sussex County Council.
East Preston & Ferring is an electoral division of West Sussex in the United Kingdom and returns one member to sit on West Sussex County Council. The current County Councillor, Peter Evans, is also Cabinet Member for Public Protection.
Felpham is an electoral division of West Sussex in the United Kingdom and returns one member to sit on West Sussex County Council.
Haywards Heath East is an electoral division of West Sussex in the United Kingdom, and returns one member to sit on West Sussex County Council.
Holbrook is an electoral division of West Sussex in the United Kingdom and returns one member to sit on West Sussex County Council. The current County Councillor, Peter Catchpole, is also Cabinet Member for Adults' Services.
Imberdown is an electoral division of West Sussex in the United Kingdom, and returns one member to sit on West Sussex County Council.
Littlehampton East is an electoral division of West Sussex in the United Kingdom and returns one member to sit on West Sussex County Council.
Rustington is an electoral division of West Sussex in England and returns one member to sit on West Sussex County Council.
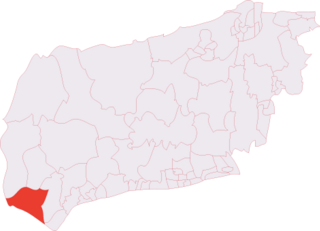
The Witterings is an electoral division of West Sussex in the United Kingdom, and returns one member to sit on West Sussex County Council.
Worthing East is an electoral division of West Sussex in the United Kingdom, and returns one member to sit on West Sussex County Council.
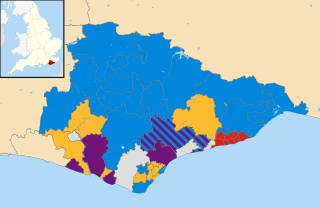
The East Sussex County Council election, 2013 took place on 2 May 2013 as part of the 2013 United Kingdom local elections. All 49 councillors of East Sussex County Council were elected from 44 electoral divisions, which return either one or two councillors each by first-past-the-post voting for a four-year term of office. The electoral divisions were the same as those used at the previous election in 2009. No elections were held in Brighton and Hove, which is a unitary authority outside the area covered by the County Council.
The 2021 East Sussex County Council election took place alongside the other local elections. All 50 seats to East Sussex County Council were up for election.