District result maps
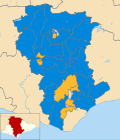 2003 results map
 2007 results map
 2011 results map
 2015 results map
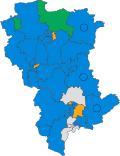 2019 results map
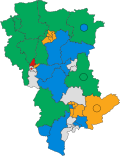 2023 results map
Wealden District Council in East Sussex, England is elected every four years. From 2003 until the election in 2019, 55 councillors were elected from 35 wards. From 2019, 45 councillors have been elected from 41 wards. [1]
Since the first election to the council in 1973 political control of the council has been held by the following parties: [2]
| Party in control | Years | |
|---|---|---|
| Conservative | 1973–1995 | |
| No overall control | 1995–1997 | |
| Conservative | 1997–2023 | |
| No overall control | 2023-present | |
The leaders of the council since 2001 have been: [3]
| Councillor | Party | From | To | |
|---|---|---|---|---|
| Rupert Thornely-Taylor | Conservative | 18 Jul 2001 | 4 May 2003 | |
| Nigel Coltman | Conservative | 21 May 2003 | 6 May 2007 | |
| Pam Doodes | Conservative | 23 May 2007 | 19 May 2010 | |
| Bob Standley | Conservative | 19 May 2010 | 18 May 2022 | |
| Ann Newton | Conservative | 18 May 2022 | 18 May 2023 | |
| James Partridge | Liberal Democrats | 18 May 2023 | Present | |
The table below shows the composition of seats held on the council directly after each election. Click on the year for full details of each election.
| Year | Conservative | Liberal Democrats [a] | Green | Labour | Independents & Others | Council control after election | ||
|---|---|---|---|---|---|---|---|---|
| Local government reorganisation; council established (56 seats) | ||||||||
| 1973 | 29 | 3 | – | 1 | 23 | Conservative | ||
| 1976 | 39 | 0 | 0 | 0 | 17 | Conservative | ||
| 1979 | 48 | 1 | 0 | 0 | 7 | Conservative | ||
| New ward boundaries (58 seats) [5] | ||||||||
| 1983 | 48 | 2 | 0 | 0 | 8 | Conservative | ||
| 1987 | 49 | 5 | 0 | 0 | 4 | Conservative | ||
| 1991 | 44 | 11 | 0 | 0 | 3 | Conservative | ||
| 1995 | 29 | 24 | 0 | 0 | 5 | No overall control | ||
| 1999 | 34 | 22 | 0 | 0 | 2 | Conservative | ||
| New ward boundaries (58 seats) [6] | ||||||||
| 2003 | 34 | 15 | 0 | 0 | 6 | Conservative | ||
| New ward boundaries (58 seats) [7] | ||||||||
| 2007 | 34 | 12 | 2 | 0 | 7 | Conservative | ||
| 2011 | 47 | 3 | 0 | 0 | 5 | Conservative | ||
| 2015 | 50 | 0 | 0 | 0 | 5 | Conservative | ||
| New ward boundaries (45 seats) [8] | ||||||||
| 2019 | 34 | 4 | 2 | 0 | 5 | Conservative | ||
| 2023 | 9 | 13 | 11 | 2 | 10 | No overall control | ||


By-elections occur when seats become vacant between council elections. Below is a summary of recent by-elections; [9] full by-election results can be found by clicking on the by-election name.