2017 East Sussex County Council election

Last updated

2017 East Sussex County Council election
Flag of East Sussex.svg
  2013 4 May 2017 2021  

All 50 seats to East Sussex County Council
26 seats needed for a majority
 First partySecond party
 
Party Conservative Liberal Democrats
Seats before229
Seats won3011
Seat changeIncrease2.svg8Increase2.svg2

 Third partyFourth party
 
Party Labour UKIP
Seats before78
Seats won40
Seat changeDecrease2.svg3Decrease2.svg8

East Sussex UK local election 2017 map.svg
Map showing the results of the 2017 East Sussex County Council election.

Council control before election

No Overall Control

Council control after election

Conservative Party (UK)

The 2017 East Sussex County Council election took place on 4 May 2017 as part of the 2017 local elections in the United Kingdom. [1] All councillors were to be elected from electoral divisions by first-past-the-post voting for a four-year term of office.

Contents

Boundary changes to the electoral divisions will take effect at this election after a review of the county by the Local Government Boundary Commission for England. [2] This has led to an increase in the size of the Council from 49 to 50 and the splitting of former multi-member divisions.

Results

The Conservatives took control of the council, with all UKIP's seats lost. Labour had a 3-seat loss, and the Liberal Democrats took 2 seats. [3]

Election results

East Sussex County Council election, 2017 [4]
PartySeatsGainsLossesNet gain/lossSeats %Votes %Votes+/−
  Conservative 30100Increase2.svg106045.669,748Increase2.svg14
  Liberal Democrats 1110Increase2.svg12222.834,893Increase2.svg8
  Labour 403Decrease2.svg3614.722,488Increase2.svg0.3
  Independent 300Steady2.svg64.26,381Decrease2.svg1
 No description200Steady2.svg42.43,724N/A
  Green 000Steady2.svg05.88,803Increase2.svg2.8
  UKIP 007Decrease2.svg703.65,479Decrease2.svg23.7

Eastbourne

Devonshire

Devonshire
PartyCandidateVotes%
Liberal Democrats Steve Wallis* 1,424 49.2
Conservative Robert Whippy65722.7
Labour Paul Howard46316.0
UKIP Rachel Large2328.1
Green Linda Wintle1174.0
Majority
Turnout 2,89332.00
Liberal Democrats hold

Hampden Park

Hampden Park
PartyCandidateVotes%
Liberal Democrats Colin Swansborough 1,339 55.0
Conservative Mozmil Hussain63226.0
Labour Dave Poole34514.2
Green Ivor Heuting1194.9
Majority
Turnout 2,16029.1
Liberal Democrats hold

Langney

Langney
PartyCandidateVotes%
Liberal Democrats Alan Shuttleworth* 1,646 64.4
Conservative Christopher Whippy56122.0
UKIP Ian Garbutt1606.3
Labour Lee Comfort1445.6
Green Rosana Jimenez441.7
Majority
Turnout
Liberal Democrats hold

Meads

Meads
PartyCandidateVotes%
Conservative Barry Taylor* 2,213 59.6
Liberal Democrats Robin Maxted91824.7
Labour Jean Couture2366.4
Green Sally Boys1875.0
UKIP Christopher Holloway1574.2
Majority
Turnout
Conservative hold

Old Town

Old Town
PartyCandidateVotes%
Liberal Democrats John Ungar* 2,074 55.7
Conservative Vivienne de Havilland-Geraghty1,12330.2
Labour Jake Lambert3429.2
Green Alex Hough1844.9
Majority
Turnout
Liberal Democrats hold

Ratton

Ratton
PartyCandidateVotes%
Conservative Colin Belsey* 2,054 62.6
Liberal Democrats Marcus von Thiele69721.2
Labour John Lambert2567.8
UKIP Rex Kosters1815.5
Green Pippa Oliphant952.9
Majority
Turnout
Conservative hold

St Anthony's

St Anthony's
PartyCandidateVotes%
Liberal Democrats David Tutt* 1,834 59.5
Conservative Jamie Hollywood84727.5
Labour Jackie Ferguson1926.2
UKIP Colin Horscroft1504.9
Green Nick Symons601.9
Majority
Turnout
Liberal Democrats hold

Sovereign

Sovereign
PartyCandidateVotes%
Conservative David Elkin* 1,998 64.3
Liberal Democrats Kate Daly82926.7
Labour Natasha Duursma1956.3
Green Hugh Patrick832.7
Majority
Turnout
Conservative hold

Upperton

Upperton
PartyCandidateVotes%
Liberal Democrats Pat Rodohan* 1,634 48.3
Conservative Diane Mulkeirins1,25437.1
Labour Paul Richards2417.1
Green Dorothy Forsyth1384.1
UKIP Amanda Sheehan1163.4
Majority
Turnout
Liberal Democrats hold

Hastings

Ashdown and Conquest

Ashdown and Conquest
PartyCandidateVotes%
Conservative Peter Pragnell* 1,599 62.0
Labour Co-op Eileen Masters72027.9
Liberal Democrats Robert Wakeford1907.4
Green Gabriel Carlyle712.8
Majority
Turnout
Conservative hold

Baird and Ore

Baird and Ore
PartyCandidateVotes%
Conservative Laurie Loe 1,182 47.2
Labour Kim Forward1,11144.4
Liberal Democrats Katy Hunter-Burbridge1124.5
Green Judy Scott973.9
Majority
Turnout
Conservative gain from Labour

Braybrooke and Castle

Braybrooke and Castle
PartyCandidateVotes%
Labour Godfrey Daniel* 1,848 58.6
Conservative Rob Cooke68421.7
Liberal Democrats Xan Brooker37111.8
Green Andrea Needham2528.0
Majority
Turnout
Labour hold

Central St Leonards and Gensing

Central St Leonards and Gensing
PartyCandidateVotes%
Labour Trevor Webb* 1,520 53.7
Conservative Graeme Williams78427.7
Green Paul Homer2809.9
Liberal Democrats Tony Seymour2478.7
Majority
Turnout
Labour hold

Hollington and Wishing Tree

Hollington and Wishing Tree
PartyCandidateVotes%
Labour Phil Scott* 1,289 56.2
Conservative John Rankin79534.6
Liberal Democrats Stephen Milton1084.7
Green Arkady Johns1034.5
Majority
Turnout
Labour hold

Maze Hill and West St Leonards

Maze Hill and West St Leonards
PartyCandidateVotes%
Conservative Matthew Beaver 1,391 51.7
Labour Steve Thorpe80730.0
Liberal Democrats Eve Montgomery28510.6
Independent Diane Granger1124.2
Green Thaddeus Skews943.5
Majority
Turnout
Conservative gain from Labour

Old Hastings and Tressell

Old Hastings and Tressell
PartyCandidateVotes%
Labour Tania Charman 1,414 54.4
Conservative Claire Hammill74028.5
Green Julia Hilton28410.9
Liberal Democrats John Faulkner1636.3
Majority
Turnout
Labour hold

St Helens and Silverhill

St Helens and Silverhill
PartyCandidateVotes%
Conservative Martin Clarke 1,643 50.4
Labour Judy Rogers1,22837.7
Liberal Democrats Stewart Rayment2587.9
Green Sally Phillips1294.0
Majority
Turnout
Conservative gain from Labour

Lewes

Chailey

Chailey
PartyCandidateVotes%
Conservative Jim Sheppard* 1,957 60.2
Liberal Democrats Peter Gardiner78424.1
Labour Nicholas Belcher3119.6
Green Holly Atkins2006.2
Majority
Turnout
Conservative hold

Lewes

Lewes
PartyCandidateVotes%
Independent Ruth O'Keeffe 2,370 55.4
Liberal Democrats Oliver Henman75717.7
Labour Emily Clarke56813.3
Green Tony Rowell3027.1
Conservative Jane Slater2636.1
Socialist Howard Pilott190.4
Majority
Turnout 52.61
Independent hold

Newhaven and Bishopstone

Newhaven and Bishopstone
PartyCandidateVotes%
Liberal Democrats Darren Grover 1,239 39.1
Conservative Pater Charlton*1,19437.6
Labour Andrew Bryant31910.1
UKIP Ian Buchanan2277.2
Green Mark Bullock1013.2
Independent Laurence Pulling922.9
Majority
Turnout 37.12
Liberal Democrats hold

Ouse Valley West and Down

Ouse Valley West and Down
PartyCandidateVotes%
Liberal Democrats Sarah Jane Osborne 1,722 51.8
Conservative Roy Burman1,25337.7
Labour Jerry Gould2056.2
Green Anthony Shuster1444.3
Majority
Turnout 43.09
Liberal Democrats gain from UKIP

Peacehaven

Peacehaven
PartyCandidateVotes%
Conservative Nigel Enever 1,446 54.1
Labour Ciarron Clarkson72027.0
UKIP Phil Howson31011.6
Liberal Democrats Lee St Clair1184.4
Green Lesley Orr772.9
Majority
Turnout
Conservative gain from UKIP

Ringmer and Lewes Bridge

Ringmer and Lewes Bridge
PartyCandidateVotes%
Liberal Democrats Philip Daniel 1,492 33.0
Green Johnny Denis1,38530.6
Conservative Paul Gander1,11624.7
Labour Belinda Chapman4129.1
UKIP Tony Best1212.7
Majority
Turnout 52.95
Liberal Democrats hold

Seaford North

Seaford North
PartyCandidateVotes%
Conservative Phil Boorman 1,767 52.3
Liberal Democrats Ian Cairns1,00029.6
Labour John Edson2607.7
UKIP Eric Woodward2326.9
Green Mary De Pleave1193.5
Majority
Turnout 39.62
Conservative gain from UKIP

Seaford South

Seaford South
PartyCandidateVotes%
Liberal Democrats Carolyn Lambert* 1,670 44.9
Conservative Sam Adeniji1,49440.2
Labour Steve Floor2777.5
UKIP Pete Leeming1724.6
Green Emily O'Brien1052.8
Majority
Turnout 42.35
Liberal Democrats hold

Telscombe

Telscombe
PartyCandidateVotes%
Conservative Andy Smith 1,575 55.2
Labour Julie Anne Vaughan72325.3
UKIP Deborah Holt2267.9
Liberal Democrats Charlie Carr2227.8
Green Zoe Nicholson1083.8
Majority
Turnout 33.14
Conservative gain from UKIP

Rother

Battle and Crowhurst

Battle and Crowhurst
PartyCandidateVotes%
Liberal Democrats Kathryn Field* 1,465 48.3
Conservative Alistair Douglas1,08035.6
Labour Antonia Berelson35711.8
UKIP Michael Phillips1324.4
Majority
Turnout 40.23
Liberal Democrats hold

Bexhill East

Bexhill East
PartyCandidateVotes%
Independent Charles Clark* 919 35.3
Conservative Gillian Johnson80130.8
Labour Roger McCarthy36213.9
Liberal Democrats Diane Smith30611.8
UKIP Geoffrey Bastin2168.3
Majority
Turnout 32.98
Independent hold

Bexhill North

Bexhill North
PartyCandidateVotes%
Conservative Michael Ensor* 1,275 44.8
Labour Andy Batsford79828.0
Independent Helen Bridger38213.4
UKIP Trevor Clements2458.6
Liberal Democrats Graham Martin-Royle1465.1
Turnout 35.50
Conservative hold

Bexhill South

Bexhill South
PartyCandidateVotes%
Conservative Simon Elford 1,952 58.5
Labour Richard Sage74122.2
Liberal Democrats Vivienne Bond45913.8
UKIP Sheila Allen-Rodgers1865.6
Majority
Turnout 35.83
Conservative gain from UKIP

Bexhill West

Bexhill West
PartyCandidateVotes%
Independent Stuart Earl* 2,056 50.4
Conservative Martin Kenward1,35633.3
Labour Samuel Coleman2907.1
Liberal Democrats Joel Kemp2275.6
UKIP Alf Lovell1483.6
Majority
Turnout 46.31
Independent hold

Brede Valley and Marsham

Brede Valley and Marsham
PartyCandidateVotes%
Conservative Carl Maynard* 2,016 67.0
Labour Andy Ives41413.7
Liberal Democrats Ian Stone40813.6
UKIP Lynne Hehir1735.7
Majority
Turnout 38.51
Conservative hold

Northern Rother

Northern Rother
PartyCandidateVotes%
Conservative Angharad Davies* 1,719 58.9
Liberal Democrats Sue Prochak78226.8
Labour Larry Hyett2418.3
UKIP Edward Tuddenham1776.1
Majority
Turnout 40.78
Conservative hold

Rother North West

Rother North West
PartyCandidateVotes%
Conservative John Barnes* 1,686 62.0
Liberal Democrats Mary Varrall62322.9
Labour Sara Watson2549.3
UKIP Edward Smith1575.8
Majority
Turnout 36.43
Conservative hold

Rye and Eastern Rother

Rye and Eastern Rother
PartyCandidateVotes%
Conservative Keith Glazier* 1,697 55.5
Labour Co-op Nigel Jennings64121.0
Liberal Democrats Derek Greenup31810.4
UKIP Alison Phillips2046.7
Green Adam Smith1976.4
Majority
Turnout 38.48
Conservative hold

Wealden

Alfriston, East Hoathly & Hellingly

Alfriston, East Hoathly & Hellingly
PartyCandidateVotes%
Conservative Nick Bennett* 1,706 59.2
Liberal Democrats Chris Bowers56819.7
Green Kay Syrad2177.5
Labour Anthony Fielding1996.9
UKIP Chris Magness1926.7
Majority
Turnout 38.02
Conservative hold

At the previous election the UKIP candidate polled 29.4%

Crowborough North and Jarvis Brook

Crowborough North and Jarvis Brook
PartyCandidateVotes%
Conservative Richard Stogdon* 1,546 61.8
Liberal Democrats Karen Shaw43917.5
Labour Sarah Newman29211.7
Green Colin Stocks2259.0
Majority1007
Turnout 32.27
Conservative hold

Crowborough South and St Johns

Crowborough South and St Johns
PartyCandidateVotes%
Conservative Sylvia Tidy* 1,774 69.0
Liberal Democrats Adrian Morris44117.1
Labour Brendan Clegg1987.7
Green Gabrielle Symonds1596.2
Majority
Turnout
Conservative hold

Forest Row and Groombridge

Forest Row and Groombridge
PartyCandidateVotes%
Conservative Francis Whetstone* 1,468 45.8
Green Keith Obbard1,40643.9
Liberal Democrats Tessa Younger33110.3
Majority
Turnout
Conservative hold

At the previous election this seat also had UKIP and Labour candidates, who polled 28.9% and 5.7% respectively.

Hailsham Market

Hailsham Market
PartyCandidateVotes%
Conservative Bob Bowdler 943 40.9
Liberal Democrats Alexa Clarke60926.4
Labour Louise Orbell40117.4
UKIP Laurence Keeley*35315.3
Majority
Turnout
Conservative gain from UKIP

Hailsham New Town

Hailsham New Town
PartyCandidateVotes%
Conservative Gerard Fox 1,283 52.4
Liberal Democrats Gavin Blake-Coggins63425.9
Labour Mark Osborn36414.9
Green Charlotte Still1666.8
Majority
Turnout 29.51
Conservative hold

Heathfield and Mayfield

Heathfield and Mayfield
PartyCandidateVotes%
Conservative Rupert Simmons* 2,217 70.6
Liberal Democrats Fraser Kerr37411.9
Labour David Newman34711.1
Green Clare Whistler2026.4
Majority
Turnout 36.18
Conservative hold

Maresfield and Buxted

Maresfield and Buxted
PartyCandidateVotes%
Conservative Roy Galley* 2,381 69.6
Liberal Democrats James Edwards45313.2
Green Ian Tysh3109.1
Labour Gareth Looker2788.1
Majority
Turnout
Conservative hold

Pevensey and Stone Cross

Pevensey and Stone Cross
PartyCandidateVotes%
Conservative Tom Liddiard 1,161 47.2
UKIP Mike Pursglove*43117.5
Independent Daniel Brookbank36614.9
Liberal Democrats Wendy Dash27211.1
Labour Tim MacPherson1696.9
Green Iona Rowan592.4
Majority
Turnout
Conservative gain from UKIP

Polegate and Watermill

Polegate and Watermill
PartyCandidateVotes%
Independent Daniel Shing* 1,810 52.9
Conservative David Watts1,01729.7
Liberal Democrats Steve Murphy2256.6
UKIP Bernie Goodwin1755.1
Labour Alex Mthobi1353.9
Green Peter Wright621.8
Majority
Turnout 38.91
Independent hold

Uckfield North

Uckfield North
PartyCandidateVotes%
Conservative Claire Dowling* 1,350 53.3
Liberal Democrats Paul Sparks81532.1
Labour Robert Williams26810.6
Green Melissa Tysh1024.0
Majority
Turnout 35.54
Conservative hold

Uckfield South with Framfield

Uckfield South with Framfield
PartyCandidateVotes%
Conservative Chris Dowling* 1,558 59.9
Liberal Democrats Paul Meakin55221.2
Labour William Ball31412.1
Green Pamela Tysh1766.8
Majority
Turnout 37.41
Conservative hold

At the last election the UKIP candidate polled 32.2%.

Wealden East

Wealden East
PartyCandidateVotes%
Conservative Bill Bentley* 1,973 57.2
Liberal Democrats Paul Coleshill61417.8
Labour Jane Vinnicombe3269.4
UKIP Hannah Shoubridge2828.2
Green Eve Ashley2577.4
Majority
Turnout 38.94
Conservative hold

Wealden North East

Wealden North East
PartyCandidateVotes%
Conservative Bob Standley* 1,926 68.2
Liberal Democrats Beverley Johnstone40714.4
Green Beth Martin28510.1
Labour Christopher Morris2067.3
Majority
Turnout 36.82
Conservative hold

Willingdon and South Downs

Willingdon and South Downs
PartyCandidateVotes%
Independent Stephen Shing* 1,914 49.8
Conservative Douglas Murray1,30934.0
Liberal Democrats Christopher Hartley2927.6
UKIP Maureen Goodwin1243.2
Labour Jill Shacklock1102.9
Green Jennifer Howells972.5
Majority
Turnout
Independent hold

Related Research Articles

<span class="mw-page-title-main">Hartlepool (UK Parliament constituency)</span> Parliamentary constituency in the United Kingdom

Hartlepool is a borough constituency represented in the House of Commons of the UK Parliament by Jill Mortimer of the Conservative Party from 2021. The constituency covers the town of Hartlepool plus nearby settlements.

<span class="mw-page-title-main">Boston and Skegness (UK Parliament constituency)</span> Parliamentary constituency in the United Kingdom

Boston and Skegness is a county constituency, represented in the House of Commons of the UK Parliament. It is located in Lincolnshire, England. Like all British constituencies, Boston and Skegness elects one Member of Parliament (MP) by the first-past-the-post system of election. The seat has been represented by the Conservative MP Matt Warman since the 2015 general election, and is usually considered a safe seat for the party.

<span class="mw-page-title-main">Copeland (UK Parliament constituency)</span> UK Parliament constituency since 1983

Copeland is a constituency in Cumbria created in 1983 and represented in the House of Commons of the UK Parliament. The constituency is represented in Parliament by Trudy Harrison, of the Conservative Party, since a by-election in February 2017. It was retained at the snap 2017 general election four months later. The seat had been held by Labour candidates at elections between 1983 and 2015 included.

<span class="mw-page-title-main">Mansfield (UK Parliament constituency)</span> Parliamentary constituency in the United Kingdom, 1885 onwards

Mansfield is a constituency created in 1885 represented in the House of Commons of the UK Parliament since 2017 by Ben Bradley of the Conservative Party, who gained the seat at the 2017 general election, from the Labour Party. This is the first time the seat has been represented by a Conservative since its creation in 1885.

<span class="mw-page-title-main">Bognor Regis and Littlehampton (UK Parliament constituency)</span> UK Parliament constituency in England since 1997

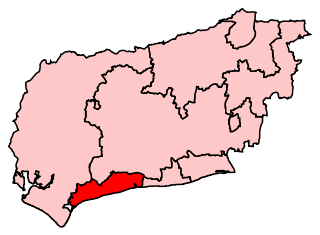
Bognor Regis and Littlehampton is a constituency in West Sussex represented in the House of Commons of the UK Parliament since 1997 by Nick Gibb, a Conservative.

<span class="mw-page-title-main">Thurrock (UK Parliament constituency)</span> Parliamentary constituency in the United Kingdom, 1945 onwards

Thurrock is a constituency represented in the House of Commons of the UK Parliament since 2010 by Jackie Doyle-Price, a Conservative.

<span class="mw-page-title-main">2013 West Sussex County Council election</span>

The West Sussex County Council election, 2013 took place on 2 May 2013, as part of the 2013 United Kingdom local elections. All 71 electoral divisions were up for election, which returned one county councillor each by first-past-the-post voting for a four-year term of office. At this election, the Conservative Party was seeking to retain overall control of the council, and the Liberal Democrats to maintain their position as the main opposition party.

<span class="mw-page-title-main">2013 East Sussex County Council election</span>

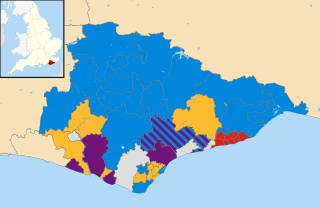
The East Sussex County Council election, 2013 took place on 2 May 2013 as part of the 2013 United Kingdom local elections. All 49 councillors of East Sussex County Council were elected from 44 electoral divisions, which return either one or two councillors each by first-past-the-post voting for a four-year term of office. The electoral divisions were the same as those used at the previous election in 2009. No elections were held in Brighton and Hove, which is a unitary authority outside the area covered by the County Council.

<span class="mw-page-title-main">2013 Surrey County Council election</span>

The Surrey County Council election, 2013 took place on 2 May 2013 as part of the 2013 United Kingdom local elections. 81 electoral divisions returned one county councillor each by first-past-the-post voting for a four-year term of office. Following a review, new electoral division boundaries were introduced for this election, increasing the number of councillors from 80 to 81.

<span class="mw-page-title-main">2013 Hertfordshire County Council election</span>

An election to Hertfordshire County Council took place on 2 May 2013, as part of the 2013 United Kingdom local elections. 77 electoral divisions elected one county councilor each by first-past-the-post voting for a four-year term of office. The electoral divisions were the same as those used at the previous election in 2009.

<span class="mw-page-title-main">2013 Cornwall Council election</span>

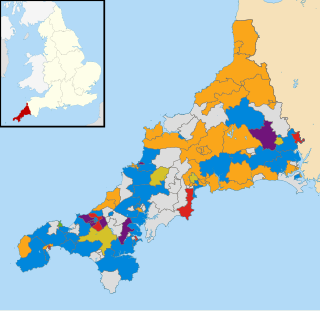
The Cornwall Council election, 2013, was an election for all 123 seats on the council. Cornwall Council is a unitary authority that covers the majority of the ceremonial county of Cornwall, with the exception of the Isles of Scilly which have an independent local authority. The elections took place concurrently with other local elections across England and Wales.

<span class="mw-page-title-main">2013 Staffordshire County Council election</span> UK local elections

An election to Staffordshire County Council took place on 2 May 2013 as part of the 2013 United Kingdom local elections. 62 electoral divisions returned one county councillor each by first-past-the-post voting for a four-year term of office. Following a boundary review, new electoral division boundaries were established for this election. No elections were held in Stoke-on-Trent, which is a unitary authority outside the area covered by the County Council. The council continues to be administered on the Leader and Cabinet model.

<span class="mw-page-title-main">2017 Lancashire County Council election</span> Election in the United Kingdom

An election to Lancashire County Council took place on 4 May 2017 as part of the 2017 local elections across the UK. All 84 councillors were elected for single-member and dual-member divisions for a four-year term of office. The system of voting used is first-past-the-post. Elections are held in all electoral divisions across the present ceremonial county, excepting Blackpool and Blackburn with Darwen which are unitary authorities.

<span class="mw-page-title-main">2017 United Kingdom local elections</span>

The 2017 United Kingdom local elections were held on Thursday 4 May 2017. Local elections were held across Great Britain, with elections to 35 English local authorities and all councils in Scotland and Wales.

<span class="mw-page-title-main">2017 Essex County Council election</span>

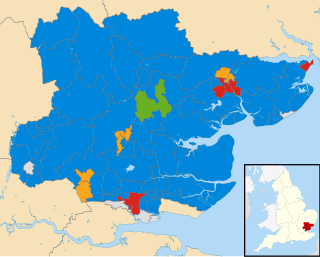
Elections to Essex County Council took place on 4 May 2017 as part of the 2017 local elections. All 75 councillors were elected from 70 electoral divisions, which each returned either one or two councillors by first-past-the-post voting for a four-year term of office.

<span class="mw-page-title-main">2017 Hampshire County Council election</span>

The 2017 Hampshire County Council election took place on 4 May 2017 as part of the 2017 local elections in the United Kingdom. All councillors were elected from electoral divisions by first-past-the-post voting for a four-year term of office. The electoral divisions were somewhat changed from the previous election, with some being split, merged or with boundary changes. No elections were held in Portsmouth and Southampton, which are unitary authorities and hold their elections in other years. Similarly the districts within Hampshire did also not hold elections this year.

<span class="mw-page-title-main">2017 Lincolnshire County Council election</span>

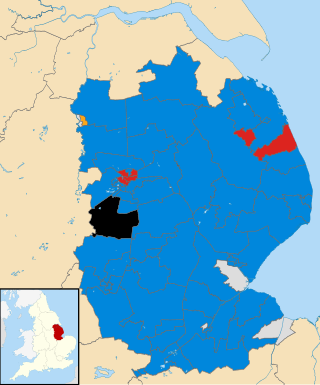
The 2017 Lincolnshire County Council election took place in non-metropolitan Lincolnshire on 4 May 2017 as part of the 2017 local elections in the United Kingdom. A total of 70 councillors were elected across the seven non-metropolitan districts that make up the administrative county of Lincolnshire from 70 single member electoral divisions by first-past-the-post voting for a four-year term of office. The election did not include North Lincolnshire and North East Lincolnshire as they are separate unitary authorities.

<span class="mw-page-title-main">2017 Surrey County Council election</span>

The 2017 Surrey County Council election took place as part of the 2017 local elections in the UK. All 81 councillors were elected for single-member electoral divisions for a four-year term. The electoral system used is first-past-the-post voting.

<span class="mw-page-title-main">2017 West Sussex County Council election</span>

The 2017 West Sussex County Council election took place as part of the 2017 local elections in the UK. All councillors were elected for single-member electoral divisions for a four-year term. The voting system used was first-past-the-post.

<span class="mw-page-title-main">2019 United Kingdom local elections</span> Elections to local councils and mayoralties

The 2019 United Kingdom local elections took place on Thursday 2 May 2019, with 248 English local councils, six directly elected mayors in England, and all 11 local councils in Northern Ireland being contested.

References

  1. "Upcoming elections & referendums". Electoral Commission. Archived from the original on 5 May 2018. Retrieved 16 September 2016.
  2. "East Sussex County Council". Local Government Boundary Commission for England. Retrieved 16 September 2016.
  3. "East Sussex County Council - BBC News". BBC. Retrieved 5 May 2017.
  4. "East Sussex In Figures". [www.eastsussexinfigures.org.uk]. 5 May 2017. Retrieved 5 May 2017.