| ||||||||||||||||||||||||||||||||||||||||||||||||||||||||||||||||||||
All 55 seats to Somerset County Council 28 seats needed for a majority | ||||||||||||||||||||||||||||||||||||||||||||||||||||||||||||||||||||
---|---|---|---|---|---|---|---|---|---|---|---|---|---|---|---|---|---|---|---|---|---|---|---|---|---|---|---|---|---|---|---|---|---|---|---|---|---|---|---|---|---|---|---|---|---|---|---|---|---|---|---|---|---|---|---|---|---|---|---|---|---|---|---|---|---|---|---|---|
| ||||||||||||||||||||||||||||||||||||||||||||||||||||||||||||||||||||
2017 Somerset County Council Election Results Map | ||||||||||||||||||||||||||||||||||||||||||||||||||||||||||||||||||||
|
The 2017 Somerset County Council election took place on 4 May 2017 as part of the 2017 local elections in the United Kingdom. [1] All 55 councilors were elected from 54 electoral divisions, which each returned either one or two county councilors by first-past-the-post voting for a four-year term of office.
Party | Seats | Gains | Losses | Net gain/loss | Seats % | Votes % | Votes | +/− | |
---|---|---|---|---|---|---|---|---|---|
Conservative | 35 | 9 | 3 | +6 | 63.6 | 47.0 | 78,107 | +12.0 | |
Liberal Democrats | 12 | 5 | 11 | –6 | 21.8 | 31.4 | 52,145 | +5.3 | |
Labour | 3 | 0 | 0 | – | 10.9 | 9.3 | 15,453 | –2.5 | |
Independent | 3 | 1 | 0 | +1 | 10.9 | 4.7 | 7,814 | +1.8 | |
Green | 2 | 2 | 0 | +2 | 3.6 | 4.7 | 7,822 | +0.4 | |
UKIP | 0 | 0 | 3 | –3 | 0.0 | 2.9 | 4,747 | –17.0 | |
Liberal | 0 | 0 | 0 | – | 0.0 | 0.0 | 76 | +0.0 |
Party | Candidate | Votes | % | ±% | |
---|---|---|---|---|---|
Independent | John Hunt | 1,147 | 35.4 | N/A | |
Liberal Democrats | Simon Nicholls | 976 | 30.1 | –5.0 | |
Conservative | Jason Wayne Woollacott | 841 | 26.0 | –7.0 | |
Labour | Charlie Grabham | 195 | 6.0 | –1.6 | |
Green | Julian McLeod Mellor | 80 | 2.5 | −2.8 | |
Majority | 171 | 5.3 | N/A | ||
Turnout | 3,239 | 43.3 | +6.3 | ||
Registered electors | 7,473 | ||||
Independent gain from Liberal Democrats | Swing |
Party | Candidate | Votes | % | ±% | |
---|---|---|---|---|---|
Conservative | John Bryan Thorne | 1,556 | 47.3 | +13.2 | |
Liberal Democrats | Ross Henley * | 1,414 | 43.0 | +7.2 | |
Labour | Madeleine Spears | 189 | 5.7 | –0.6 | |
Green | Roy Snelling | 132 | 4.0 | –0.2 | |
Majority | 142 | 4.3 | N/A | ||
Turnout | 3,291 | 40.0 | +3.0 | ||
Registered electors | 8,220 | ||||
Conservative gain from Liberal Democrats | Swing |
Party | Candidate | Votes | % | ±% | |
---|---|---|---|---|---|
Conservative | William Wallace * | 1,905 | 63.1 | +11.1 | |
Liberal Democrats | Sarah Joanne Dyke | 752 | 24.9 | +9.7 | |
Green | Oliver Hugh Arnold Dowding | 188 | 6.2 | N/A | |
Labour | Michael Andrew Yianni | 173 | 5.7 | –2.6 | |
Majority | 1,153 | 38.2 | +10.7 | ||
Turnout | 3,018 | 43.0 | +6.0 | ||
Registered electors | 7,025 | ||||
Conservative hold | Swing |
Party | Candidate | Votes | % | ±% | |
---|---|---|---|---|---|
Conservative | Bob Filmer | 1,917 | 67.8 | +2.5 | |
Liberal Democrats | Tony Gore | 537 | 19.0 | –1.0 | |
Labour | Janty Marsden | 216 | 7.6 | –7.1 | |
UKIP | David Robert Willis | 159 | 5.6 | N/A | |
Majority | 1,380 | 48.8 | +3.5 | ||
Turnout | 2,829 | 36.4 | +5.4 | ||
Registered electors | 7,767 | ||||
Conservative hold | Swing |
Party | Candidate | Votes | % | ±% | |
---|---|---|---|---|---|
Conservative | David Hall * | 1,337 | 55.2 | +18.1 | |
Labour | Diogo Rodrigues | 662 | 27.3 | +1.8 | |
Liberal Democrats | Mike Senior | 425 | 17.5 | +11.7 | |
Majority | 675 | 27.8 | +22.3 | ||
Turnout | 2,424 | 28.3 | +4.3 | ||
Registered electors | 8,557 | ||||
Conservative hold | Swing |
Party | Candidate | Votes | % | ±% | |
---|---|---|---|---|---|
Labour | Dave Loveridge * | 593 | 45.7 | –18.2 | |
Conservative | Pele Barnes | 510 | 39.3 | +16.7 | |
Liberal Democrats | Antony Nickolls | 196 | 15.1 | +1.6 | |
Majority | 83 | 6.4 | –35.0 | ||
Turnout | 1,299 | 20.8 | +4.8 | ||
Registered electors | 6,905 | ||||
Labour hold | Swing |
Party | Candidate | Votes | % | ±% | |
---|---|---|---|---|---|
Labour | Leigh Redman * | 954 | 51.0 | –11.7 | |
Conservative | Lance Duddridge | 727 | 38.8 | +1.5 | |
Liberal Democrats | Daniel Alexander Kelly | 191 | 10.2 | N/A | |
Majority | 227 | 12.1 | –13.3 | ||
Turnout | 1,872 | 24.0 | +4.0 | ||
Registered electors | 7,795 | ||||
Labour hold | Swing |
Party | Candidate | Votes | % | ±% | |
---|---|---|---|---|---|
Conservative | Ann Bown * | 1,289 | 59.0 | +20.4 | |
Labour | Tony Heywood | 606 | 27.8 | +2.8 | |
Liberal Democrats | Michelle Denise Phillips | 288 | 13.2 | +6.0 | |
Majority | 683 | 31.3 | –21.9 | ||
Turnout | 2,183 | 27.9 | +3.9 | ||
Registered electors | 7,837 | ||||
Conservative hold | Swing |
Party | Candidate | Votes | % | ±% | |
---|---|---|---|---|---|
Conservative | Josh Williams | 1,021 | 47.3 | +19.2 | |
Liberal Democrats | Sam Crabb * | 819 | 37.9 | –1.4 | |
Labour | Dan Marks | 128 | 5.9 | –1.9 | |
UKIP | Anthony Power | 126 | 5.8 | –16.2 | |
Green | Kek Long | 66 | 3.1 | N/A | |
Majority | 202 | 9.3 | N/A | ||
Turnout | 2,160 | 33.2 | +3.2 | ||
Registered electors | 6,501 | ||||
Conservative gain from Liberal Democrats | Swing |
Party | Candidate | Votes | % | ±% | |
---|---|---|---|---|---|
Conservative | Peter Burridge-Clayton * | 1,485 | 47.5 | –2.8 | |
Liberal Democrats | Mike Murphy | 1,183 | 37.9 | +10.5 | |
UKIP | Brian Royston Hobbs | 278 | 8.9 | N/A | |
Labour | Colin Michael Price | 178 | 5.7 | –7.0 | |
Majority | 302 | 9.7 | –13.2 | ||
Turnout | 3,124 | 38.7 | +5.7 | ||
Registered electors | 8,079 | ||||
Conservative hold | Swing |
Party | Candidate | Votes | % | ±% | |
---|---|---|---|---|---|
Conservative | Mike Caswell | 1,737 | 63.6 | +2.8 | |
Liberal Democrats | Jill Dillamore | 620 | 22.7 | +2.6 | |
Labour | Philip St Lawrence King | 374 | 13.7 | –5.4 | |
Majority | 1,117 | 40.9 | +0.2 | ||
Turnout | 2,731 | 37.1 | +4.1 | ||
Registered electors | 7,353 | ||||
Conservative hold | Swing |
Party | Candidate | Votes | % | ±% | |
---|---|---|---|---|---|
Conservative | Mike Lewis * | 2,062 | 60.5 | +16.8 | |
Liberal Democrats | Henry Hobhouse | 1,192 | 35.0 | +0.8 | |
Labour | Sean Adam Dromgoole | 153 | 4.5 | +0.4 | |
Majority | 870 | 25.5 | +16.0 | ||
Turnout | 3,407 | 44.9 | –1.1 | ||
Registered electors | 7,587 | ||||
Conservative hold | Swing |
Party | Candidate | Votes | % | ±% | |
---|---|---|---|---|---|
Liberal Democrats | Amanda Jane Broom | 1,445 | 46.4 | +21.1 | |
Conservative | Martin John Wale | 1,286 | 41.3 | +11.5 | |
UKIP | Nigel Charles Pearson * | 252 | 8.1 | –25.3 | |
Labour | John Wardman Schofield | 132 | 4.2 | –3.3 | |
Majority | 159 | 5.1 | N/A | ||
Turnout | 3,115 | 39.7 | +2.7 | ||
Registered electors | 7,846 | ||||
Liberal Democrats gain from UKIP | Swing |
Party | Candidate | Votes | % | ±% | |
---|---|---|---|---|---|
Conservative | Gemma Trudy Verdon | 756 | 31.6 | +8.8 | |
Independent | Dave Bulmer | 659 | 27.5 | N/A | |
Liberal Democrats | Jason Paul Baker | 603 | 25.2 | –13.0 | |
UKIP | Peter Martin Heather | 217 | 9.1 | –19.9 | |
Labour | Melissa Louise Whittaker-Mather | 161 | 6.7 | +1.0 | |
Majority | 97 | 4.0 | N/A | ||
Turnout | 2,396 | 36.6 | +4.6 | ||
Registered electors | 6,541 | ||||
Conservative gain from Liberal Democrats | Swing |
Party | Candidate | Votes | % | ±% | |
---|---|---|---|---|---|
Conservative | Nigel Philip Taylor | 1,395 | 50.4 | +11.2 | |
Liberal Democrats | Tim Shaban | 945 | 34.1 | +15.1 | |
Labour | Norma Scanion | 250 | 9.0 | –6.6 | |
UKIP | Helen Dorothy Hims | 178 | 6.4 | –19.8 | |
Majority | 450 | 16.3 | +3.2 | ||
Turnout | 2,768 | 38.3 | +6.3 | ||
Registered electors | 7,225 | ||||
Conservative hold | Swing |
Party | Candidate | Votes | % | ±% | |
---|---|---|---|---|---|
Conservative | Mark Alexander Keating | 1,885 | 52.2 | +14.4 | |
Liberal Democrats | Mick Clark | 1,406 | 38.9 | +7.6 | |
Green | Peter Bysouth | 184 | 5.1 | +0.3 | |
Labour | Jane Elizabeth Carter-Uren | 135 | 3.7 | –2.0 | |
Majority | 479 | 13.3 | +6.8 | ||
Turnout | 3,610 | 48.9 | +3.9 | ||
Registered electors | 7,473 | ||||
Conservative hold | Swing |
Party | Candidate | Votes | % | ±% | |
---|---|---|---|---|---|
Liberal Democrats | Alan Wedderkopp * | 1,790 | 47.5 | +7.6 | |
Conservative | Andy Sully | 1,496 | 39.7 | +8.7 | |
Labour | Liam David Canham | 219 | 5.8 | –0.7 | |
Green | Cathy Parmenter | 132 | 3.5 | –0.2 | |
UKIP | Bill Lukins | 128 | 3.4 | –16.3 | |
Majority | 294 | 7.8 | –1.1 | ||
Turnout | 3,765 | 47.8 | +1.8 | ||
Registered electors | 7,873 | ||||
Liberal Democrats hold | Swing |
Party | Candidate | Votes | % | ±% | |
---|---|---|---|---|---|
Liberal Democrats | Mike Best | 1,364 | 43.9 | –2.1 | |
Conservative | Marcus Morton Barratt | 1,294 | 41.7 | +16.9 | |
Labour | Gary David Swain | 276 | 8.9 | +4.2 | |
UKIP | Arthur Sidney Hamlin | 172 | 5.5 | –14.2 | |
Majority | 70 | 2.3 | –18.9 | ||
Turnout | 3,106 | 44.1 | +3.1 | ||
Registered electors | 7,045 | ||||
Liberal Democrats hold | Swing |
Party | Candidate | Votes | % | ±% | |
---|---|---|---|---|---|
Conservative | Clare Aparicio Paul | 1,801 | 47.2 | +5.0 | |
Independent | Andrew Lee | 930 | 24.4 | N/A | |
Liberal Democrats | Julia Mary Frances Gadd | 623 | 16.3 | –12.2 | |
Labour | Stephen Peter Tilley | 173 | 4.5 | +1.1 | |
Green | Stephen Peter Tate | 157 | 4.1 | –5.0 | |
UKIP | Barbara Mary Jell | 130 | 3.4 | 13.4 | |
Majority | 871 | 22.8 | +9.1 | ||
Turnout | 3,814 | 45.3 | +1.3 | ||
Registered electors | 8,416 | ||||
Conservative hold | Swing |
Party | Candidate | Votes | % | ±% | |
---|---|---|---|---|---|
Conservative | Frances Mary Nicholson * | 2,234 | 75.4 | +11.6 | |
Liberal Democrats | Peter Charles Pilkington | 394 | 13.2 | N/A | |
Labour | Graham Robert Kennedy | 191 | 6.4 | –4.9 | |
UKIP | Ivor Dennis Jones | 146 | 5.0 | –19.9 | |
Majority | 1,840 | 62.1 | +23.2 | ||
Turnout | 2,963 | 45.9 | +6.9 | ||
Registered electors | 6,450 | ||||
Conservative hold | Swing |
Party | Candidate | Votes | % | ±% | |
---|---|---|---|---|---|
Conservative | Christine Mary Lawrence * | 1,470 | 53.1 | +12.7 | |
Liberal Democrats | James Damian Tudor Wall | 732 | 26.4 | +17.5 | |
Labour | Lesley Culverhouse | 300 | 10.8 | –3.4 | |
UKIP | Adrian Behan | 147 | 5.3 | –23.1 | |
Green | Paul Donald Dennett | 120 | 4.3 | –3.8 | |
Majority | 738 | 26.7 | +14.7 | ||
Turnout | 2,769 | 40.9 | +4.9 | ||
Registered electors | 6,763 | ||||
Conservative hold | Swing |
Party | Candidate | Votes | % | ±% | |
---|---|---|---|---|---|
Green | Martin John Dimery | 983 | 33.8 | N/A | |
Conservative | Eve Berry | 979 | 33.6 | +8.8 | |
Liberal Democrats | Alvin John Horsfall * | 678 | 23.3 | –12.3 | |
Labour | David Alan Oakensen | 271 | 9.3 | –7.1 | |
Majority | 4 | 0.1 | N/A | ||
Turnout | 2,911 | 34.0 | +7.0 | ||
Registered electors | 8,554 | ||||
Green gain from Liberal Democrats | Swing |
Party | Candidate | Votes | % | ±% | |
---|---|---|---|---|---|
Conservative | Linda Oliver * | 1,551 | 51.5 | +15.8 | |
Liberal Democrats | Adam Owen Matthew Boyden | 1,085 | 36.0 | –1.3 | |
Green | Pepita Collins | 375 | 12.5 | N/A | |
Majority | 466 | 15.5 | N/A | ||
Turnout | 3,011 | 42.0 | +3.0 | ||
Registered electors | 7,175 | ||||
Conservative gain from Liberal Democrats | Swing |
Party | Candidate | Votes | % | ±% | |
---|---|---|---|---|---|
Green | John Clarke | 987 | 35.4 | N/A | |
Conservative | Jo Beale | 801 | 28.7 | +9.3 | |
Liberal Democrats | Damon John Hooton | 680 | 24.4 | –17.8 | |
Labour | Theresa Mary Philomena Clark | 243 | 8.7 | –10.0 | |
Liberal | Derek * | 76 | 2.7 | N/A | |
Majority | 186 | 6.7 | N/A | ||
Turnout | 2,787 | 34.6 | +5.6 | ||
Registered electors | 8,064 | ||||
Green gain from Liberal Democrats | Swing |
Derek (full name Derek Tanswell) was elected as a Liberal Democrat in 2013 [26]
Party | Candidate | Votes | % | ±% | |
---|---|---|---|---|---|
Conservative | Terry Napper * | 2,573 | 43.8 | ||
Liberal Democrats | Liz Leyshon | 2,272 | 38.7 | ||
Liberal Democrats | Nick Cottle | 2,037 | 34.7 | ||
Conservative | David Albert George Swain | 1,650 | 28.1 | ||
Green | Jon Cousins | 1,196 | 20.4 | ||
Labour | Emma Jane King | 697 | 11.9 | ||
Labour | Jane Ratcliffe | 530 | 9.0 | ||
Independent | Simon Michael Carswell | 433 | 7.4 | N/A | |
UKIP | Keith Anthony Hooper | 358 | 6.1 | ||
Turnout | 5,873 | 37.1 | |||
Registered electors | 15,813 | ||||
Conservative hold | Swing | ||||
Liberal Democrats hold | Swing |
Party | Candidate | Votes | % | ±% | |
---|---|---|---|---|---|
Conservative | John Charles Woodman * | 1,065 | 47.5 | +10.4 | |
Liberal Democrats | John David Parkes | 767 | 34.2 | +4.7 | |
Labour | Lucy Scanlon | 213 | 9.5 | –7.3 | |
UKIP | Lorna Irene Bromley Corke | 197 | 8.8 | N/A | |
Majority | 298 | 13.3 | +5.8 | ||
Turnout | 2,242 | 29.7 | +2.7 | ||
Registered electors | 7,557 | ||||
Conservative hold | Swing |
Party | Candidate | Votes | % | ±% | |
---|---|---|---|---|---|
Conservative | Mark Healey * | 1,810 | 68.0 | +24.5 | |
Liberal Democrats | Phil Harvey | 513 | 19.3 | +8.6 | |
Labour | Chelsea Joan Chadwick | 337 | 12.7 | –0.2 | |
Majority | 1,297 | 48.8 | +38.1 | ||
Turnout | 2,660 | 35.6 | +0.6 | ||
Registered electors | 7,465 | ||||
Conservative hold | Swing |
Party | Candidate | Votes | % | ±% | |
---|---|---|---|---|---|
Conservative | Linda Patricia Vijeh * | 1,736 | 53.4 | +24.3 | |
Liberal Democrats | Carol Ann Goodall | 980 | 30.2 | +4.5 | |
Green | Peter Lansdown | 203 | 6.3 | –2.2 | |
UKIP | Don Kinder | 169 | 5.2 | –23.6 | |
Labour | Ian Rupert Mackillop | 160 | 4.9 | –1.6 | |
Majority | 756 | 23.3 | +23.0 | ||
Turnout | 3,248 | 39.6 | –0.4 | ||
Registered electors | 8,192 | ||||
Conservative hold | Swing |
Party | Candidate | Votes | % | ±% | |
---|---|---|---|---|---|
Conservative | David John Huxtable * | 1,744 | 52.3 | +6.2 | |
Liberal Democrats | Emma Munt | 1,146 | 34.4 | +20.1 | |
UKIP | Anthony John Edward Betty | 232 | 7.0 | –11.9 | |
Labour | Lynne Morgan | 210 | 6.3 | –0.8 | |
Majority | 598 | 17.9 | –9.3 | ||
Turnout | 3,332 | 42.0 | +6.0 | ||
Registered electors | 7,924 | ||||
Conservative hold | Swing |
Party | Candidate | Votes | % | ±% | |
---|---|---|---|---|---|
Independent | Mike Rigby * | 1,356 | 48.1 | –5.8 | |
Conservative | Roger Keith Habgood | 1,055 | 37.4 | +5.5 | |
Liberal Democrats | James Russell | 204 | 7.2 | –2.7 | |
Labour | Jonathan Frederic Gray | 115 | 4.1 | –0.1 | |
Green | Clive Patrick Martin | 88 | 3.1 | N/A | |
Majority | 301 | 10.7 | –11.3 | ||
Turnout | 2,818 | 38.1 | –1.9 | ||
Registered electors | 7,389 | ||||
Independent hold | Swing |
Party | Candidate | Votes | % | ±% | |
---|---|---|---|---|---|
Conservative | Neil Brian Bloomfield | 2,075 | 63.5 | +29.7 | |
Liberal Democrats | Jonathan Paul Davies | 923 | 28.3 | –6.1 | |
Labour | Peter Charles Ludbrook | 268 | 8.2 | +0.1 | |
Majority | 1,152 | 35.3 | N/A | ||
Turnout | 3,266 | 39.0 | +3.0 | ||
Registered electors | 8,383 | ||||
Conservative gain from Liberal Democrats | Swing |
Party | Candidate | Votes | % | ±% | |
---|---|---|---|---|---|
Conservative | Philip John Ham * | 1,730 | 60.0 | +19.8 | |
Liberal Democrats | Claire Louise Hudson | 579 | 20.1 | –12.4 | |
Green | Jono Ekin | 322 | 11.2 | +6.1 | |
Labour | Marc James Peel | 251 | 8.7 | +1.9 | |
Majority | 1,151 | 39.9 | +32.1 | ||
Turnout | 2,882 | 39.2 | –0.8 | ||
Registered electors | 7,356 | ||||
Conservative hold | Swing |
Party | Candidate | Votes | % | ±% | |
---|---|---|---|---|---|
Conservative | Mike Pullin | 1,626 | 57.8 | +14.8 | |
Liberal Democrats | Melissa Coate | 683 | 24.3 | +12.4 | |
Green | David Hine | 197 | 7.0 | –1.6 | |
Labour | G. Paul Turner | 191 | 6.8 | –4.2 | |
UKIP | Simon Smedley | 115 | 4.1 | –21.4 | |
Majority | 943 | 33.5 | +15.9 | ||
Turnout | 2,812 | 37.4 | +4.4 | ||
Registered electors | 7,511 | ||||
Conservative hold | Swing |
Party | Candidate | Votes | % | ±% | |
---|---|---|---|---|---|
Conservative | Nigel Anthony Hewitt-Coope | 1,801 | 56.5 | +17.3 | |
Liberal Democrats | Robert John Reed | 1,044 | 32.8 | +0.8 | |
Green | Theo Simon | 340 | 10.7 | +4.5 | |
Majority | 757 | 23.8 | +16.6 | ||
Turnout | 3,185 | 43.1 | +2.1 | ||
Registered electors | 7,392 | ||||
Conservative hold | Swing |
Party | Candidate | Votes | % | ±% | |
---|---|---|---|---|---|
Conservative | Graham Noel * | 1,666 | 47.8 | +10.0 | |
Liberal Democrats | Ros Wyke | 1,660 | 47.6 | +13.3 | |
Labour | Daniel Croose | 159 | 4.6 | –0.4 | |
Majority | 6 | 0.2 | –3.3 | ||
Turnout | 3,485 | 47.2 | +5.2 | ||
Registered electors | 7,389 | ||||
Conservative hold | Swing |
Party | Candidate | Votes | % | ±% | |
---|---|---|---|---|---|
Conservative | Mandy Jayne Chilcott | 1,290 | 43.3 | +21.0 | |
Liberal Democrats | Marcus Kravis | 839 | 28.1 | +4.5 | |
UKIP | Terry Venner * | 609 | 20.4 | –7.6 | |
Labour | Maureen Anne Smith | 243 | 8.2 | +3.2 | |
Majority | 451 | 15.1 | N/A | ||
Turnout | 2,981 | 44.3 | +5.3 | ||
Registered electors | 6,735 | ||||
Conservative gain from UKIP | Swing |
Party | Candidate | Votes | % | ±% | |
---|---|---|---|---|---|
Conservative | David John Andrew Fothergill * | 2,254 | 66.5 | +19.8 | |
Liberal Democrats | Ray Tully | 836 | 24.7 | –1.8 | |
Green | Andy Pritchard | 297 | 8.8 | +5.7 | |
Majority | 1,418 | 41.9 | +21.7 | ||
Turnout | 3,387 | 41.2 | –0.8 | ||
Registered electors | 8,213 | ||||
Conservative hold | Swing |
Party | Candidate | Votes | % | ±% | |
---|---|---|---|---|---|
Liberal Democrats | Bill Revans | 1,435 | 51.3 | +18.3 | |
Conservative | Richard James Brown * | 1,187 | 42.4 | +8.4 | |
Labour | Jane Grenfell | 178 | 6.4 | –4.1 | |
Majority | 248 | 8.9 | N/A | ||
Turnout | 2,800 | 40.5 | +8.5 | ||
Liberal Democrats gain from Conservative | Swing |
Party | Candidate | Votes | % | ±% | |
---|---|---|---|---|---|
Conservative | Rod Williams | 1,125 | 40.1 | +12.4 | |
Liberal Democrats | Jefferson Andrew Horsley | 1,018 | 36.3 | +4.3 | |
Independent | Bob Bainbridge | 290 | 10.3 | N/A | |
Labour | Brenda Dawn Weston | 250 | 8.9 | –5.4 | |
Green | Alan William Debenham | 119 | 4.2 | –1.5 | |
Majority | 107 | 3.8 | N/A | ||
Turnout | 2,802 | 38.8 | +6.8 | ||
Registered electors | 7,227 | ||||
Conservative gain from Liberal Democrats | Swing |
Party | Candidate | Votes | % | ±% | |
---|---|---|---|---|---|
Conservative | John Parham * | 1,253 | 43.5 | +13.2 | |
Liberal Democrats | Garfield Kennedy | 851 | 29.6 | +3.4 | |
Independent | Bente Height | 403 | 14.0 | N/A | |
Labour | Ant Butler | 302 | 10.5 | –10.5 | |
Green | Peter Nicholas Harlow | 69 | 2.4 | –1.1 | |
Majority | 402 | 14.0 | +10.0 | ||
Turnout | 2,878 | 35.0 | +4.0 | ||
Registered electors | 8,214 | ||||
Conservative hold | Swing |
Party | Candidate | Votes | % | ±% | |
---|---|---|---|---|---|
Conservative | Dean Ruddle * | 2,340 | 66.7 | +22.7 | |
Liberal Democrats | Stephen Richard John Page | 869 | 24.8 | +0.9 | |
Green | Dan Britton | 177 | 5.0 | –7.5 | |
Labour | Mary Graham Butler | 124 | 3.5 | –0.5 | |
Majority | 1,471 | 41.9 | +21.8 | ||
Turnout | 3,510 | 47.1 | +3.1 | ||
Registered electors | 7,451 | ||||
Conservative hold | Swing |
Party | Candidate | Votes | % | ±% | |
---|---|---|---|---|---|
Liberal Democrats | Adam James Dance | 2,303 | 56.1 | +24.0 | |
Conservative | Christopher Antony Le Hardy * | 1,455 | 35.4 | +1.6 | |
UKIP | Antony Bryan Clarke | 187 | 4.6 | –16.8 | |
Labour | Paul John Sellers | 162 | 3.9 | –1.5 | |
Majority | 848 | 20.6 | N/A | ||
Turnout | 4,107 | 50.7 | +10.7 | ||
Registered electors | 8,098 | ||||
Liberal Democrats gain from Conservative | Swing |
Party | Candidate | Votes | % | ±% | |
---|---|---|---|---|---|
Liberal Democrats | Simon Coles * | 869 | 43.2 | +5.2 | |
Conservative | Stephen Henry Martin-Scott | 661 | 32.8 | +16.7 | |
Labour | Robert Noakes | 242 | 12.0 | –2.6 | |
UKIP | Hugh Courage | 142 | 7.1 | –18.3 | |
Green | Jon Machen | 99 | 4.9 | –0.5 | |
Majority | 208 | 10.3 | –2.3 | ||
Turnout | 2,013 | 27.9 | +1.9 | ||
Registered electors | 7,223 | ||||
Liberal Democrats hold | Swing |
Party | Candidate | Votes | % | ±% | |
---|---|---|---|---|---|
Conservative | Giuseppe Leslie Fraschini | 693 | 32.5 | +15.1 | |
Liberal Democrats | Chris Booth | 648 | 30.4 | +0.3 | |
Labour | Libby Lisgo | 543 | 25.4 | +3.3 | |
UKIP | Tom Aldridge | 165 | 7.7 | –16.2 | |
Green | Daniel James Whelan | 86 | 4.0 | –1.9 | |
Majority | 45 | 2.1 | N/A | ||
Turnout | 2,135 | 30.4 | +4.4 | ||
Registered electors | 7,023 | ||||
Conservative gain from Liberal Democrats | Swing |
Party | Candidate | Votes | % | ±% | |
---|---|---|---|---|---|
Liberal Democrats | Hazel Prior-Sankey * | 1,564 | 54.9 | +11.0 | |
Conservative | Luke Rush Parchment | 922 | 32.4 | +15.1 | |
Labour | Jack Robert Johnston | 217 | 7.6 | –3.6 | |
Green | Chris Salter | 144 | 5.1 | +0.5 | |
Majority | 642 | 22.6 | +1.8 | ||
Turnout | 2,847 | 36.9 | +2.9 | ||
Registered electors | 7,707 | ||||
Liberal Democrats hold | Swing |
Party | Candidate | Votes | % | ±% | |
---|---|---|---|---|---|
Conservative | James Hunt * | 1,574 | 49.1 | +16.0 | |
Independent | Steve Ross | 890 | 27.8 | +1.7 | |
Liberal Democrats | Janet Carol Lloyd | 485 | 15.1 | +8.1 | |
Green | Caroline Anne Freedman | 256 | 8.0 | N/A | |
Majority | 684 | 21.3 | +17.8 | ||
Turnout | 3,205 | 43.8 | +0.8 | ||
Registered electors | 7,318 | ||||
Conservative hold | Swing |
Party | Candidate | Votes | % | ±% | |
---|---|---|---|---|---|
Independent | Hugh Davies * | 1,423 | 48.7 | +9.6 | |
Conservative | Richard Patrick Lillis | 900 | 30.8 | +1.3 | |
Labour | Robin Keith Nuttall | 298 | 10.2 | –1.3 | |
Liberal Democrats | Anthony Charles Bowden | 191 | 6.5 | N/A | |
UKIP | Peter Barbuti | 108 | 3.7 | –16.3 | |
Majority | 523 | 17.9 | +8.3 | ||
Turnout | 2,920 | 39.4 | +3.4 | ||
Independent hold | Swing |
Party | Candidate | Votes | % | ±% | |
---|---|---|---|---|---|
Labour | Andrew Govier * | 1,704 | 52.5 | +1.6 | |
Conservative | Robin Dickinson | 1,151 | 35.5 | +15.4 | |
Liberal Democrats | Mark Raymond Lithgow | 272 | 8.4 | –2.1 | |
Green | Zoe Ainsworth-Grigg | 119 | 3.7 | +0.8 | |
Majority | 553 | 17.0 | –13.7 | ||
Turnout | 3,246 | 37.4 | +1.4 | ||
Registered electors | 8,673 | ||||
Labour hold | Swing |
Party | Candidate | Votes | % | ±% | |
---|---|---|---|---|---|
Liberal Democrats | Tessa Jane Munt | 2,107 | 46.9 | +21.0 | |
Conservative | John Derek Osman * | 2,012 | 44.7 | +4.0 | |
Labour | Den Carter | 166 | 3.7 | –8.8 | |
Green | Paul Francis Crummay | 126 | 2.8 | –3.4 | |
UKIP | Les Bate | 86 | 1.9 | –12.9 | |
Majority | 95 | 2.1 | N/A | ||
Turnout | 4,497 | 52.6 | +11.6 | ||
Registered electors | 8,556 | ||||
Liberal Democrats gain from Conservative | Swing |
Party | Candidate | Votes | % | ±% | |
---|---|---|---|---|---|
Conservative | Anna Groskop * | 2,096 | 64.2 | +11.0 | |
Liberal Democrats | Abigail Rebekah Baker | 708 | 21.7 | +2.9 | |
Labour | Patricia Ann Turner | 244 | 7.5 | +0.9 | |
Green | Ewan William George Jones | 216 | 6.6 | +2.1 | |
Majority | 1,388 | 42.5 | +8.1 | ||
Turnout | 3,264 | 39.1 | +4.1 | ||
Registered electors | 8,352 | ||||
Conservative hold | Swing |
Party | Candidate | Votes | % | ±% | |
---|---|---|---|---|---|
Liberal Democrats | Andy Kendall | 1,033 | 44.7 | +10.3 | |
Conservative | Nick Rousell | 745 | 32.2 | +10.4 | |
UKIP | Alan Ivor Dimmick * | 226 | 9.8 | –24.3 | |
Labour | Terry Lavin | 215 | 9.3 | –1.4 | |
Green | Alan Flint | 93 | 4.0 | N/A | |
Majority | 288 | 12.5 | N/A | ||
Turnout | 2,312 | 32.0 | +3.0 | ||
Registered electors | 7,231 | ||||
Liberal Democrats gain from UKIP | Swing |
Party | Candidate | Votes | % | ±% | |
---|---|---|---|---|---|
Liberal Democrats | Tony Lock * | 1,063 | 49.0 | +7.9 | |
Conservative | Teresa Sienkiewicz | 512 | 23.6 | +14.2 | |
Labour | Terry Ledlie | 255 | 11.8 | +1.6 | |
UKIP | Godfrey Davey | 220 | 10.1 | –25.7 | |
Independent | Neil James Mitchell | 118 | 5.4 | N/A | |
Majority | 551 | 25.4 | +20.0 | ||
Turnout | 2,168 | 28.4 | +1.4 | ||
Registered electors | 7,633 | ||||
Liberal Democrats hold | Swing |
Party | Candidate | Votes | % | ±% | |
---|---|---|---|---|---|
Conservative | Faye Purbrick | 1,288 | 46.2 | +21.6 | |
Liberal Democrats | Andy Soughton | 1,031 | 37.0 | –1.6 | |
Labour | Christos Zaranis | 173 | 6.2 | –2.8 | |
Independent | Dave Greene | 165 | 5.9 | N/A | |
Green | Diane Catherine Wood | 131 | 4.7 | +0.3 | |
Majority | 257 | 9.2 | N/A | ||
Turnout | 2,788 | 36.4 | +3.4 | ||
Registered electors | 7,655 | ||||
Conservative gain from Liberal Democrats | Swing |
Party | Candidate | Votes | % | ±% | |
---|---|---|---|---|---|
Liberal Democrats | Jane Lock * | 877 | 43.1 | +2.9 | |
Conservative | John Richard Lukey | 783 | 38.5 | +18.6 | |
Labour | Gail Freeman-Bell | 234 | 11.5 | +1.7 | |
Green | Robert Charles Wood | 140 | 6.9 | +2.0 | |
Majority | 94 | 4.6 | –10.5 | ||
Turnout | 2,034 | 32.2 | +3.2 | ||
Registered electors | 6,316 | ||||
Liberal Democrats hold | Swing |
Party | Candidate | Votes | % | ±% | |
---|---|---|---|---|---|
Liberal Democrats | Dawn Johnson | 1,677 | 63.2 | +15.6 | |
Conservative | Ruth Harmon | 886 | 33.4 | −6.4 | |
Labour | Michael McGuffie | 92 | 3.5 | −2.4 | |
Majority | 791 | 29.8 | |||
Turnout | 2,655 | ||||
Liberal Democrats hold | Swing | 11.0 |
Somerset is a ceremonial county in South West England. It is bordered by the Bristol Channel, Gloucestershire, and Bristol to the north, Wiltshire to the east and the north-east, Dorset to the south-east, and Devon to the south-west. The largest settlement is the city of Bath, and the county town is Taunton.
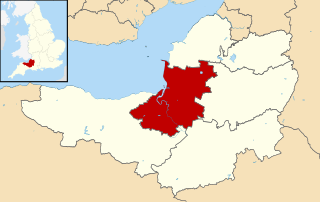
Sedgemoor is a low-lying area of land in Somerset, England. It lies close to sea level south of the Polden Hills, historically largely marsh. The eastern part is known as King's Sedgemoor, and the western part West Sedgemoor. Sedgemoor is part of the area now known as the Somerset Levels and Moors. Historically the area was known as the site of the Battle of Sedgemoor.
North Petherton is a town and civil parish in Somerset, England, situated on the edge of the eastern foothills of the Quantocks, and close to the edge of the Somerset Levels. The town has a population of 6,730 as of 2014. The parish includes Hamp, Melcombe, Shearston, Woolmersdon and Huntworth.
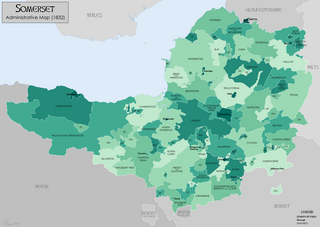
Somerset is a historic county in the south west of England. There is evidence of human occupation since prehistoric times with hand axes and flint points from the Palaeolithic and Mesolithic eras, and a range of burial mounds, hill forts and other artefacts dating from the Neolithic, Bronze and Iron Ages. The oldest dated human road work in Great Britain is the Sweet Track, constructed across the Somerset Levels with wooden planks in the 39th century BCE.
Bridgwater is a parliamentary constituency represented in the House of Commons of the Parliament of the United Kingdom. It elects one Member of Parliament (MP) by the first past the post system of election.
Somerton and Frome was a constituency in Somerset represented in the House of Commons of the UK Parliament.
Yeovil is a constituency in Somerset created in 1918 and represented in the House of Commons of the Parliament of the United Kingdom. Since the 2024 General Election, the constituency has been represented by Liberal Democrat MP Adam Dance.
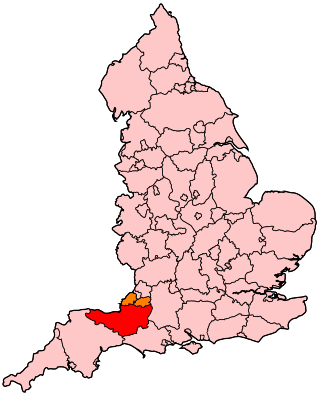
Somerset is a rural county in the southwest of England, covering 4,171 square kilometres (1,610 sq mi). It is bounded on the north-west by the Bristol Channel, on the north by Bristol and Gloucestershire, on the north-east by Wiltshire, on the south-east by Dorset, and on the south west and west by Devon. It has broad central plains with several ranges of low hills. The landscape divides into four main geological sections from the Silurian through the Devonian and Carboniferous to the Permian which influence the landscape, together with water-related features.
Bridgwater and West Somerset was a constituency represented in the House of Commons of the UK Parliament since 2010 by Ian Liddell-Grainger, a Conservative.
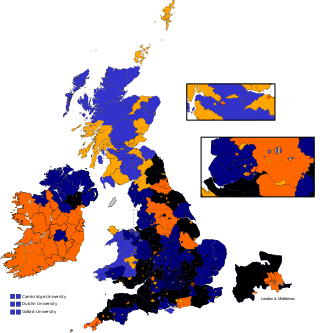
West Somerset or Somerset Western was the name of a parliamentary constituency in the county of Somerset between 1832 and 1885. It returned two Members of Parliament to the House of Commons of the Parliament of the United Kingdom, elected by the bloc vote system.
The earliest known infrastructure for transport in Somerset is a series of wooden trackways laid across the Somerset Levels, an area of low-lying marshy ground. To the west of this district lies the Bristol Channel, while the other boundaries of the county of Somerset are along chains of hills that were once exploited for their mineral deposits. These natural features have all influenced the evolution of the transport network. Roads and railways either followed the hills, or needed causeways to cross the Levels. Harbours were developed, rivers improved, and linked to sources of traffic by canals. Railways were constructed throughout the area, influenced by the needs of the city of Bristol, which lies just to the north of Somerset, and to link the ports of the far south-west with the rest of England.
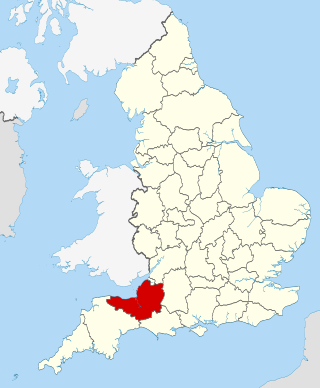
The county of Somerset is in South West England, bordered by the Bristol Channel and the counties of Bristol and Gloucestershire to the north, and Wiltshire to the east, Dorset to the south, and Devon to the west. The climate, influenced by its proximity to the Atlantic Ocean and the prevailing westerly winds, tends to be mild, damp and windy.
The Somerset County Rugby Football Union (SCRFU) is the governing body for the sport of rugby union in the county of Somerset in England. The union is the constituent body of the Rugby Football Union (RFU) for Somerset. The SCRFU administers and organises rugby union clubs and competitions in the Somerset including the county rugby representative teams.
Somerset NHS Foundation Trust is a NHS foundation trust providing services for NHS England in Somerset, England. It manages a number of hospitals providing mental, community and acute hospital care across the whole county.
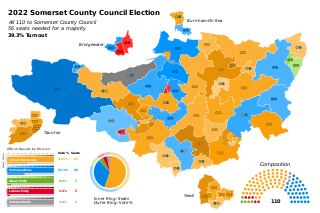
The 2022 Somerset Council election took place on 5 May 2022 to elect members of Somerset County Council. The number of councillors was doubled from 55 to 110 at this election, in preparation for the county council becoming a unitary authority on 1 April 2023, when it was renamed Somerset Council.