District result maps
 1999 results map
 2003 results map
 2007 results map
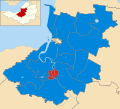 2011 results map
 2015 results map
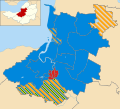 2019 results map
Sedgemoor District Council was the local authority for the district of Sedgemoor in Somerset, England. The council was elected every four years. Since the last boundary changes in 1999, 50 councillors were elected from 25 wards. [1] The council was abolished on 1 April 2023, when it was replaced by Somerset Council, a unitary authority.
Since the foundation of the council in 1973 political control of the council has been held by the following parties: [2] [3]
| Party in control | Years | |
|---|---|---|
| No overall control | 1973–1976 | |
| Conservative | 1976–1995 | |
| No overall control | 1995–1999 | |
| Conservative | 1999–2023 | |
The leader of the council from 2005 until the council's abolition in 2023 was:
| Councillor | Party | From | To | |
|---|---|---|---|---|
| Duncan McGinty [4] [5] | Conservative | Apr 2005 | 31 Mar 2023 | |


| Party | Candidate | Votes | % | ±% | |
|---|---|---|---|---|---|
| Conservative | 293 | 77.7 | +4.6 | ||
| Labour | 84 | 22.3 | −4.6 | ||
| Majority | 209 | 55.4 | |||
| Turnout | 377 | 24.1 | |||
| Conservative hold | Swing | ||||
| Party | Candidate | Votes | % | ±% | |
|---|---|---|---|---|---|
| Liberal Democrats | 556 | 51.1 | +18.4 | ||
| Conservative | 533 | 48.9 | +4.3 | ||
| Majority | 23 | 2.2 | |||
| Turnout | 1,089 | 40.0 | |||
| Liberal Democrats gain from Conservative | Swing | ||||
| Party | Candidate | Votes | % | ±% | |
|---|---|---|---|---|---|
| Conservative | 426 | 64.5 | −8.6 | ||
| Liberal Democrats | 203 | 30.8 | +30.8 | ||
| Labour | 16 | 2.4 | −24.5 | ||
| UKIP | 15 | 2.3 | +2.3 | ||
| Majority | 223 | 33.7 | |||
| Turnout | 660 | 40.3 | |||
| Conservative hold | Swing | ||||
| Party | Candidate | Votes | % | ±% | |
|---|---|---|---|---|---|
| Conservative | 660 | 51.0 | +4.2 | ||
| Liberal Democrats | 453 | 35.0 | +4.3 | ||
| Labour | 180 | 13.9 | −8.6 | ||
| Majority | 207 | 16.0 | |||
| Turnout | 1,293 | 26.0 | |||
| Conservative hold | Swing | ||||
| Party | Candidate | Votes | % | ±% | |
|---|---|---|---|---|---|
| Conservative | 340 | 57.2 | −0.5 | ||
| Liberal Democrats | 254 | 42.8 | +0.5 | ||
| Majority | 86 | 14.4 | |||
| Turnout | 594 | 32.1 | |||
| Conservative hold | Swing | ||||
| Party | Candidate | Votes | % | ±% | |
|---|---|---|---|---|---|
| Conservative | 1,689 | 50.4 | +2.6 | ||
| Independent | 1,663 | 49.6 | +49.6 | ||
| Majority | 26 | 0.8 | |||
| Turnout | 3,352 | ||||
| Conservative hold | Swing | ||||