District result maps
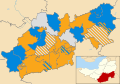 1999 results map
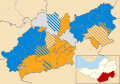 2003 results map
 2007 results map
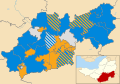 2011 results map
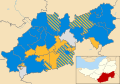 2015 results map
 2019 results map
South Somerset District Council in Somerset, England was elected every four years. Since 2019 the council is divided into 34 wards electing 60 councillors. [1] The council was abolished on 1 April 2023, when it was replaced by Somerset Council, a unitary authority.
Since the first election to the council in 1973 political control of the council has been held by the following parties: [2] [3]
| Party in control | Years | |
|---|---|---|
| No overall control | 1973–1976 | |
| Conservative | 1976–1979 | |
| No overall control | 1979–1987 | |
| Liberal Democrats | 1987–2023 | |
The leaders of the council of the from 2006 until its abolition in 2023 were:
| Councillor | Party | From | To | |
|---|---|---|---|---|
| Tim Carroll [4] | Liberal Democrats | 2006 | May 2011 | |
| Ric Pallister [5] [6] | Liberal Democrats | 19 May 2011 | 31 Aug 2018 | |
| Val Keitch [7] [8] | Liberal Democrats | 1 Sep 2018 | 31 Mar 2023 | |


| Party | Candidate | Votes | % | ±% | |
|---|---|---|---|---|---|
| Conservative | 455 | 38.9 | +11.7 | ||
| Liberal Democrats | 421 | 36.0 | −7.1 | ||
| Labour | 294 | 25.1 | −4.6 | ||
| Majority | 34 | 2.9 | |||
| Turnout | 1,170 | 19.0 | |||
| Conservative gain from Liberal Democrats | Swing | ||||
| Party | Candidate | Votes | % | ±% | |
|---|---|---|---|---|---|
| Liberal Democrats | 571 | 70.9 | +27.6 | ||
| Conservative | 234 | 29.1 | −11.7 | ||
| Majority | 337 | 41.8 | |||
| Turnout | 805 | 44.6 | |||
| Liberal Democrats hold | Swing | ||||
| Party | Candidate | Votes | % | ±% | |
|---|---|---|---|---|---|
| Conservative | 618 | 57.5 | −14.1 | ||
| Liberal Democrats | 457 | 42.5 | +14.1 | ||
| Majority | 161 | 15.0 | |||
| Turnout | 1,075 | 52.3 | |||
| Conservative hold | Swing | ||||
| Party | Candidate | Votes | % | ±% | |
|---|---|---|---|---|---|
| Liberal Democrats | 859 | 57.8 | +10.7 | ||
| Conservative | 627 | 42.2 | +6.6 | ||
| Majority | 232 | 15.6 | |||
| Turnout | 1,486 | 25.3 | |||
| Liberal Democrats gain from Conservative | Swing | ||||
| Party | Candidate | Votes | % | ±% | |
|---|---|---|---|---|---|
| Liberal Democrats | Peter Seib | 478 | 58.0 | +1.8 | |
| Conservative | Philippa Hamilton | 232 | 28.2 | −8.4 | |
| Independent | Elizabeth Glaisher | 113 | 13.7 | +13.7 | |
| Majority | 246 | 29.8 | |||
| Turnout | 823 | 18.3 | |||
| Liberal Democrats hold | Swing | ||||
| Party | Candidate | Votes | % | ±% | |
|---|---|---|---|---|---|
| Liberal Democrats | Daniel Shortland | 367 | 54.5 | +37.0 | |
| Conservative | Stephen Wright | 180 | 26.7 | +26.7 | |
| Independent | Rita Wickenden | 127 | 18.8 | −63.7 | |
| Majority | 187 | 27.8 | |||
| Turnout | 674 | 30.2 | |||
| Liberal Democrats gain from Independent | Swing | ||||
| Party | Candidate | Votes | % | ±% | |
|---|---|---|---|---|---|
| Liberal Democrats | Jenny Kenton | 423 | 47.2 | −5.0 | |
| Conservative | David Mears | 320 | 35.7 | −0.7 | |
| BNP | Robert Baehr | 154 | 17.2 | +17.2 | |
| Majority | 103 | 11.5 | |||
| Turnout | 897 | 44.5 | |||
| Liberal Democrats hold | Swing | ||||
| Party | Candidate | Votes | % | ±% | |
|---|---|---|---|---|---|
| Liberal Democrats | Cathy Bakewell | 1,010 | 47.2 | +0.1 | |
| Conservative | Gina Seaton | 1,002 | 46.9 | +5.5 | |
| Independent | Nick Hester | 126 | 5.9 | +5.9 | |
| Majority | 8 | 0.3 | |||
| Turnout | 2,138 | ||||
| Liberal Democrats hold | Swing | ||||
| Party | Candidate | Votes | % | ±% | |
|---|---|---|---|---|---|
| Liberal Democrats | Carol Goodall | 1,192 | 58.0 | +10.1 | |
| Conservative | Jane Morgan | 862 | 42.0 | +7.3 | |
| Majority | 330 | 16.0 | |||
| Turnout | 2,054 | ||||
| Liberal Democrats hold | Swing | ||||