District result maps
 2003 results map
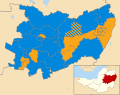 2007 results map
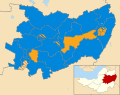 2011 results map
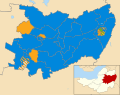 2015 results map
 2019 results map
Prior to its 2023 abolition, Mendip District Council in Somerset, England was elected every four years. On 1 April of that year, the district was abolished and became part of the area of Somerset Council, a new unitary authority. [1]
The first election to the council was held in 1973, initially acting as a shadow authority alongside the outgoing councils before formally coming into office on 1 April 1974. Political control of the council was as follows: [2]
| Party in control | Years | |
|---|---|---|
| Independent | 1974–1976 | |
| No overall control | 1976–1979 | |
| Independent | 1979–1983 | |
| Conservative | 1983–1987 | |
| No overall control | 1987–2003 | |
| Conservative | 2003–2019 | |
| No overall control | 2019–2023 | |
The leaders of the council from 2007 until its abolition in 2023 were:
| Councillor | Party | From | To | |
|---|---|---|---|---|
| Harvey Siggs [3] | Conservative | 2007 | May 2019 | |
| Ros Wyke [4] | Liberal Democrats | 20 May 2019 | 31 Mar 2023 | |


| Party | Candidate | Votes | % | ±% | |
|---|---|---|---|---|---|
| Conservative | 390 | 32.8 | |||
| Liberal Democrats | 300 | 25.3 | |||
| Labour | 298 | 25.1 | |||
| Independent | 111 | 9.3 | |||
| Independent | 90 | 7.6 | |||
| Majority | 90 | 7.5 | |||
| Turnout | 1,189 | 35.0 | |||
| Conservative gain from Liberal Democrats | Swing | ||||
| Party | Candidate | Votes | % | ±% | |
|---|---|---|---|---|---|
| Labour | 516 | 45.7 | +45.7 | ||
| Liberal Democrats | 355 | 31.4 | −24.7 | ||
| Conservative | 259 | 22.9 | −21.0 | ||
| Majority | 161 | 14.3 | |||
| Turnout | 1,130 | ||||
| Labour gain from Liberal Democrats | Swing | ||||
| Party | Candidate | Votes | % | ±% | |
|---|---|---|---|---|---|
| Liberal Democrats | 386 | 39.4 | +3.3 | ||
| Labour | 281 | 28.0 | −2.0 | ||
| Conservative | 214 | 21.3 | +12.3 | ||
| Independent Labour | 114 | 11.3 | +11.3 | ||
| Majority | 115 | 11.4 | |||
| Turnout | 1,005 | ||||
| Liberal Democrats gain from Labour | Swing | ||||
| Party | Candidate | Votes | % | ±% | |
|---|---|---|---|---|---|
| Labour | 389 | 35.9 | −11.2 | ||
| Liberal Democrats | 350 | 32.3 | −5.3 | ||
| Conservative | 317 | 29.2 | |||
| UKIP | 29 | 2.7 | +2.7 | ||
| Majority | 39 | 3.6 | |||
| Turnout | 1,085 | 30.0 | |||
| Labour hold | Swing | ||||
| Party | Candidate | Votes | % | ±% | |
|---|---|---|---|---|---|
| Liberal Democrats | Stan Wilson | 538 | 50.3 | +10.6 | |
| Conservative | Robert Pearson | 529 | 49.5 | −10.6 | |
| Majority | 9 | 0.8 | |||
| Turnout | 1,067 | 56.8 | |||
| Liberal Democrats gain from Conservative | Swing | ||||
| Party | Candidate | Votes | % | ±% | |
|---|---|---|---|---|---|
| Liberal Democrats | Ros Meikle | 439 | 55.0 | +10.7 | |
| Conservative | Robert Smitherman | 359 | 45.0 | −10.7 | |
| Majority | 80 | 10.0 | |||
| Turnout | 798 | 20.0 | |||
| Liberal Democrats gain from Conservative | Swing | ||||
| Party | Candidate | Votes | % | ±% | |
|---|---|---|---|---|---|
| Liberal Democrats | Alvin Horsfall | 487 | 63.2 | +36.6 | |
| Labour | David Oakensen | 128 | 16.6 | −3.1 | |
| Conservative | Pamelita Lee | 104 | 13.5 | −4.0 | |
| UKIP | Colin McManee | 51 | 6.6 | +6.6 | |
| Majority | 359 | 46.6 | |||
| Turnout | 770 | 20.0 | |||
| Liberal Democrats gain from Independent | Swing | ||||
| Party | Candidate | Votes | % | ±% | |
|---|---|---|---|---|---|
| Conservative | John Brundson | 432 | 55.4 | +10.8 | |
| Liberal Democrats | Alan Gloak | 348 | 44.6 | −10.8 | |
| Majority | 84 | 10.8 | |||
| Turnout | 780 | ||||
| Conservative gain from Liberal Democrats | Swing | ||||
| Party | Candidate | Votes | % | ±% | |
|---|---|---|---|---|---|
| Conservative | Jeannette Marsh | 435 | 50.3 | +4.1 | |
| Liberal Democrats | Bob Champion | 307 | 35.5 | −3.0 | |
| Labour | Christopher Inchley | 122 | 14.1 | −1.1 | |
| Majority | 128 | 14.8 | |||
| Turnout | 864 | ||||
| Conservative hold | Swing | ||||
| Party | Candidate | Votes | % | ±% | |
|---|---|---|---|---|---|
| Liberal Democrats | Bryan Beha | 347 | 47.9 | −19.8 | |
| Conservative | George Steer | 297 | 41.0 | +8.6 | |
| Independent | Julian Bartlett | 81 | 11.2 | +11.2 | |
| Majority | 50 | 6.9 | |||
| Turnout | 725 | ||||
| Liberal Democrats hold | Swing | ||||
| Party | Candidate | Votes | % | ±% | |
|---|---|---|---|---|---|
| Conservative | Carole Jane Bullen | 576 | 44.3 | +6.0 | |
| Liberal Democrats | Alexander James Shingler | 469 | 36.0 | −0.7 | |
| Green | Pepita Collins | 192 | 14.8 | +0.5 | |
| Liberal | Derek Fredrick Edmond Tanswell | 64 | 4.9 | N/A | |
| Majority | 107 | 8.3 | +6.7 | ||
| Turnout | 1,312 | ||||
| Conservative hold | Swing | ||||
| Party | Candidate | Votes | % | ±% | |
|---|---|---|---|---|---|
| Liberal Democrats | Thomas Ronan | 594 | 48.8 | +4.7 | |
| Conservative | Richard James Austin Greenwell | 493 | 40.5 | +5.2 | |
| Labour | Denise Ruth Carter | 131 | 10.8 | N/A | |
| Majority | 101 | 8.3 | −0.5 | ||
| Turnout | 1,224 | ||||
| Liberal Democrats hold | Swing | ||||
| Party | Candidate | Votes | % | ±% | |
|---|---|---|---|---|---|
| Conservative | Tanys Eileen Pullin | 887 | 58.0 | +27.5 | |
| Labour | Adam David Fyfe | 642 | 42.0 | +31.6 | |
| Majority | N/A | ||||
| Turnout | 1,529 | ||||
| Conservative gain from Liberal Democrats | Swing | ||||
| Party | Candidate | Votes | % | ±% | |
|---|---|---|---|---|---|
| Conservative | Ken Maddock | 393 | 50.3 | −2.3 | |
| Liberal Democrats | Claire Sully | 389 | 49.7 | +16.4 | |
| Majority | 4 | 0.6 | |||
| Turnout | 782 | 39.0 | |||
| Conservative hold | Swing | ||||