| |||||||||||||||||||||||||||||||||||||||||||||||||
All 70 seats to Lincolnshire County Council 36 seats needed for a majority | |||||||||||||||||||||||||||||||||||||||||||||||||
---|---|---|---|---|---|---|---|---|---|---|---|---|---|---|---|---|---|---|---|---|---|---|---|---|---|---|---|---|---|---|---|---|---|---|---|---|---|---|---|---|---|---|---|---|---|---|---|---|---|
| |||||||||||||||||||||||||||||||||||||||||||||||||
Map showing the results of the 2017 Lincolnshire County Council elections. | |||||||||||||||||||||||||||||||||||||||||||||||||
|
The 2017 Lincolnshire County Council election took place in non-metropolitan Lincolnshire on 4 May 2017 as part of the 2017 local elections in the United Kingdom. [2] A total of 70 councillors were elected across the seven non-metropolitan districts that make up the administrative county of Lincolnshire from 70 single member electoral divisions by first-past-the-post voting for a four-year term of office. The election did not include North Lincolnshire and North East Lincolnshire as they are separate unitary authorities.
All locally registered electors (British, Irish, Commonwealth and European Union citizens) who were aged 18 or over on Thursday 4 May 2017 were entitled to vote in the local elections. Those who were temporarily away from their ordinary address (for example, away working, on holiday, in student accommodation or in hospital) were also entitled to vote in the local elections, [3] although those who had moved abroad and registered as overseas electors cannot vote in the local elections. It is possible to register to vote at more than one address (such as a university student who had a term-time address and lives at home during holidays) at the discretion of the local Electoral Register Office, but it remains an offence to vote more than once in the same local government election. [4]
The result saw Conservatives led by Leader of the Council Martin Hill achieve a landslide of seats, retaking control of the council, winning 58 out of the 70 seats giving them a majority of 46 over all other parties and leaving 12 councillors in opposition. The result saw the main former opposition of UKIP councillors wiped out, Labour lost four seats and the Lincolnshire Independents were reduced to just a single seat. [5]
The Local Government Boundary Commission for England undertook a review of the county in 2016 and recommended a change to the boundaries of the electoral divisions, as well as reducing the number of county councillors by 7 to 70. These changes took effect at the May 2017 election. [6]
Lincolnshire County Council election, 2017 (70 seats) | |||||||||||||||
---|---|---|---|---|---|---|---|---|---|---|---|---|---|---|---|
Party | Candidates | Votes | |||||||||||||
Stood | Elected | Gained | Unseated | Net | % of total | % | No. | Net % | |||||||
Conservative | 70 | 58 | 23 | 0 | 23 | 82.86 | 53.5 | 94,357 | |||||||
Labour | 68 | 6 | 3 | 7 | 4 | 8.57 | 18.9 | 33,317 | |||||||
UKIP | 44 | 0 | 0 | 13 | 13 | 0.00 | 7.5 | 13,178 | |||||||
Liberal Democrats | 37 | 1 | 0 | 2 | 2 | 1.43 | 5.4 | 9,471 | |||||||
Green | 24 | 0 | 0 | 0 | 0 | 0.00 | 1.5 | 2,636 | |||||||
Independent | 20 | 4 | 4 | 2 | 2 | 5.71 | 6.7 | 12,276 | |||||||
Lincolnshire Independent | 19 | 1 | 1 | 9 | 8 | 1.43 | 6.3 | 11,137 | |||||||
BNP | 1 | 0 | 0 | 0 | 0 | 0.00 | 0.03 | 46 |
(6 seats, 6 electoral divisions)
Borough of Boston District (6 seats) | |||||||||||||||
---|---|---|---|---|---|---|---|---|---|---|---|---|---|---|---|
Party | Candidates | Votes | |||||||||||||
Stood | Elected | Gained | Unseated | Net | % of total | % | No. | Net % | |||||||
Conservative | 6 | ||||||||||||||
Labour | 6 | ||||||||||||||
UKIP | 6 | ||||||||||||||
Green | 5 | ||||||||||||||
Liberal Democrats | 3 | ||||||||||||||
Independent | 3 | ||||||||||||||
Lincolnshire Independent | 2 |
Party | Candidate | Votes | % | ±% | |
---|---|---|---|---|---|
Conservative | Paul Anthony Skinner | 1277 | 44.8 | +4.4 | |
UKIP | Felicity Elizabeth Ellen Ransome | 493 | 17.3 | -28.5 | |
Independent | Peter Bedford | 318 | 11.2 | n/a | |
Independent | Barrie James Pierpoint | 287 | 10.1 | n/a | |
Labour | Susan Joan Walsh | 252 | 8.8 | -5.0 | |
Independent | Ossy Snell | 224 | 7.9 | n/a | |
Turnout | 7871 | 36 | +5 | ||
Conservative gain from UKIP | Swing | ||||
Party | Candidate | Votes | % | ±% | |
---|---|---|---|---|---|
Conservative | Aaron Spencer | 687 | 36.0 | ||
UKIP | Carleen Dickinson | 458 | 24.0 | ||
Labour | Nigel Richard Welton | 356 | 18.7 | ||
Liberal Democrats | Jason Stevenson | 148 | 7.8 | ||
Lincolnshire Independent | Tiggs Keywood Wainwright | 135 | 7.1 | ||
Green | Margaret Ann Taylor | 122 | 6.4 | ||
Turnout | 1906 | 25 | |||
Conservative win (new seat) |
Party | Candidate | Votes | % | ±% | |
---|---|---|---|---|---|
Conservative | Michael Brookes | 1865 | 68.7 | +23.1 | |
UKIP | Jodie Louise Sutton | 416 | 15.3 | -25.9 | |
Labour | Norman Allan Walsh | 297 | 10.9 | -2.3 | |
Green | Gordon Laurence Stephens | 135 | 5.0 | n/a | |
Turnout | 2713 | 33 | +6 | ||
Conservative hold | Swing | ||||
Party | Candidate | Votes | % | ±% | |
---|---|---|---|---|---|
Independent | Alison Mary Austin | 981 | 42.5 | n/a | |
Conservative | David Andrew Brown | 717 | 31.1 | +16.2 | |
UKIP | Don Ransome | 362 | 15.7 | -27.1 | |
Labour | Andy Cook | 174 | 7.5 | +3.1 | |
Green | Victoria Percival | 42 | 1.8 | n/a | |
Liberal Democrats | Mat Mohns | 33 | 1.4 | n/a | |
Turnout | 2309 | 30 | -3 | ||
Independent gain from Lincolnshire Independent | Swing | ||||
Party | Candidate | Votes | % | ±% | |
---|---|---|---|---|---|
Conservative | Paula Cooper | 708 | 36.7 | +27.6 | |
Labour | Ben Cook | 446 | 23.1 | +5.9 | |
UKIP | James Gary Edwards | 380 | 19.7 | -25.1 | |
Liberal Democrats | Ralph Douglas Pryke | 328 | 17.0 | n/a | |
Green | Angela Mary Pitt | 67 | 3.5 | n/a | |
Turnout | 1929 | 29 | -1 | ||
Conservative gain from UKIP | Swing | ||||
Party | Candidate | Votes | % | ±% | |
---|---|---|---|---|---|
Conservative | Martin Alexander Griggs | 868 | 40.5 | ||
Labour | Paul Robert Kenny | 573 | 26.7 | ||
UKIP | Sue Ransome | 537 | 25.0 | ||
Lincolnshire Independent | Val Pain | 88 | 4.1 | ||
Green | Sean Matthew Rickell | 79 | 3.7 | ||
Turnout | 2145 | 28 | |||
Conservative win (new seat) |
(13 seats, 13 electoral divisions)
East Lindsey District (13 seats) | |||||||||||||||
---|---|---|---|---|---|---|---|---|---|---|---|---|---|---|---|
Party | Candidates | Votes | |||||||||||||
Stood | Elected | Gained | Unseated | Net | % of total | % | No. | Net % | |||||||
Conservative | 13 | ||||||||||||||
Labour | 13 | ||||||||||||||
UKIP | 9 | ||||||||||||||
Lincolnshire Independent | 5 | ||||||||||||||
Independent | 2 | ||||||||||||||
BNP | 1 |
Party | Candidate | Votes | % | ±% | |
---|---|---|---|---|---|
Conservative | Colin Matthews | 1187 | 41.1 | +8.4 | |
Lincolnshire Independent | Steve Palmer | 1145 | 39.6 | +4.5 | |
Labour | Graham Archer | 298 | 10.3 | -1.8 | |
UKIP | Julia Pears | 258 | 8.9 | -11.1 | |
Turnout | 2888 | 36 | +2 | ||
Conservative gain from Lincolnshire Independent | Swing | ||||
Party | Candidate | Votes | % | ±% | |
---|---|---|---|---|---|
Conservative | Bill Aron | 1733 | 63.4 | ||
Labour | Mark William Taylor | 541 | 19.8 | ||
UKIP | Mike Beecham | 459 | 16.8 | ||
Turnout | 2733 | 31 | |||
Conservative win (new seat) |
Party | Candidate | Votes | % | ±% | |
---|---|---|---|---|---|
Conservative | Colin John Davie | 1703 | 63.3 | +10.9 | |
UKIP | Mark Vincent Dannatt | 539 | 20.0 | n/a | |
Labour | Tony Howard | 450 | 16.7 | -13.2 | |
Turnout | 2692 | 34 | -1 | ||
Conservative hold | Swing | ||||
Party | Candidate | Votes | % | ±% | |
---|---|---|---|---|---|
Conservative | Tony Bridges | 1539 | 56.6 | +27.4 | |
Labour | Ros Jackson | 1178 | 43.4 | -3.5 | |
Turnout | 2717 | 35 | +1 | ||
Conservative gain from Labour | Swing | ||||
Party | Candidate | Votes | % | ±% | |
---|---|---|---|---|---|
Labour | Sarah Rosemary Dodds | 1216 | 40.8 | +0.2 | |
Independent | Jill Makinson-Sanders | 833 | 27.9 | +1.5 | |
Conservative | Chris Green | 788 | 26.4 | +10.6 | |
UKIP | Tristan Rudolf Matthews | 101 | 3.4 | -13.8 | |
BNP | Robert John Ashton | 46 | 1.5 | n/a | |
Turnout | 2984 | 38 | +4 | ||
Labour hold | Swing | ||||
Party | Candidate | Votes | % | ±% | |
---|---|---|---|---|---|
Conservative | Hugo Marfleet | 1873 | 60.9 | +7.4 | |
Lincolnshire Independent | Daniel Anthony Simpson | 724 | 23.5 | -2.8 | |
Labour | Kate Elizabeth Anne Berridge | 479 | 15.6 | +3.3 | |
Turnout | 3076 | 34 | -2 | ||
Conservative hold | Swing | ||||
Party | Candidate | Votes | % | ±% | |
---|---|---|---|---|---|
Labour | Graham Edward Cullen | 1024 | 35.4 | +3.2 | |
Conservative | Noi Sear | 972 | 33.6 | +26.8 | |
UKIP | John Peter Critchlow | 565 | 19.6 | -14.0 | |
Lincolnshire Independent | Pauline June Palmer | 328 | 11.4 | -6.0 | |
Turnout | 2889 | 37 | -1 | ||
Labour gain from UKIP | Swing | ||||
Party | Candidate | Votes | % | ±% | |
---|---|---|---|---|---|
Conservative | Daniel McNally | 1909 | 80.0 | ||
Labour | Stephen Anthony Holland | 477 | 20.0 | ||
Turnout | 2386 | 31 | |||
Conservative win (new seat) |
Party | Candidate | Votes | % | ±% | |
---|---|---|---|---|---|
Conservative | Carl Stuart Macey | 1116 | 47.4 | +19.8 | |
UKIP | Danny Brookes | 666 | 28.3 | -13.1 | |
Labour | Phil Gaskell | 572 | 24.3 | -6.7 | |
Turnout | 2354 | 26 | -3 | ||
Conservative gain from UKIP | Swing | ||||
Party | Candidate | Votes | % | ±% | |
---|---|---|---|---|---|
Conservative | Steve Kirk | 1162 | 46.4 | +13.6 | |
Lincolnshire Independent | Chris Pain | 515 | 20.6 | n/a | |
Labour | Maggie Gray | 450 | 18.0 | -8.8 | |
UKIP | Susan Anita Jane Blackburn | 375 | 15.0 | -20.6 | |
Turnout | 2502 | 29 | +1 | ||
Conservative gain from UKIP | Swing | ||||
Party | Candidate | Votes | % | ±% | |
---|---|---|---|---|---|
Conservative | Tom Ashton | 1922 | 68.8 | +25.0 | |
UKIP | Jonathan Howard Noble | 534 | 19.1 | -25.3 | |
Labour | Phillip Martin Smith | 338 | 12.1 | +0.2 | |
Turnout | 2794 | 31 | -1 | ||
Conservative gain from UKIP | Swing | ||||
Party | Candidate | Votes | % | ±% | |
---|---|---|---|---|---|
Conservative | Wendy Bowkett | 1389 | 44.9 | +10.6 | |
UKIP | Victoria Ayling | 661 | 21.4 | -31.5 | |
Lincolnshire Independent | Jim Swanson | 618 | 20.0 | n/a | |
Labour | Ellen Wright | 343 | 11.1 | -1.7 | |
Independent | Eddie Hodgson | 82 | 2.7 | n/a | |
Turnout | 3093 | 33 | -2 | ||
Conservative gain from UKIP | Swing | ||||
Party | Candidate | Votes | % | ±% | |
---|---|---|---|---|---|
Conservative | Patricia Anne Bradwell | 2605 | 82.3 | +32.1 | |
Labour | Colin David Rickett | 560 | 17.7 | +6.8 | |
Turnout | 3165 | 36 | +2 | ||
Conservative hold | Swing | ||||
(8 seats, 8 electoral divisions)
City of Lincoln District (8 seats) | |||||||||||||||
---|---|---|---|---|---|---|---|---|---|---|---|---|---|---|---|
Party | Candidates | Votes | |||||||||||||
Stood | Elected | Gained | Unseated | Net | % of total | % | No. | Net % | |||||||
Conservative | 8 | ||||||||||||||
Labour | 8 | ||||||||||||||
UKIP | 8 | ||||||||||||||
Green | 8 | ||||||||||||||
Liberal Democrats | 8 |
Party | Candidate | Votes | % | ±% | |
---|---|---|---|---|---|
Conservative | Eddie Strengiel | 1237 | 50.0 | +20.2 | |
Labour | Rosanne Christina Kirk | 870 | 35.2 | +0.1 | |
UKIP | Kevin John Harrington | 232 | 9.4 | -20.2 | |
Liberal Democrats | Tony Richardson | 90 | 3.6 | +1.9 | |
Green | John Anthony Radford | 45 | 1.8 | n/a | |
Turnout | 2474 | 35 | +9 | ||
Conservative gain from Labour | Swing | ||||
Party | Candidate | Votes | % | ±% | |
---|---|---|---|---|---|
Labour | Kevin John Clarke | 950 | 49.3 | -0.9 | |
Conservative | Alan William Briggs | 665 | 34.5 | +15.8 | |
UKIP | Tim Richens | 122 | 6.3 | -19.1 | |
Green | Sally Anne Horscroft | 112 | 5.8 | n/a | |
Liberal Democrats | Morgan Fae Aran | 78 | 4.0 | -0.7 | |
Turnout | 1927 | 27 | +1 | ||
Labour hold | Swing | ||||
Party | Candidate | Votes | % | ±% | |
---|---|---|---|---|---|
Labour | Rob Parker | 1593 | 61.7 | ||
Conservative | Kateryna Roures Salvador | 581 | 22.5 | ||
Green | Benjamin Jeffrey Leigh Loryman | 158 | 6.1 | ||
Liberal Democrats | Stephen Peter Lonsdale | 153 | 5.9 | ||
UKIP | Tony Todd | 97 | 3.8 | ||
Turnout | 1927 | 27 | |||
Labour win (new seat) |
Party | Candidate | Votes | % | ±% | |
---|---|---|---|---|---|
Conservative | Christopher Edward Reid | 1173 | 41.8 | ||
Labour | Jackie Lisa Kirk | 1157 | 41.2 | ||
UKIP | Andrew Dunn | 194 | 6.9 | ||
Liberal Democrats | Nicole Danielle Pouncey | 174 | 6.2 | ||
Green | Edward Evelyn Francis | 109 | 3.9 | ||
Turnout | 2807 | 40 | |||
Conservative win (new seat) |
Party | Candidate | Votes | % | ±% | |
---|---|---|---|---|---|
Conservative | Matthew Fido | 1022 | 41.9 | +9.9 | |
Labour | Geoff Ellis | 1000 | 41.0 | +9.2 | |
UKIP | Nicola Jane Smith | 233 | 9.5 | -22.6 | |
Liberal Democrats | Lynn Joan Pepper | 114 | 4.7 | +0.5 | |
Green | Christopher Padley | 71 | 2.9 | n/a | |
Turnout | 2440 | 34 | +5 | ||
Conservative gain from UKIP | Swing | ||||
Party | Candidate | Votes | % | ±% | |
---|---|---|---|---|---|
Labour | Julie Elizabeth Killey | 1087 | 53.6 | +2.4 | |
Conservative | Alex Sayer | 507 | 25.0 | +10.1 | |
UKIP | Hannah Poppy Smith | 164 | 8.1 | -15.0 | |
Liberal Democrats | Natasha Seeta Chapman | 138 | 6.8 | -1.9 | |
Green | Simon John Offord Tooke | 133 | 6.6 | n/a | |
Turnout | 2029 | 28 | +9 | ||
Labour hold | Swing | ||||
Party | Candidate | Votes | % | ±% | |
---|---|---|---|---|---|
Labour | Robin Anthony Renshaw | 997 | 44.6 | ||
Conservative | Andy Kerry | 884 | 39.5 | ||
UKIP | Laura Anastasia Smith | 121 | 5.4 | ||
Liberal Democrats | Caroline Hilda Kenyon | 119 | 5.3 | ||
Green | Fiona McKenna | 116 | 5.2 | ||
Turnout | 2237 | 31 | |||
Labour win (new seat) |
Party | Candidate | Votes | % | ±% | |
---|---|---|---|---|---|
Conservative | Hilton Spratt | 1612 | 55.1 | ||
Labour | Chris Burke | 912 | 31.2 | ||
UKIP | Barry Charles Stonham | 177 | 6.1 | ||
Liberal Democrats | Corinne Byron | 126 | 4.3 | ||
Green | Lee Thomas | 96 | 3.3 | ||
Turnout | 2923 | 41 | |||
Conservative win (new seat) |
(11 seats, 11 electoral divisions)
North Kesteven District (11 seats) | |||||||||||||||
---|---|---|---|---|---|---|---|---|---|---|---|---|---|---|---|
Party | Candidates | Votes | |||||||||||||
Stood | Elected | Gained | Unseated | Net | % of total | % | No. | Net % | |||||||
Conservative | 11 | ||||||||||||||
Labour | 11 | ||||||||||||||
Lincolnshire Independent | 8 | ||||||||||||||
Liberal Democrats | 7 | ||||||||||||||
UKIP | 4 | ||||||||||||||
Green | 2 | ||||||||||||||
Independent | 2 |
Party | Candidate | Votes | % | ±% | |
---|---|---|---|---|---|
Lincolnshire Independent | Marianne Jane Overton | 1952 | 60.4 | ||
Conservative | Raymond John Phillips | 1128 | 34.9 | ||
UKIP | John Diks | 128 | 4.0 | ||
Turnout | 3231 | 36.0 | |||
Lincolnshire Independent win (new seat) |
Party | Candidate | Votes | % | ±% | |
---|---|---|---|---|---|
Conservative | Mike Thompson | 1453 | 59.3 | ||
Lincolnshire Independent | Nikki Dillon | 282 | 11.5 | ||
Liberal Democrats | Ross David Pepper | 282 | 11.5 | ||
Labour | Michael Blackburn | 276 | 11.3 | ||
UKIP | Nick Smith | 153 | 6.2 | ||
Turnout | 2452 | 31.0 | |||
Conservative win (new seat) |
Party | Candidate | Votes | % | ±% | |
---|---|---|---|---|---|
Conservative | Barry Young | 1912 | 66.7 | ||
Lincolnshire Independent | Susanna Mariam Matthan | 398 | 13.9 | ||
Labour | Paul Andrew Edward-Shea | 322 | 11.2 | ||
Liberal Democrats | George Henry Hill | 229 | 8.0 | ||
Turnout | 2867 | 32 | |||
Conservative win (new seat) |
Party | Candidate | Votes | % | ±% | |
---|---|---|---|---|---|
Conservative | Stephen Peter Roe | 1244 | 57.2 | +28.3 | |
Labour | Mark William Reynolds | 526 | 25.2 | +11.9 | |
Liberal Democrats | Jim Charters | 303 | 13.9 | -17.7 | |
Green | James Daniel Reeves | 94 | 4.3 | n/a | |
Turnout | 2173 | 29 | -4 | ||
Conservative gain from Liberal Democrats | Swing | ||||
Party | Candidate | Votes | % | ±% | |
---|---|---|---|---|---|
Conservative | Rob Kendrick | 1384 | 58.9 | ||
Lincolnshire Independent | Nick Byatt | 504 | 21.4 | ||
Labour | John Robert Sharman | 335 | 14.2 | ||
Liberal Democrats | Diana Elizabeth Catton | 124 | 5.3 | ||
Turnout | 2351 | 32 | |||
Conservative win (new seat) |
Party | Candidate | Votes | % | ±% | |
---|---|---|---|---|---|
Conservative | Ron Oxby | 1427 | 49.6 | ||
Lincolnshire Independent | Peter Charles Lundgren | 922 | 32.0 | ||
Labour | Sally Ann Lane Benthall | 332 | 11.5 | ||
Liberal Democrats | Jill Whitfield | 192 | 6.7 | ||
Turnout | |||||
Conservative win (new seat) |
Party | Candidate | Votes | % | ±% | |
---|---|---|---|---|---|
Conservative | Mark John Storer | 1442 | 50.2 | ||
Lincolnshire Independent | Steve Clegg | 1172 | 40.8 | ||
Labour | Richard Hughes | 255 | 8.9 | ||
Turnout | |||||
Conservative win (new seat) |
Party | Candidate | Votes | % | ±% | |
---|---|---|---|---|---|
Conservative | Kate Cook | 1068 | 47.9 | +25.7 | |
Labour | Jim Clarke | 410 | 18.4 | +0.6 | |
Lincolnshire Independent | Mark Guy Allen | 341 | 15.3 | -12.6 | |
Independent | Paul Coyne | 332 | 14.9 | n/a | |
Liberal Democrats | Darryl Joshua Smalley | 66 | 3.0 | n/a | |
Independent | Robert Charles Greetham | 12 | 0.5 | n/a | |
Turnout | 2231 | 28 | +5 | ||
Conservative gain from Lincolnshire Independent | Swing | ||||
Party | Candidate | Votes | % | ±% | |
---|---|---|---|---|---|
Conservative | Andrew Gibson Hagues | 1430 | 63.2 | ||
Lincolnshire Independent | David Suiter | 484 | 21.4 | ||
Labour | Linda Edwards-Shea | 340 | 15.0 | ||
Turnout | 2261 | 30 | |||
Conservative win (new seat) |
Party | Candidate | Votes | % | ±% | |
---|---|---|---|---|---|
Conservative | Christine Talbot | 1378 | 62.1 | ||
Labour | Pat Aston | 401 | 18.1 | ||
UKIP | Joe McAndrew | 326 | 14.7 | ||
Green | Flora Weichmann | 111 | 5.0 | ||
Turnout | 2220 | 29 | |||
Conservative win (new seat) |
Party | Candidate | Votes | % | ±% | |
---|---|---|---|---|---|
Conservative | Lindsey Ann Cawrey | 1535 | 67.9 | ||
Labour | Mike Benthall | 316 | 14.0 | ||
Liberal Democrats | Les Whitfield | 268 | 11.8 | ||
UKIP | Elaine Margaret Hamnett | 140 | 6.2 | ||
Turnout | 2262 | 29 | |||
Conservative win (new seat) |
(9 seats, 9 electoral divisions)
South Holland District (9 seats) | |||||||||||||||
---|---|---|---|---|---|---|---|---|---|---|---|---|---|---|---|
Party | Candidates | Votes | |||||||||||||
Stood | Elected | Gained | Unseated | Net | % of total | % | No. | Net % | |||||||
Conservative | 9 | ||||||||||||||
Labour | 9 | ||||||||||||||
UKIP | 6 | ||||||||||||||
Liberal Democrats | 5 | ||||||||||||||
Independent | 4 | ||||||||||||||
Green | 1 |
Party | Candidate | Votes | % | ±% | |
---|---|---|---|---|---|
Conservative | Nigel Harry Pepper | 2194 | 81.6 | ||
Labour | Darryl Baird Kirk | 271 | 10.1 | ||
Liberal Democrats | Charles James Finister | 211 | 7.8 | ||
Turnout | 2690 | 31 | |||
Conservative win (new seat) |
Party | Candidate | Votes | % | ±% | |
---|---|---|---|---|---|
Conservative | Rodney Grocock | 1348 | 58.0 | +19.3 | |
Independent | Jane Lesley King | 794 | 34.1 | n/a | |
Labour | Richard James Mair | 175 | 7.5 | +0.1 | |
Turnout | 2326 | 31 | +3 | ||
Conservative hold | Swing | ||||
Party | Candidate | Votes | % | ±% | |
---|---|---|---|---|---|
Conservative | Nick Worth | 1536 | 63.7 | +18.9 | |
UKIP | Paul Cayton Foyster | 596 | 24.7 | -17.3 | |
Labour | Helena Mair | 274 | 11.4 | +2.2 | |
Turnout | 2413 | 30 | +2 | ||
Conservative hold | Swing | ||||
Party | Candidate | Votes | % | ±% | |
---|---|---|---|---|---|
Conservative | Peter Ephraim Coupland | 1964 | 68.0 | +26.6 | |
UKIP | Robert Antony Gibson | 535 | 18.5 | -17.8 | |
Labour | Lucinda Emmeline Preston | 256 | 8.9 | +1.8 | |
Liberal Democrats | Philip Edward Hammersley | 124 | 4.3 | +2.2 | |
Turnout | 2890 | 34 | |||
Conservative hold | Swing | ||||
Party | Candidate | Votes | % | ±% | |
---|---|---|---|---|---|
Conservative | Eddy Poll | 1288 | 59.9 | ||
UKIP | Richard Geoffrey Fairman | 504 | 23.5 | ||
Labour | Karen Elizabeth Lee | 212 | 9.9 | ||
Liberal Democrats | Kathleen Mary Tanner | 145 | 6.7 | ||
Turnout | 2149 | 28 | |||
Conservative win (new seat) |
Party | Candidate | Votes | % | ±% | |
---|---|---|---|---|---|
Conservative | Elizabeth Jane Sneath | 1383 | 66.2 | +22.7 | |
UKIP | Emily Martha Mary Bates | 253 | 12.1 | -27.2 | |
Labour | John Andrew Grocock | 155 | 7.4 | -0.3 | |
Green | Martin Blake | 128 | 6.1 | n/a | |
Independent | Douglas William Dickens | 87 | 4.2 | n/a | |
Liberal Democrats | Mark John Currier | 80 | 3.8 | n/a | |
Turnout | |||||
Conservative hold | Swing | ||||
Party | Candidate | Votes | % | ±% | |
---|---|---|---|---|---|
Conservative | Christine Jane Lawton | 1138 | 58.2 | +32.2 | |
UKIP | Pete Williams | 426 | 21.8 | -14.8 | |
Labour | Andrew Charles Bowell | 259 | 13.2 | +6.2 | |
Liberal Democrats | Jordan Philip Raymond Swallow | 133 | 6.8 | n/a | |
Turnout | 1956 | 25 | +2 | ||
Conservative gain from UKIP | Swing | ||||
Party | Candidate | Votes | % | ±% | |
---|---|---|---|---|---|
Independent | Angela Mary Newton | 1026 | 46.0 | n/a | |
Conservative | Gary John Taylor | 976 | 43.7 | +22.2 | |
Labour | Wojciech Stanislaw Kowalewski | 221 | 9.9 | +3.4 | |
Turnout | 2231 | 29 | +2 | ||
Independent gain from Lincolnshire Independent | Swing | ||||
Party | Candidate | Votes | % | ±% | |
---|---|---|---|---|---|
Independent | Christopher James Thomas Harrison Brewis | 1375 | 54.0 | n/a | |
Conservative | Jack Tyrrell | 1017 | 40.0 | +14.2 | |
Labour | Paul Gowen | 153 | 6.0 | +0.6 | |
Turnout | 2545 | 33 | +4 | ||
Independent gain from Lincolnshire Independent | Swing | ||||
(14 seats, 14 electoral divisions)
South Kesteven District (14 seats) | |||||||||||||||
---|---|---|---|---|---|---|---|---|---|---|---|---|---|---|---|
Party | Candidates | Votes | |||||||||||||
Stood | Elected | Gained | Unseated | Net | % of total | % | No. | Net % | |||||||
Conservative | 14 | ||||||||||||||
Labour | 14 | ||||||||||||||
Liberal Democrats | 8 | ||||||||||||||
Green | 6 | ||||||||||||||
Independent | 6 | ||||||||||||||
UKIP | 4 | ||||||||||||||
Lincolnshire Independent | 3 |
Party | Candidate | Votes | % | ±% | |
---|---|---|---|---|---|
Conservative | Sue Woolley | 1950 | 79.9 | ||
Labour | Robbie Britton | 460 | 18.9 | ||
Turnout | 2440 | 34 | |||
Conservative win (new seat) |
Party | Candidate | Votes | % | ±% | |
---|---|---|---|---|---|
Conservative | Robert Philip Henry Reid | 1180 | 47.9 | ||
Lincolnshire Independent | Helen Nunziatina Joan Powell | 786 | 31.9 | ||
Labour | Bob Mumby | 287 | 11.7 | ||
Liberal Democrats | Ian Beresford Smith | 203 | 8.2 | ||
Turnout | 2461 | 28 | |||
Conservative win (new seat) |
Party | Candidate | Votes | % | ±% | |
---|---|---|---|---|---|
Conservative | Bob Adams | 1660 | 67.0 | +16.4 | |
Labour | Phil Brett | 264 | 10.7 | -3.7 | |
UKIP | Patrick Beese | 223 | 9.0 | -22.6 | |
Liberal Democrats | John George Ramsbottom | 212 | 8.6 | n/a | |
Green | Ian Grenville Andrews | 116 | 4.7 | n/a | |
Turnout | 2476 | 33 | +4 | ||
Conservative hold | Swing | ||||
Party | Candidate | Votes | % | ±% | |
---|---|---|---|---|---|
Conservative | Barry Martin Dobson | 1059 | 45.0 | ||
Labour | Phil Dilks | 901 | 38.3 | ||
Liberal Democrats | Adam Edward Brookes | 388 | 16.5 | ||
Turnout | 2355 | 30 | |||
Conservative win (new seat) |
Party | Candidate | Votes | % | ±% | |
---|---|---|---|---|---|
Conservative | Rosemary Helen Woolley | 1114 | 45.2 | ||
Independent | Ashley John Baxter | 804 | 32.6 | ||
Independent | Bob Broughton | 544 | 22.1 | ||
Turnout | 2466 | 31 | |||
Conservative win (new seat) |
Party | Candidate | Votes | % | ±% | |
---|---|---|---|---|---|
Conservative | Martin John Hill | 2041 | 64.8 | +15.2 | |
Independent | Jan Wayne Hansen | 763 | 24.2 | n/a | |
Labour | Tracey Ann Forman | 339 | 10.8 | +0.8 | |
Turnout | 3150 | 40 | +3 | ||
Conservative hold | Swing | ||||
Party | Candidate | Votes | % | ±% | |
---|---|---|---|---|---|
Conservative | Mark Anthony Whittington | 1315 | 57.0 | +19.2 | |
Labour | Louise Kathleen Selisny Clack | 815 | 35.3 | +5.4 | |
UKIP | Yvonne Jennifer Stevens | 179 | 7.8 | n/a | |
Turnout | 2309 | 28 | +6 | ||
Conservative hold | Swing | ||||
Party | Candidate | Votes | % | ±% | |
---|---|---|---|---|---|
Conservative | Linda Wootten | 1048 | 52.1 | +14.9 | |
Labour | John George Morgan | 547 | 27.2 | -0.2 | |
Independent | Paul Martin | 293 | 14.6 | n/a | |
Green | Helen Joan Andrews | 62 | 3.1 | n/a | |
Liberal Democrats | John Richard Glendy Bland | 59 | 2.9 | -0.7 | |
Turnout | 2011 | 27 | -5 | ||
Conservative hold | Swing | ||||
Party | Candidate | Votes | % | ±% | |
---|---|---|---|---|---|
Conservative | Ray Wootten | 2119 | 74.1 | +24.9 | |
Labour | Rob Shorrock | 412 | 14.4 | +0.8 | |
Liberal Democrats | Claire Jayne Lunn | 168 | 5.9 | n/a | |
Green | Ian Paul Simmons | 152 | 5.3 | n/a | |
Turnout | 2859 | 33 | +1 | ||
Conservative hold | Swing | ||||
Party | Candidate | Votes | % | ±% | |
---|---|---|---|---|---|
Conservative | Adam Neil Stokes | 802 | 39.8 | -4.0 | |
Labour | Charmaine Dawn Morgan | 789 | 39.1 | -8.3 | |
UKIP | Joshua Scarborough | 173 | 8.6 | n/a | |
Liberal Democrats | Ellie Symonds | 104 | 5.2 | -3.5 | |
Green | Gerhard Lohmann-Bond | 97 | 4.8 | n/a | |
Independent | Louis Jon Stead | 47 | 2.3 | n/a | |
Turnout | 2016 | 25 | +4 | ||
Conservative gain from Labour | Swing | ||||
Party | Candidate | Votes | % | ±% | |
---|---|---|---|---|---|
Conservative | Richard Graham Davies | 988 | 60.7 | ||
Labour | Sue Orwin | 275 | 16.9 | ||
Independent | Mike Taylor | 169 | 10.4 | ||
Green | Sarah Alexandra Tatlow | 116 | 7.1 | ||
Independent | Stephen Robert Hewerdine | 69 | 4.2 | ||
Turnout | 1627 | 29 | |||
Conservative win (new seat) |
Party | Candidate | Votes | % | ±% | |
---|---|---|---|---|---|
Conservative | Alexander Paul Maughan | 1722 | 53.1 | +12.3 | |
Independent | Paul Wood | 1228 | 37.8 | -11.1 | |
Labour | Stephen James Linden-Wyatt | 290 | 8.9 | -1.4 | |
Turnout | 3245 | 40 | +3 | ||
Conservative gain from Independent | Swing | ||||
Party | Candidate | Votes | % | ±% | |
---|---|---|---|---|---|
Conservative | Robert Lloyd Foulkes | 1059 | 44.7 | ||
Liberal Democrats | Harrish Bisnauthsing | 507 | 21.4 | ||
Labour | Deborah Jane Frances Hughes | 289 | 12.2 | ||
Independent | Steve Carroll | 288 | 12.2 | ||
UKIP | David Thomas Taylor | 219 | 9.3 | ||
Turnout | 2367 | 28 | |||
Conservative win (new seat) |
Party | Candidate | Votes | % | ±% | |
---|---|---|---|---|---|
Conservative | David Brailsford | 1573 | 65.7 | +5.7 | |
Liberal Democrats | Anita Annabelle Dora Day | 333 | 13.9 | -12.5 | |
Labour | Adam Robert Wissen | 265 | 11.1 | -2.5 | |
Green | Simon Whitmore | 216 | 9.0 | n/a | |
Turnout | 2396 | 32 | +6 | ||
Conservative hold | Swing | ||||
(9 seats, 9 electoral divisions)
West Lindsey District (9 seats) | |||||||||||||||
---|---|---|---|---|---|---|---|---|---|---|---|---|---|---|---|
Party | Candidates | Votes | |||||||||||||
Stood | Elected | Gained | Unseated | Net | % of total | % | No. | Net % | |||||||
Conservative | 9 | ||||||||||||||
Labour | 9 | ||||||||||||||
UKIP | 7 | ||||||||||||||
Liberal Democrats | 6 | ||||||||||||||
Independent | 3 | ||||||||||||||
Green | 2 | ||||||||||||||
Lincolnshire Independent | 1 |
Party | Candidate | Votes | % | ±% | |
---|---|---|---|---|---|
Conservative | Ian Gordon Fleetwood | 1523 | 53.3 | +20.4 | |
Lincolnshire Independent | Chris Darcel | 743 | 26.0 | -3.6 | |
Labour | Denise Mary Schofield | 317 | 11.1 | +0.4 | |
UKIP | Sharon Anne Spicer | 155 | 5.4 | -17.7 | |
Green | Vicky Pearson | 121 | 4.2 | n/a | |
Turnout | 2859 | 34 | -1 | ||
Conservative hold | Swing | ||||
Party | Candidate | Votes | % | ±% | |
---|---|---|---|---|---|
Liberal Democrats | Matt Boles | 596 | 39.6 | +9.5 | |
Conservative | Ashley John Parraton-Williams | 402 | 26.7 | +10.3 | |
Labour | David John Cormack | 376 | 25.0 | +8.0 | |
UKIP | Tracey Frances Lamy-Edwards | 130 | 8.6 | -27.9 | |
Turnout | 1504 | 21 | +4 | ||
Liberal Democrats gain from UKIP | Swing | ||||
Party | Candidate | Votes | % | ±% | |
---|---|---|---|---|---|
Conservative | Richard David Butroid | 1655 | 54.9 | +20.2 | |
Liberal Democrats | Noel Joseph Mullally | 638 | 21.1 | -0.4 | |
Labour | Nick Smith | 324 | 10.7 | -3.7 | |
UKIP | Samuel George Wardle | 262 | 8.7 | -20.6 | |
Green | Susan Kathleen Greenall | 138 | 4.6 | n/a | |
Turnout | 3017 | 36 | -3 | ||
Conservative hold | Swing | ||||
Party | Candidate | Votes | % | ±% | |
---|---|---|---|---|---|
Independent | Paul Michael Key | 617 | 34.0 | n/a | |
Liberal Democrats | Trevor Victor Young | 538 | 29.6 | -11.8 | |
Conservative | Sheila Christine Bibb | 327 | 18.0 | +2.9 | |
Labour | Ian Richard Bradley | 224 | 12.3 | -3.8 | |
UKIP | Neville Shaun Jones | 110 | 6.1 | -21.3 | |
Turnout | 1816 | 24 | +7 | ||
Independent gain from Liberal Democrats | Swing | ||||
Party | Candidate | Votes | % | ±% | |
---|---|---|---|---|---|
Conservative | Lewis Strange | 1655 | 49.9 | +18.2 | |
Liberal Democrats | Stephen Bunney | 667 | 20.1 | +0.5 | |
Independent | Guy Edward Donald Grainger | 504 | 15.2 | n/a | |
Labour | Ian Edwards Sharp | 286 | 8.6 | -2.4 | |
UKIP | Greg Gough | 207 | 6.2 | -23.3 | |
Turnout | 3319 | 36 | +9 | ||
Conservative hold | Swing | ||||
Party | Candidate | Votes | % | ±% | |
---|---|---|---|---|---|
Conservative | Jackie Brockway | 1955 | 67.9 | +24.2 | |
Liberal Democrats | Christopher Higham | 559 | 19.4 | -1.6 | |
Labour | Robert John Frederick Methuen | 281 | 9.8 | -1.1 | |
UKIP | William Billett | 83 | 2.9 | -21.5 | |
Turnout | 2878 | 36 | +3 | ||
Conservative hold | Swing | ||||
Party | Candidate | Votes | % | ±% | |
---|---|---|---|---|---|
Conservative | Tony Turner | 1953 | 75.3 | +20.9 | |
Labour | Andrea Maria Clarke | 642 | 24.7 | +10.3 | |
Turnout | 2595 | 30 | +2 | ||
Conservative hold | Swing | ||||
Party | Candidate | Votes | % | ±% | |
---|---|---|---|---|---|
Conservative | Clio Lyndon Perraton-Williams | 1363 | 49.7 | +7.7 | |
Liberal Democrats | Lesley Ann Rollings | 841 | 30.7 | +7.8 | |
Labour | Jonathan Mark Harper | 307 | 11.2 | +1.1 | |
UKIP | John Edwin Saxon | 232 | 8.5 | -16.5 | |
Turnout | 2743 | 33 | +6 | ||
Conservative hold | Swing | ||||
Party | Candidate | Votes | % | ±% | |
---|---|---|---|---|---|
Conservative | Sue Rawlins | 1902 | 62.4 | +23.9 | |
Independent | Diana Meriel Rodgers | 599 | 19.6 | n/a | |
Labour | Brian Paul Jones | 548 | 18.0 | +5.6 | |
Turnout | 3049 | 35 | +3 | ||
Conservative hold | Swing | ||||
Elections to Suffolk County Council were held on 5 May 2005. The whole council was up for election with boundary changes since the last election in 2001 reducing the number of seats by 5. The Conservative Party gained control of the council from no overall control.
Elections to Lincolnshire County Council took place on 4 June 2009 as part of the 2009 United Kingdom local elections, having been delayed from 7 May, in order to coincide with elections to the European Parliament. 77 councillors were elected, each electoral division returned either one or two county councillors by first-past-the-post voting for a four-year term of office. The electoral divisions were the same as those used at the previous election in 2005.
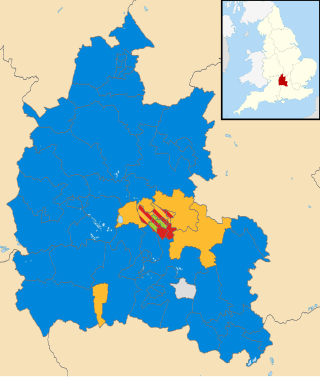
An election to Oxfordshire County Council took place on 4 June 2009 as part of the 2009 United Kingdom local elections, having been delayed from 7 May, to coincide with elections to the European Parliament. 74 councillors were elected from various electoral divisions, which returned either one, two or three county councillors each by first-past-the-post voting for a four-year term of office. The electoral divisions were the same as those used at the previous election in 2005.
An election to Somerset County Council took place on 4 June 2009 as part of the 2009 United Kingdom local elections, having been delayed from 7 May, to coincide with elections to the European Parliament. The result brought to an end 16 years of Liberal Democrat rule to a Conservative controlled administration. 58 councillors were elected from various electoral divisions, which returned one county councillor each. Members were elected by the first-past-the-post voting system for a four-year term of office. This was the last election before the number of seats was cut to 55 for the 2013 election. With a total of 58 seats being reduced to 55 for the next election.
An election to Cumbria County Council took place on 2 May 2013 as part of the 2013 United Kingdom local elections. All 84 councillors were elected from electoral divisions which returned one county councillor each by first-past-the-post voting for a four-year term of office. Following an electoral review carried out by the Local Government Boundary Commission for England, newly drawn electoral divisions were used without change in the number of county councillors.
An election to Leicestershire County Council took place on 2 May 2013 as part of the 2013 United Kingdom local elections. 55 councillors were elected from 52 electoral divisions, which returned either one or two county councillors each by first-past-the-post voting for a four-year term of office. The Conservatives held control of the council with a reduced majority of 5 seats. Despite a strong challenge from UKIP, the party only gained 2 seats whilst the Liberal Democrats lost one seat and Labour recouped some of their 2009 losses, gaining 6 seats.
An election to Hampshire County Council took place on 2 May 2013 as part of the 2013 United Kingdom local elections. 78 councillors were elected from 75 electoral divisions, which returned either one or two county councillors each by first-past-the-post voting for a four-year term of office. The electoral divisions were the same as those of the previous election in 2009. No elections were held in Portsmouth and Southampton, which are unitary authorities outside the area covered by the County Council. The election saw the Conservative Party retain overall control of the council, with a reduced majority of five councillors.
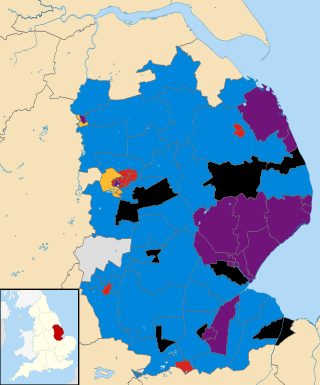
An election to Lincolnshire County Council took place on 2 May 2013 as part of the 2013 United Kingdom local elections. 77 electoral divisions returned one county councillor each by first-past-the-post voting for a four-year term of office. The electoral divisions were the same as those used at the previous election in 2009. No elections were held in North Lincolnshire or North East Lincolnshire, which are unitary authorities outside the area covered by the County Council.
The Surrey County Council election, 2013 took place on 2 May 2013 as part of the 2013 United Kingdom local elections. 81 electoral divisions returned one county councillor each by first-past-the-post voting for a four-year term of office. Following a review, new electoral division boundaries were introduced for this election, increasing the number of councillors from 80 to 81.
Elections to Gloucestershire County Council took place on 2 May 2013 as part of the 2013 United Kingdom local elections. 53 electoral divisions elected one county councillor each by first-past-the-post voting for a four-year term of office. No elections were held in South Gloucestershire, which is a unitary authority outside the area covered by the County Council.
An election to Staffordshire County Council took place on 2 May 2013 as part of the 2013 United Kingdom local elections. 62 electoral divisions returned one county councillor each by first-past-the-post voting for a four-year term of office. Following a boundary review, new electoral division boundaries were established for this election. No elections were held in Stoke-on-Trent, which is a unitary authority outside the area covered by the County Council. The council continues to be administered on the Leader and Cabinet model.
An election to Dorset County Council took place on 2 May 2013 as part of the United Kingdom local elections. 45 councillors were elected from 42 electoral divisions, which returned either one or two county councillors each by first-past-the-post voting for a four-year term of office. The electoral divisions were the same as those used at the previous election in 2009. No elections were held in Bournemouth or Poole, which are unitary authorities outside the area covered by the County Council. The election saw the Conservative Party maintain overall control of the council.
An election to Northamptonshire County Council took place on 2 May 2013 as part of the 2013 United Kingdom local elections. Following a boundary review, the number of county councillors was reduced from 73 to 57 from this election. All members were elected by first-past-the-post voting from single-member electoral divisions for a four-year term of office. The Conservative Party held on to their overall majority, having held overall control of the council since 2005.
An election to Lancashire County Council took place on 4 May 2017 as part of the 2017 local elections across the UK. All 84 councillors were elected for single-member and dual-member divisions for a four-year term of office. The system of voting used is first-past-the-post. Elections are held in all electoral divisions across the present ceremonial county, excepting Blackpool and Blackburn with Darwen which are unitary authorities.
The 2017 United Kingdom local elections were held on Thursday 4 May 2017. Local elections were held across Great Britain, with elections to 35 English local authorities and all councils in Scotland and Wales.
An election to Derbyshire County Council took place on 4 May 2017 as part of the 2017 United Kingdom local elections. 64 councillors were elected from 61 electoral divisions which returned either one or two county councillors each by first-past-the-post voting for a four-year term of office. No elections were held in the City of Derby, which is a unitary authority outside the area covered by the County Council. The Conservative Party won back control of the council, taking thirty-seven of the authority's sixty-four seats.
The 2017 Gloucestershire County Council election took place on 4 May 2017 as part of the 2017 local elections in the United Kingdom. All 53 councillors were elected from electoral divisions which returned one county councillor each by first-past-the-post voting for a four-year term of office. Control of the council went from a Conservative Party minority to a majority administration.
An election to Oxfordshire County Council took place on 5 May 2005 as part of the 2005 United Kingdom local elections, coinciding with the 2005 United Kingdom general election. 74 councillors were elected from various electoral divisions, which returned either one, two or three county councillors each by first-past-the-post voting for a four-year term of office. This was the first election using the new electoral divisions following proposals from the Electoral Commission in 2004, meaning the council would consist of three seats more than previously.
The 2022 Bury Metropolitan Borough Council election took place on 5 May 2022. Due to boundary changes, all 51 councillors were elected at the same time. The election took place alongside other local elections across the United Kingdom.
The 2022 Rochdale Metropolitan Borough Council election took place as of 5 May 2022. Due to boundary changes, all 60 councillors were elected at the same time. The election took place alongside other local elections across the United Kingdom.