One third of the City of Lincoln Council in Lincolnshire, England is elected each year, followed by one year when there is an election to Lincolnshire County Council instead. The council is divided up into 11 wards, electing 33 councillors, since the last boundary changes in 2007.
Local elections were held in the United Kingdom on 6 May 1976. Elections were for one third of the seats on Metropolitan borough councils and for all seats on Non-Metropolitan district councils in England; and for all seats on the Welsh district councils.

The 1998 City of Lincoln Council election took place on 7 May 1998 to elect members of Lincoln District Council in Lincolnshire, England. One third of the council was up for election and the Labour party stayed in overall control of the Council.

Elections to City of Lincoln Council in Lincolnshire, England, were held on 6 May 1999. The whole council was up for election with boundary changes since the last election in 1998. The Labour party stayed in overall control of the Council.

Elections to City of Lincoln Council in Lincolnshire, England, were held on 4 May 2000. One third of the council was up for election and the Labour Party stayed in overall control of the council.

Elections to City of Lincoln Council in Lincolnshire, England, were held on 2 May 2002. One third of the council was up for election and the Labour Party stayed in overall control of the council.

Elections to City of Lincoln Council in Lincolnshire, England, were held on 1 May 2003. One third of the Council was up for election and the Labour Party stayed in overall control of the council.

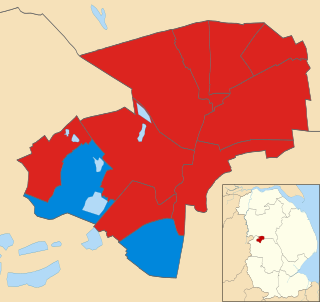
Elections to City of Lincoln Council in Lincolnshire, England, were held on 10 June 2004. One third of the council was up for election and the Labour Party stayed in overall control of the council.
The 2014 City of Lincoln Council election took place on 22 May 2014 to elect members of City of Lincoln Council in England. This was on the same day as other local elections. The Labour Party increased its majority on the council by gaining three seats, leaving them with 27 seats to the Conservatives 6.

The 2007 City of Lincoln Council election took place on 3 May 2007 to elect members of City of Lincoln Council in Lincolnshire, England. This was held on the same day as other local elections. All 33 seats were up for election, with 3 councillors in each of the 11 wards being elected following a boundary review. The Conservative Party gained control of the council from the Labour Party.

The 2008 City of Lincoln Council election took place on 1 May 2008 to elect members of City of Lincoln Council in Lincolnshire, England. This was held on the same day as other local elections. One third 33 seats were up for election, with one councillor in each of the 11 wards being elected. As the previous election in 2007 had been an all-out election with new ward boundaries, the seats of the candidates that had finished third in each ward in 2006 were up for election. The Conservative Party retained control of the council.

The 2010 City of Lincoln Council election took place on 6 May 2010 to elect members of City of Lincoln Council in Lincolnshire, England. This was held on the same day as other local elections, as well as the parliamentary general election. One third 33 seats were up for election, with one councillor in each of the 11 wards being elected. As the previous election in 2008 had been an all-out election with new ward boundaries, the seats of the candidates that had finished third in each ward in 2016 were up for election. The Conservative Party retained control of the council.
The 1973 City of Lincoln Council election were the first elections to the newly created City of Lincoln Council and took place on 7 June 1973. This was on the same day as other local elections. The Local Government Act 1972 stipulated that the elected members were to shadow and eventually take over from the predecessor corporation on 1 April 1974. The election resulted in the Democratic Labour Party gaining control of the council.

The 1979 City of Lincoln Council election took place on 3 May 1979. This was on the same day as other local elections. This was the first election to be held under new ward boundaries. The entire council was up for election and the Conservative Party gained control of the council from the Democratic Labour Party.

The 1980 City of Lincoln Council election took place on 1 May 1980. This was on the same day as other local elections. One third of the council was up for election: the seats of the candidates who polled third at the all out election of 1979. The Conservative Party retained control of the council.

The 1982 City of Lincoln Council election took place on 6 May 1982. This was on the same day as other local elections. One third of the council was up for election: the seats of the second-highest polling candidates at the all out election of 1979. The Labour Party gained control of the council from the Conservative Party.

The 1984 City of Lincoln Council election took place on 3 May 1984. This was on the same day as other local elections. One third of the council was up for election: the seats of which were last contested in 1980. The Labour Party retained control of the council.
The 1991 City of Lincoln Council election took place on 2 May 1991. This was on the same day as other local elections. One third of the council was up for election: the seats of which were last contested in 1987. The Labour Party retained control of the council.

The 1996 City of Lincoln Council election took place on 2 May 1996. This was on the same day as other local elections. One third of the council was up for election: the seats of which were last contested in 1992. The Labour Party retained control of the council.

Elections to City of Lincoln Council in Lincolnshire, England, were held on 4 May 2006. One third of the Council was up for election and the Labour Party stayed in Overall control of the Council.