County result maps
 1981 results map
 1985 results map
 1989 results map
 1993 results map
 1997 results map
 2001 results map
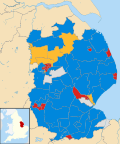 2005 results map
 2009 results map
 2013 results map
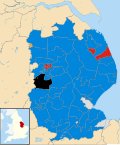 2017 results map
 2021 results map
 2025 results map
Lincolnshire County Council in England is elected every four years.
| Year | Conservative | Labour | Liberal Democrats [a] | Reform | Green | UKIP | DLP | Independents & Others | Council control after election | |
|---|---|---|---|---|---|---|---|---|---|---|
| Local government reorganisation; council established (75 seats) | ||||||||||
| 1973 | 35 | 9 | 3 | – | – | – | 5 | 23 | No overall control | |
| 1977 | 54 | 5 | 2 | – | 0 | – | 1 | 13 | Conservative | |
| New division boundaries; seats increased from 75 to 76 | ||||||||||
| 1981 | 42 | 13 | 10 | – | 0 | – | – | 11 | Conservative | |
| 1985 | 39 | 14 | 20 | – | 0 | – | – | 3 | Conservative | |
| 1989 | 39 | 19 | 12 | – | 0 | – | – | 6 | Conservative | |
| 1993 | 31 | 25 | 15 | – | 0 | – | – | 5 | No overall control | |
| 1997 | 43 | 19 | 11 | – | 0 | 0 | – | 3 | Conservative | |
| New division boundaries; seats increased from 76 to 77 | ||||||||||
| 2001 | 49 | 21 | 4 | – | 0 | 0 | – | 3 | Conservative | |
| 2005 | 45 | 21 | 8 | – | 0 | 0 | – | 3 | Conservative | |
| 2009 | 60 | 4 | 5 | – | 0 | 0 | – | 8 [b] | Conservative | |
| 2013 | 36 | 12 | 3 | – | 0 | 16 | – | 10 [c] | No overall control | |
| New division boundaries; seats reduced from 77 to 70 | ||||||||||
| 2017 | 58 | 6 | 1 | – | 0 | 0 | – | 5 [d] | Conservative | |
| 2021 | 54 | 4 | 3 | 0 | 0 | 0 | – | 9 [e] | Conservative | |
| 2025 | 14 | 3 | 5 | 44 | 0 | 0 | – | 4 [f] | Reform | |


| Party | Candidate | Votes | % | ±% | |
|---|---|---|---|---|---|
| Conservative | 449 | 46.8 | −19.2 | ||
| Liberal Democrats | 354 | 36.9 | +36.9 | ||
| Labour | 156 | 16.3 | −17.7 | ||
| Majority | 95 | 9.9 | |||
| Turnout | 959 | 13.0 | |||
| Conservative hold | Swing | ||||
| Party | Candidate | Votes | % | ±% | |
|---|---|---|---|---|---|
| Liberal Democrats | 296 | 46.9 | +11.5 | ||
| Conservative | 212 | 33.6 | +7.0 | ||
| Labour | 105 | 16.6 | −18.5 | ||
| Independent | 18 | 2.9 | +2.9 | ||
| Majority | 84 | 13.3 | |||
| Turnout | 631 | 13.5 | |||
| Liberal Democrats hold | Swing | ||||
| Party | Candidate | Votes | % | ±% | |
|---|---|---|---|---|---|
| Labour | 524 | 45.9 | −17.4 | ||
| Independent | 339 | 29.7 | +17.3 | ||
| Conservative | 235 | 20.6 | +0.0 | ||
| Green | 44 | 3.9 | +3.9 | ||
| Majority | 185 | 16.2 | |||
| Turnout | 1,142 | 20.6 | |||
| Labour hold | Swing | ||||
| Party | Candidate | Votes | % | ±% | |
|---|---|---|---|---|---|
| Conservative | Peter Bedford | 800 | 57.9 | +10.3 | |
| UKIP | Sue Ransome | 217 | 15.7 | −8.8 | |
| Labour | Paul Kenny | 205 | 14.8 | −13.2 | |
| Liberal Democrats | Albert Tebbs | 160 | 11.6 | +11.6 | |
| Majority | 583 | 42.2 | |||
| Turnout | 1,382 | 25.0 | |||
| Conservative hold | Swing | ||||
| Party | Candidate | Votes | % | ±% | |
|---|---|---|---|---|---|
| Conservative | Charlotte Farquharson | 657 | 44.6 | −2.5 | |
| Labour | Trevor Holmes | 435 | 29.5 | +2.6 | |
| Liberal Democrats | Timothy Fitzgerald | 255 | 17.3 | −8.7 | |
| UKIP | Jamie Corney | 127 | 8.6 | +8.6 | |
| Majority | 222 | 15.1 | |||
| Turnout | 1,474 | 23.5 | |||
| Conservative hold | Swing | ||||
| Party | Candidate | Votes | % | ±% | |
|---|---|---|---|---|---|
| Conservative | Clive Oxby | 877 | 61.8 | +14.5 | |
| Labour | Darren Hopewell | 206 | 14.5 | −26.9 | |
| Liberal Democrats | Roy Harris | 137 | 9.7 | +9.7 | |
| BNP | Michael Clayton | 126 | 8.9 | +8.9 | |
| UKIP | Steven Pearson | 52 | 3.7 | −7.6 | |
| Independent | Victor Sahunta | 21 | 1.5 | +1.5 | |
| Majority | 671 | 47.3 | |||
| Turnout | 1,419 | 26.2 | |||
| Conservative hold | Swing | ||||
| Party | Candidate | Votes | % | ±% | |
|---|---|---|---|---|---|
| Conservative | Hugo Marfleet | 1,013 | 49.9 | +13.5 | |
| Independent | Daniel Simpson | 361 | 17.8 | −0.6 | |
| Liberal Democrats | Eric Needham | 304 | 15.0 | −18.4 | |
| BNP | Robert West | 219 | 10.8 | +10.8 | |
| Labour | Michael Preen | 75 | 3.7 | +3.7 | |
| UKIP | Barry Gleeson | 59 | 2.9 | −9.0 | |
| Majority | 652 | 32.1 | |||
| Turnout | 2,031 | 31.9 | |||
| Conservative hold | Swing | ||||
| Party | Candidate | Votes | % | ±% | |
|---|---|---|---|---|---|
| Conservative | Sue Woolley | 760 | 41.4 | −12.9 | |
| Independent | Helen Powell | 355 | 19.3 | +19.3 | |
| BNP | David Owens | 239 | 13.0 | +13.0 | |
| Labour | Roberta Britton | 202 | 11.0 | −34.7 | |
| Liberal Democrats | Peter Morris | 198 | 10.8 | +10.8 | |
| Green | Ashley Baxter | 42 | 2.3 | +2.3 | |
| UKIP | Peter Oldham | 41 | 2.2 | +2.2 | |
| Majority | 405 | 22.1 | |||
| Turnout | 1,837 | 21.0 | |||
| Conservative hold | Swing | ||||
| Party | Candidate | Votes | % | ±% | |
|---|---|---|---|---|---|
| Conservative | Andrea Jenkyns | 597 | 38.7 | +13.2 | |
| BNP | David Owens | 581 | 37.7 | +17.1 | |
| Labour | Pam Kenny | 204 | 13.2 | +1.9 | |
| Liberal Democrats | Michael Shriden-Shinn | 160 | 10.4 | +3.2 | |
| Majority | 16 | 1.0 | |||
| Turnout | 1,542 | 21.3 | |||
| Conservative hold | Swing | ||||
| Party | Candidate | Votes | % | ±% | |
|---|---|---|---|---|---|
| Conservative | Andrew Hagues | 614 | 43.0 | −2.4 | |
| Lincolnshire Independent | David Suiter | 454 | 31.8 | +31.8 | |
| Labour | Jim Clarke | 315 | 22.1 | +13.5 | |
| Liberal Democrats | David Harding-Price | 45 | 3.2 | −7.9 | |
| Majority | 160 | 11.2 | |||
| Turnout | 1,428 | ||||
| Conservative hold | Swing | ||||
| Party | Candidate | Votes | % | ±% | |
|---|---|---|---|---|---|
| Labour | Robin Renshaw | 563 | 48.8 | +14.5 | |
| Conservative | Simon Parr | 314 | 27.2 | −11.8 | |
| Liberal Democrats | John Bishop | 95 | 8.2 | −18.5 | |
| UKIP | Pat Nurse | 79 | 6.8 | +6.8 | |
| TUSC | Nick Parker | 79 | 6.8 | +6.8 | |
| English Democrat | Elliot Fountain | 24 | 2.1 | +2.1 | |
| Majority | 249 | 21.6 | |||
| Turnout | 1,154 | ||||
| Labour gain from Conservative | Swing | ||||
| Party | Candidate | Votes | % | ±% | |
|---|---|---|---|---|---|
| Conservative | Jackie Brockway | 1,026 | 43.4 | +9.4 | |
| Liberal Democrats | Charles Shaw | 600 | 25.4 | −35.1 | |
| UKIP | Howard Thompson | 266 | 11.2 | +11.2 | |
| Labour | Richard Coupland | 257 | 10.9 | +5.4 | |
| Lincolnshire Independent | David Watson | 196 | 8.3 | +8.3 | |
| English Democrat | Elliot Fountain | 21 | 0.9 | +0.9 | |
| Majority | 426 | 18.0 | |||
| Turnout | 2,366 | ||||
| Conservative gain from Liberal Democrats | Swing | ||||
| Party | Candidate | Votes | % | ±% | |
|---|---|---|---|---|---|
| Liberal Democrats | Lesley Rollings | 726 | 49.2 | +26.3 | |
| Conservative | Richard Butroid | 348 | 23.6 | −18.4 | |
| UKIP | Nick Smith | 264 | 17.9 | −7.1 | |
| Lincolnshire Independent | Chris Darcel | 137 | 9.3 | +9.3 | |
| Majority | 378 | 25.6 | |||
| Turnout | 1,475 | ||||
| Liberal Democrats gain from Conservative | Swing | ||||
| Party | Candidate | Votes | % | ±% | |
|---|---|---|---|---|---|
| UKIP | Robert Foulkes | 400 | 31.5 | +31.5 | |
| Labour | Mark Ashberry | 268 | 21.1 | +0.1 | |
| Conservative | Matthew Lee | 261 | 20.6 | −11.0 | |
| Lincolnshire Independent | Max Sawyer | 199 | 15.7 | +15.7 | |
| Liberal Democrats | Harrish Bisnauthsing | 142 | 11.2 | +11.2 | |
| Majority | 132 | 10.4 | |||
| Turnout | 1,270 | ||||
| UKIP gain from Independent | Swing | ||||
| Party | Candidate | Votes | % | ±% | |
|---|---|---|---|---|---|
| Conservative | Mark Whittington | 579 | 49.5 | +11.7 | |
| Labour | Rob Shorrock | 257 | 22.0 | −7.9 | |
| UKIP | Maureen Simon | 179 | 15.3 | +15.3 | |
| Lincolnshire Independent | Mike Williams | 155 | 13.2 | +13.2 | |
| Majority | 322 | 27.5 | |||
| Turnout | 1,170 | ||||
| Conservative hold | Swing | ||||
| Party | Candidate | Votes | % | ±% | |
|---|---|---|---|---|---|
| Conservative | Charlotte Vernon | 986 | 59.6 | −17.2 | |
| Liberal Democrats | Harrish Bisnauthsing | 277 | 16.8 | +16.8 | |
| Labour | Stuart Fawcett | 269 | 16.3 | −6.9 | |
| Green | Mike Turner | 121 | 7.3 | +7.3 | |
| Majority | 709 | 42.9 | |||
| Turnout | 1,653 | ||||
| Conservative hold | Swing | ||||
| Party | Candidate | Votes | % | ±% | |
|---|---|---|---|---|---|
| SH Independents | Manzur Hasan | 676 | 63.2 | −17.5 | |
| Conservative | Paul Redgate | 393 | 36.8 | +17.5 | |
| Majority | 283 | 26.4 | |||
| Turnout | 1,069 | ||||
| SH Independents hold | Swing | ||||
| Party | Candidate | Votes | % | ±% | |
|---|---|---|---|---|---|
| Conservative | Alan Briggs | 759 | 32.5 | −31.3 | |
| Lincolnshire Independent | Charles Overton | 470 | 20.1 | +20.1 | |
| Labour | Calum Watt | 439 | 18.8 | +4.4 | |
| Independent | Nikki Dillon | 299 | 12.8 | −3.5 | |
| Liberal Democrats | Tony Richardson | 178 | 7.6 | +2.1 | |
| Green | Sally Horscroft | 103 | 4.4 | +4.4 | |
| Reform | Nicola Smith | 75 | 3.2 | +3.2 | |
| Liberal | Charles Shaw | 10 | 0.4 | +0.4 | |
| Majority | 289 | 12.4 | |||
| Turnout | 2,333 | ||||
| Conservative hold | Swing | ||||
| Party | Candidate | Votes | % | ±% | |
|---|---|---|---|---|---|
| Labour | Neil Murray | 896 | 48.0 | −9.8 | |
| Liberal Democrats | James Brown | 680 | 36.4 | +32.5 | |
| Conservative | Thomas Hulme | 150 | 8.0 | −16.4 | |
| TUSC | Nick Parker | 74 | 4.0 | +2.3 | |
| Reform | Jane Smith | 66 | 3.5 | +3.5 | |
| Majority | 216 | 11.6 | |||
| Turnout | 1,866 | ||||
| Labour hold | Swing | ||||
| Party | Candidate | Votes | % | ±% | |
|---|---|---|---|---|---|
| Conservative | Paul Martin | 762 | 39.2 | −31.6 | |
| Independent | Tim Harrison | 446 | 23.0 | +23.0 | |
| Labour | Jonathan Cook | 380 | 19.6 | +2.1 | |
| Green | Anne Gayfer | 193 | 9.9 | −1.8 | |
| Liberal Democrats | Nat Sweet | 87 | 4.5 | +4.5 | |
| Independent | Dean Ward | 74 | 3.8 | +3.8 | |
| Majority | 316 | 16.3 | |||
| Turnout | 1,942 | ||||
| Conservative hold | Swing | ||||
| Party | Candidate | Votes | % | ±% | |
|---|---|---|---|---|---|
| Labour | Debbie Armiger | 1,054 | 45.2 | −1.7 | |
| Liberal Democrats | Martin Christopher | 656 | 28.1 | +11.2 | |
| Reform | Jane Smith | 212 | 9.1 | +5.7 | |
| Green | Sally Horscroft | 192 | 8.2 | −1.1 | |
| Conservative | Charlie Rogers | 148 | 6.3 | −14.8 | |
| TUSC | Emma Knight | 48 | 2.1 | −0.3 | |
| Liberal | Charles Shaw | 22 | 0.9 | +0.9 | |
| Majority | 398 | 17.1 | |||
| Turnout | 2,332 | ||||
| Labour hold | Swing | ||||
| Current | |
|---|---|
| Former | |
aUnitary authorities referred to as county councils | |